Chart Nodes Pane
Nodes Pane
All the nodes of the chart view are listed under this pane. Dimensions, measures, expressions can be selected and added to the chart by clicking + icon next to their related pane.
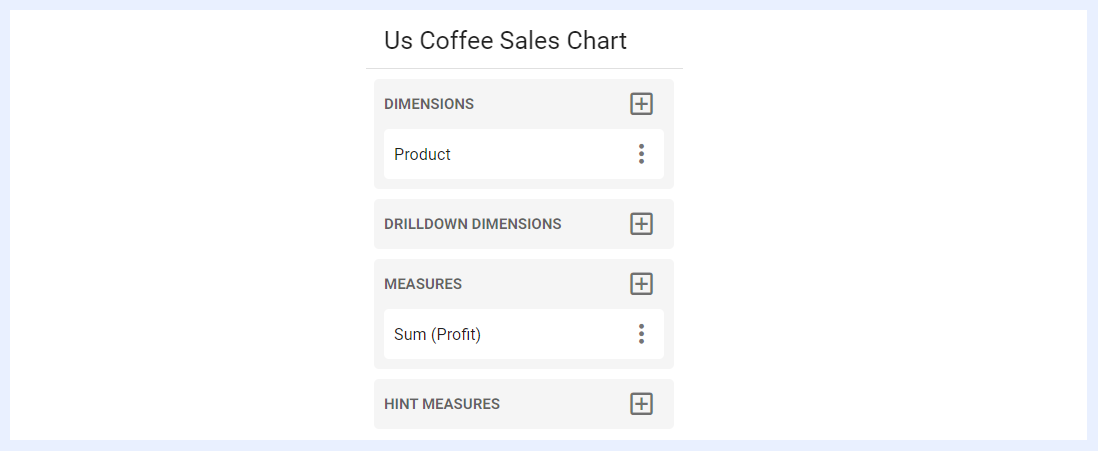
“DIMENSIONS” Pane
“DIMENSIONS” pane lists all the nodes that can be added as dimension(s) to the chart, from which the user can add/select the required one(s) by clicking + icon located next to the pane.
“DIMENSIONS” tab lists all the nodes of type “Dimension” as set in the related view.
“EXPRESSIONS” tab lists all the expressions that were added using SQL to the view as virtual dimensions. When added to the chart, its data will update and filter according to the selected dimension expression.
“HISTOGRAM” tab allows adding a histogram to a dimension in a chart, which means that the chart will display a graphical representation of the distribution of the values of that dimension. A histogram is a bar graph that shows the frequency or count of values within a certain range of values. For example, if you have a chart that shows the sales data for different products, and you add a histogram to the product dimension, the chart will show the frequency of sales for each product. The histogram will display bars of varying heights, with each bar representing a range of sales values. The taller the bar, the greater the frequency of sales for products within that range.
“HINT DIMENSIONS” Pane
“HINT DIMENSIONS” pane lists nodes of type “Dimension” other than the main selected dimension(s), and when a dimension is added as a “HINT DIMENSION”, this dimension will appear as a hint or tooltip when the user hovers over the chart's data points, providing additional information about the data being displayed.
“DRILLDOWN DIMENSIONS” Pane
“DRILLDOWN DIMENSIONS” pane lists nodes of type “Dimension” other than the main selected dimension(s), and when a dimension is added under this option, the chart will update to show and drilldown the data for the selected dimension.
“MEASURES” Pane
“MEASURES” pane lists all the nodes that can be added as measure(s) to the chart, from which the user can add/select the required one(s) by clicking + icon located next to the pane.
“MEASURES” tab lists all the nodes of type “Measure” as set in the related view.
“EXPRESSIONS” tab lists all the expressions that were added using SQL to the view as virtual measures.
“DIM COUNT” tab allows for the addition of unique variables or dimensions that can be used as measures to display data.
“HINT MEASURES” Pane
“HINT MEASURES” pane lists nodes of type “Measure” other than the main selected measure(s), and when a measure is added as a “HINT MEASURE”, it will appear as a hint or tooltip when the user hovers over the chart's measures, providing additional information about the data being displayed.
“DRILLDOWN MEASURES” Pane
“DRILLDOWN MEASURES” pane lists nodes of type “Measure” other than the main selected measure(s), and when added under this option, the chart will update to show and drilldown the data for the selected measure.