Expressions in Views
Expressions are the virtual dimensions or measures created using SQL to allow for more detailed analysis. They liberate designers from the limitations of database fields and open the door to new insights. Once created, expressions can be used in any dashlet where this view is applied.
It is crucial to understand when to use expressions and their practical use cases. By effectively utilizing expressions in TURBOARD, users can unlock deeper insights and create more powerful, interactive, and insightful dashboards that drive informed decision-making across the organization.
When to Use Expressions
- Creating New Metrics: When you need to calculate new fields based on existing data. For example, creating a ‘DiscountedPrice’ field by subtracting the ‘DiscountAmount’ from the ‘ListPrice’.
- Data Categorization: When you need to categorize data based on certain conditions. For instance, creating a ‘SalesCategory’ based on the quantity sold.
- Advanced Aggregations: When you need to perform complex aggregations that are not directly available in the data source. For instance, you can create an expression to calculate the age by subtracting the birth date from the current date, or calculate the ratio of sales amounts for each store in relation to the total sales for the region that store belongs to.
- Data Transformation: When you need to transform data into a different format or structure for analysis. For example, converting a date field into a specific format or extracting parts of a string.
Benefits of Using Expressions
By using expressions, custom fields that do not exist in the original data source can be created as needed, tailored to specific analytical requirements.
Expressions reduce the need for repeated complex calculations at the dashlet level and simplify data management, especially if the same view will be used in several dashlets. They allow standardizing calculations across multiple dashlets, ensuring uniformity in data analysis.
Expressions enable deeper data analysis by creating complex metrics and categorizations that aren't possible with standard fields.
Types of Expressions
There are four types of expressions in TURBOARD:
- Dimension Expressions: to create new dimensions for categorizing data.
- Aggregate Measure Expressions: to perform aggregate calculations like SUM, AVG, COUNT.
- Singular Expressions: to calculate individual measures without aggregation.
- Filter Expressions: to create new filters and limit the data set based on specific criteria.
Dimension/Filter Expressions
A dimension expression returns the singular values of a field as a result. The type of “Case-When” queries are treated as dimension expressions. The dimension expression is combined with the measure or measure expression can be used together, and the query is grouped according to itself. The dimension expression can also be used as a filter through “Use as Filter” check box.
When writing your query and since grouping is done automatically, GROUP BY is not written in the query. In addition, the ORDER BY statement cannot be used because the sorting process is set on the Dashlet.
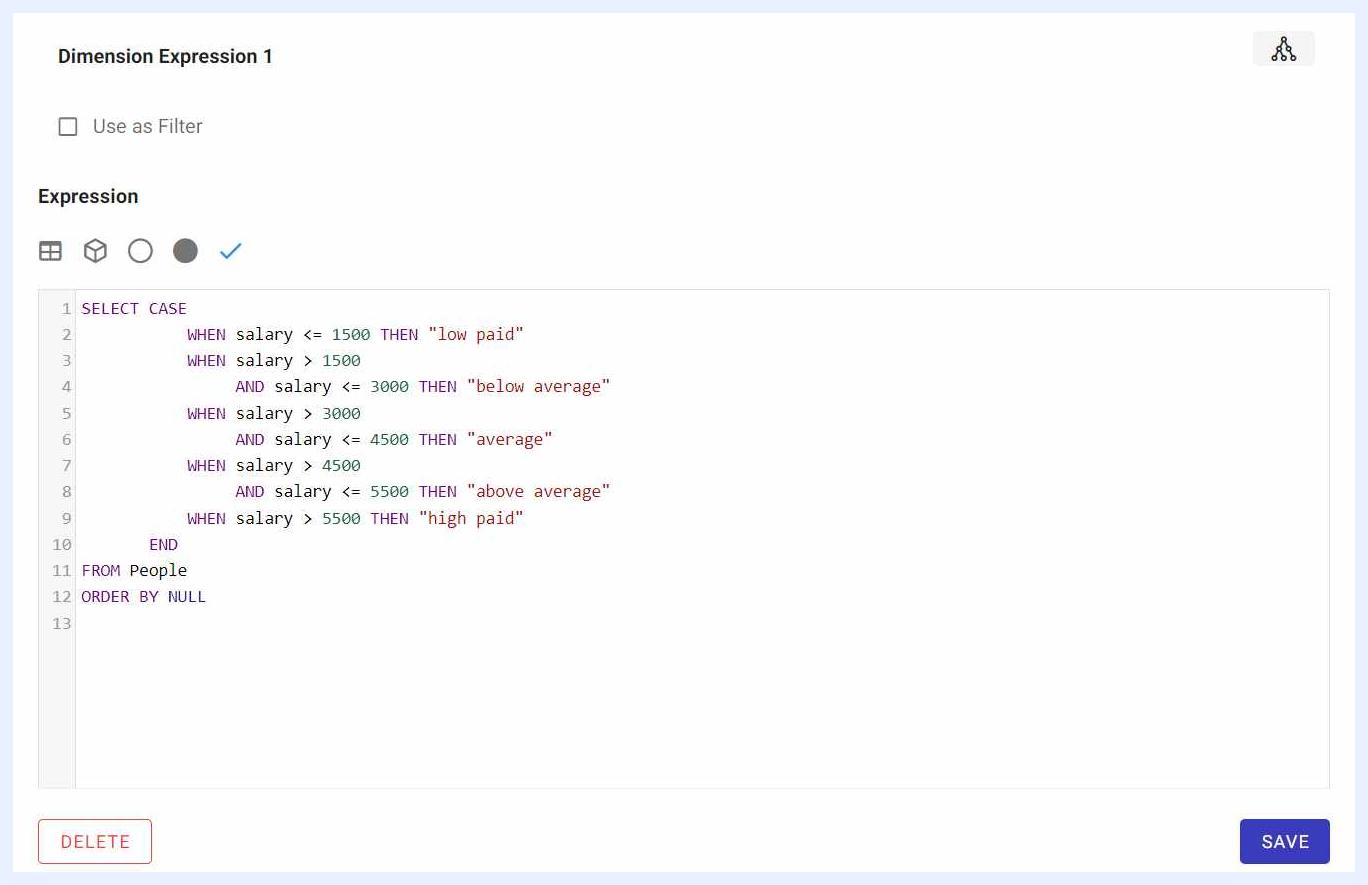
Dimension Expression
In the dimension expression above, we have gathered 4 main groups of people according to their BMI values.
Aggregate Measure Expressions
An aggregate measure expression returns an aggregated version of the measure field, which is then grouped by a dimension or another dimension expression. The measure expression must contain an aggregate function, otherwise the expression will not work.
The aggregate functions that can be used are AVG (mean), SUM (total), MIN (minimum), MAX (maximum), DISTINCT COUNT (number of individual rows), COUNT (number of rows), STDEV (Standard deviation), and VARIANCE (Variance).
For example, the expression in the image below subtracts the average of field1 to the average of field2 then rounds up.
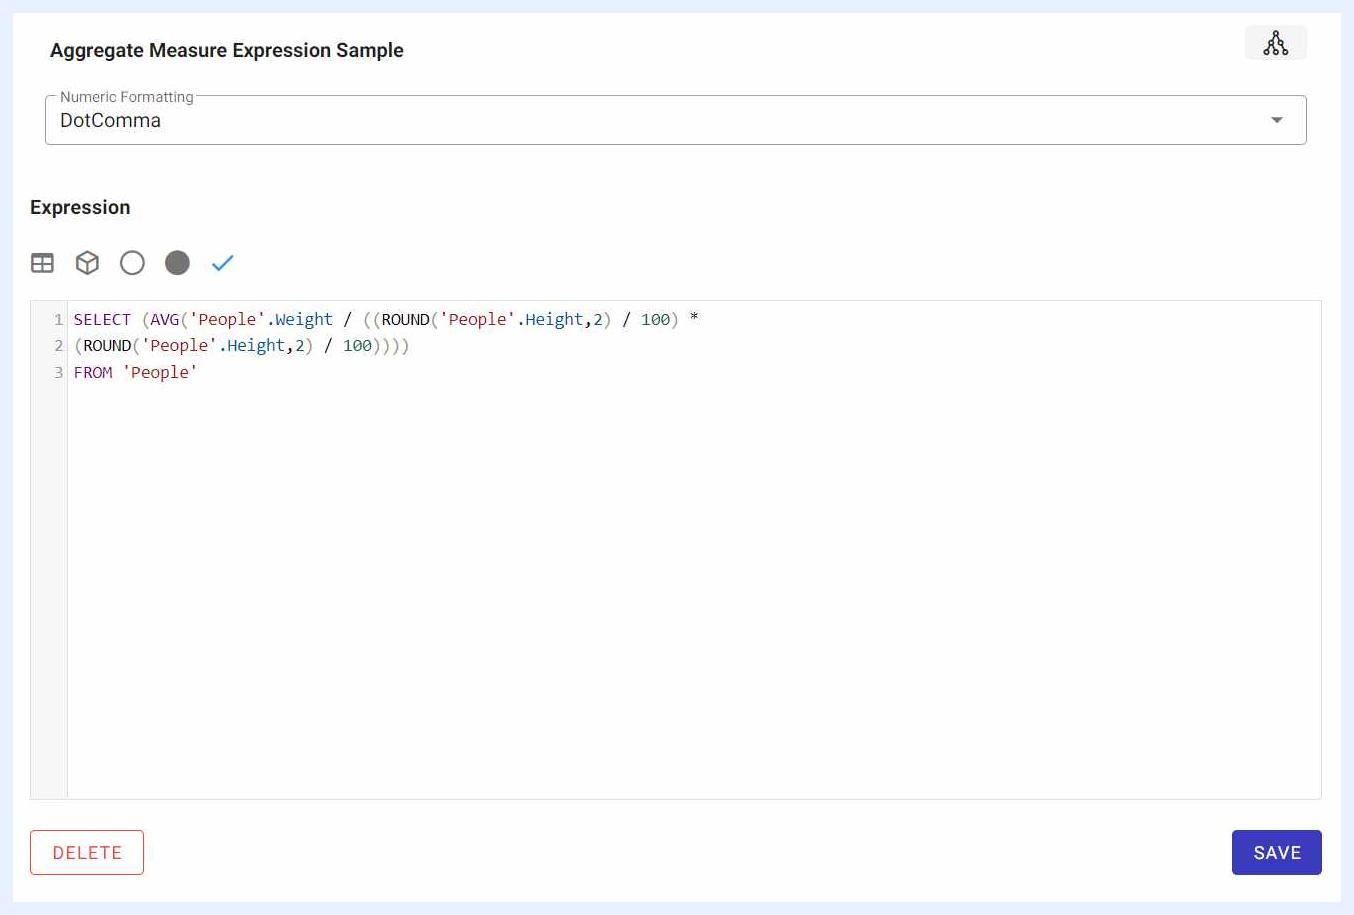
Aggregate Measure Expression
Singular Expressions
It is used to take the singular values of a measure or a mathematical operation between measures. Clustering functions are not used in these expressions, they are calculated separately for each row.
For example, finding the body mass index for each person on a table containing the height and weight information of the person is done with this type of expression. As with measure expressions, the terms GROUP BY or ORDER BY are not used.
In the expression example above, the BMI values of each person were subtracted.
Filters Expressions
If the original dataset is different in its nature, the admin user here can allow end-users to filter according to the determined expressions in this option.
For example, if a dataset of people consists of salaries and heights, the salary and the height are numerical fields with nominal values. If we prefer that the end-user searches/filters as “short, middle, tall”, then a filter expression may be created with a case when ... then .... else ... end SQL statement.
Expressions As Measures vs. Calculated Measures in Dashlets
Although expressions allow applying customized calculations using SQL queries for measures on the view level, designer users can also apply such calculations on a dashlet level using Pandas functions in TURBOARD.
Practical Differences:
- Expressions in views are broader in scope and can be reused across multiple dashlets, whereas calculated measures are specific to the dashlet in which they are created.
- Expressions can handle more complex pre-processing and standardization needs, while calculated measures are better suited for simpler, on-the-fly calculations.
- Calculated measures utilize the Pandas library to perform calculations directly within the dashlet interface without querying the database. This enhances performance by shifting computational tasks from the database server to the client’s interface, resulting in a more responsive dashboard. Hence, it is advisable to use calculated measures at the dashlet level whenever possible.
Creating Expressions
How to create an expression?
1 Go to Views “Edit” mode > go to “Expressions” tab > click New Expression + button.
2 Write your expression name in “Alias” field.
3 Choose the expression type that you need to create from the below options:
- Dimension/Filter: to create a dimension,
- Aggregate Measure: to create a measure,
- Singular: to add something to Default Datacells,
- Filter: to create a filter.
4 Click ADD button then write your SQL query in “Expression” field. While writing the query, make sure that the node name is the same as the specified field name.
5 Click “Validate expression” ✓ icon to check if your query is correct, or alternatively, you can click SAVE button.
Minimizing Errors When Creating SQL Expressions
When creating expressions in the SQL querying window, TURBOARD provides several user-friendly features to minimize errors and streamline the process. These features are accessible through icons located at the top-left corner of the SQL editor window, each designed to assist users with building correct and efficient queries. Below is an explanation of these features:
 Table Icon:
This icon allows users to access a list of tables available in the current view. By clicking on this icon, users can select the appropriate table, and TURBOARD will automatically insert the selected table name into the SQL query. This helps avoid errors related to table names and ensures the correct structure is used.
 Nodes Icon:
Nodes represent the fields or columns in the selected table. Clicking the “Nodes” icon opens a list of all available fields within the relevant view’s tables. Users can click on the desired field, and it will be automatically inserted into the query, ensuring that field names are spelled correctly and reducing syntax errors.
 Parameters Icon:
This icon provides a list of user-defined parameters associated with the current view. When a parameter is selected from this list, TURBOARD automatically places it between asterisks and double quotes, like this:
"*ParameterName*". This ensures that the parameter is correctly formatted for dynamic substitution based on user input, enabling flexibility in filtering and analyzing data.
 Pre-defined Variables Icon:
Pre-defined variables represent common variables or values that are frequently used across dashboards or views, such as date ranges or user-specific data. By clicking this icon, users can easily insert these variables into their queries, avoiding the need to manually type them each time.
 Validate Expression Icon:
Once the query is written, users can click on the “Validate Expression” icon (a checkmark) to ensure the syntax and logic of the expression are correct. This validation process checks for common SQL errors and confirms that the query can run successfully before saving it. If there are errors, feedback is provided to guide the user in making corrections.