Dashlets
Dashlet Types
A “Dashlet” is a unit/component of visualization and/or functionality. It can be a chart, a pivot table, an SVG or a GIS map, an info cell or gauge. Dashlets are at the heart of the whole process.
When Designer users create dashlets, they will be listed and displayed to authorized users under “Dashlets” section and they can be edited and/or shared with other users through the dashlet’s ellipsis menu – according to users’ permissions. This also allows designer users to add the dashlet to their dashboards and/or work on its design as a team.
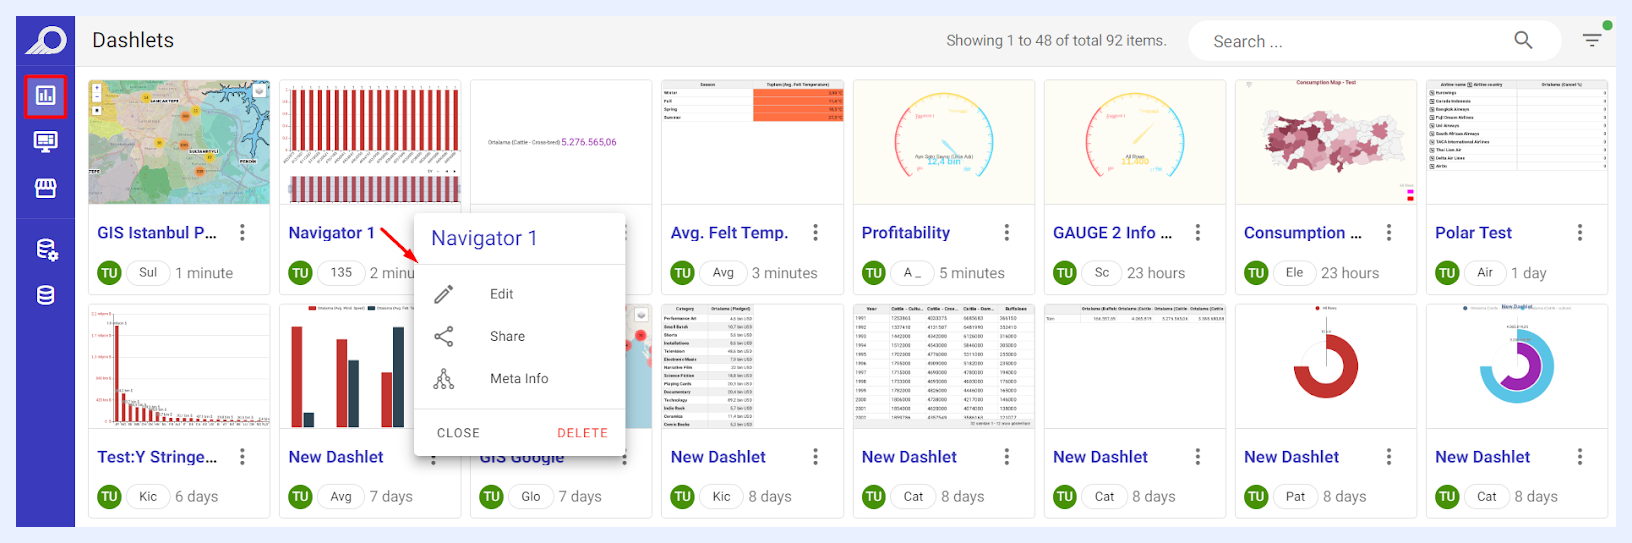
TURBOARD has 5 dashlet types where each presents the data in a different form. Some dashlet types are data dependent. For example, the GIS map requires a geospatial or latitude-longitude field(s).
Chart Dashlets
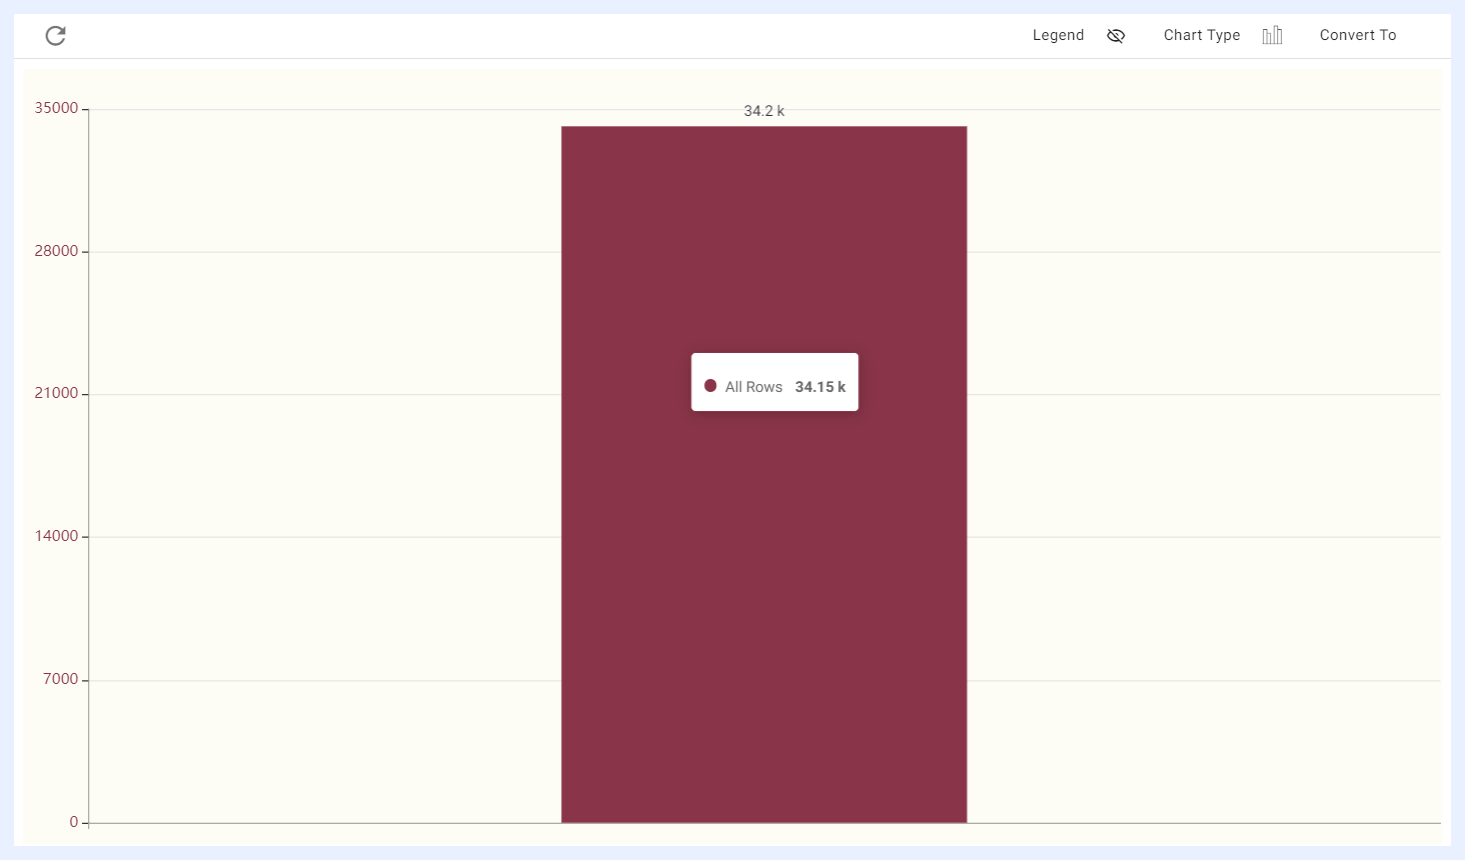
When creating a chart, its default will be a column chart with its measure as the count of the rows of the table.
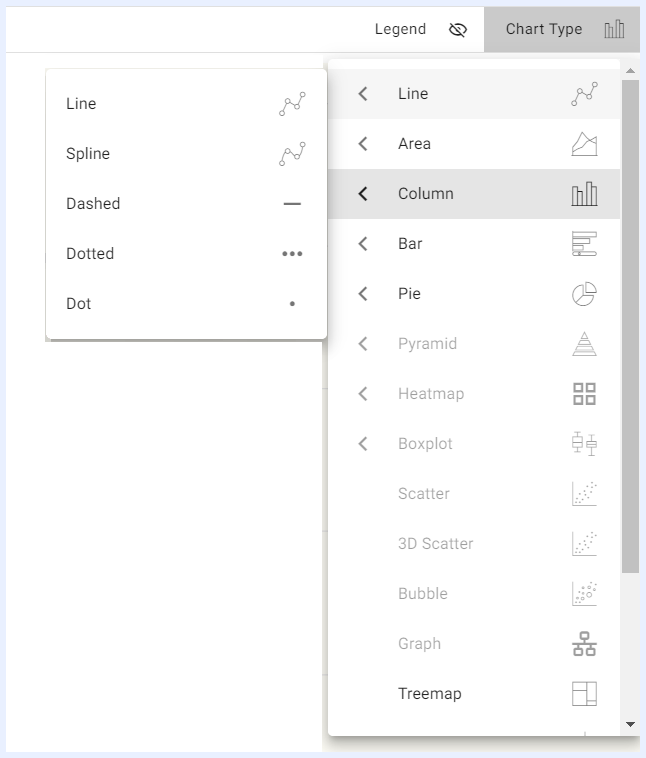
TURBOARD has a rich library of charts that can be used to display data in various ways.
One of the features of TURBOARD is that users can change the chart type directly in the playground section of the platform while working on their dashlet.
When a user selects the required dimension(s) and measure(s), TURBOARD will automatically activate the appropriate chart type or types based on the number of dimensions and measures that have been selected. This helps users choose and find the chart type that works best for their data.
Pivot Tables
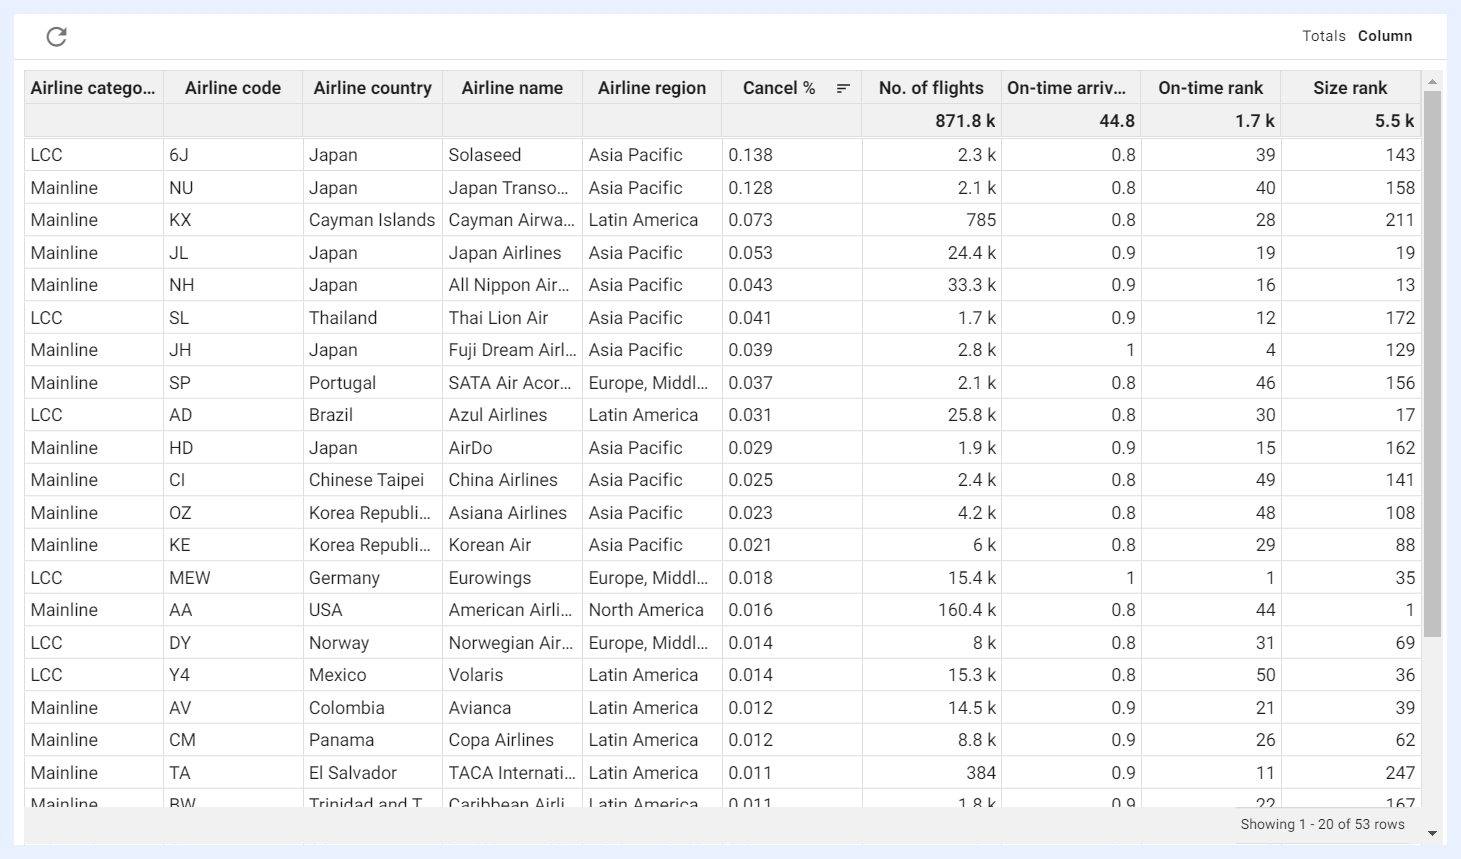
Pivot tables are a type of table that allows users to summarize and analyze large amounts of data by grouping, sorting, and filtering it in various ways.
In a pivot table, data can be presented in a tabular form that is organized into columns and rows, with each cell representing a specific data point. Pivot tables allow users to select both column and row dimensions separately, and these dimensions can be grouped together in various ways to create different views of the data.
One of the key advantages of pivot tables is that there is no limit on the number of dimensions or measures that can be used. This allows users to analyze complex datasets with many variables and to create custom views of the data that best suit their needs.
While charts visualize data in a graphical format, pivot tables organize data in a tabular format, allowing for more detailed analysis and manipulation of the data. Pivot tables allow data to be viewed in a different layout by changing the rows and columns, making it easier to see relationships, totals, averages, percentages, and other summarized information in large data sets.
Info Cells and Gauges
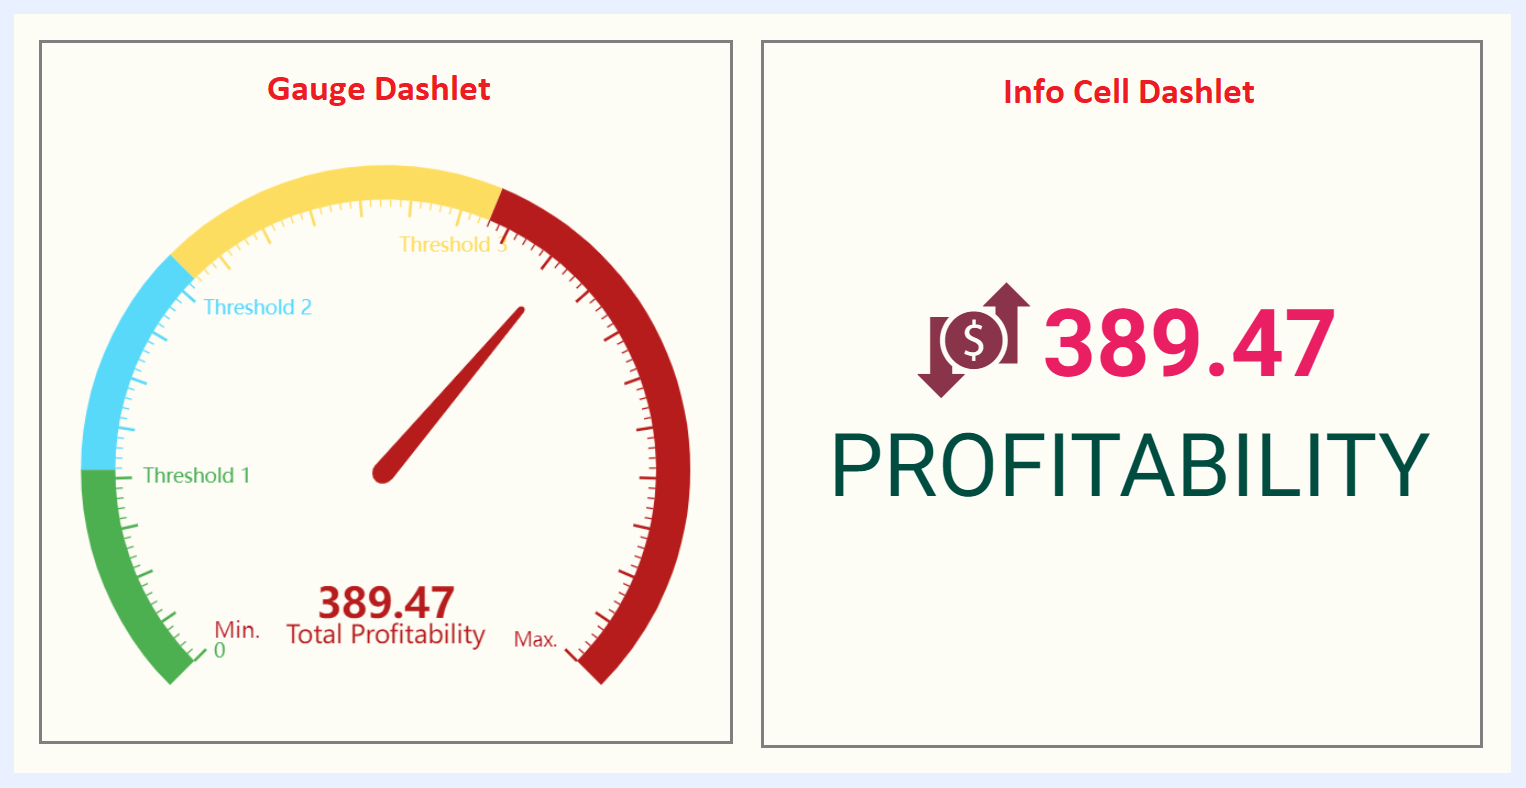
Info cells are often used in dashboards to provide at-a-glance summaries of key metrics or performance indicators, and can be customized to show different colors, fonts, and other visual elements to make them more visually appealing and to help the user quickly identify trends or patterns in the data.
An info cell is a small, rectangular-shaped box that contains a single metric or value, along with some visual indication of whether the value is good, bad, or neutral. The metric or value displayed in an info cell can be a number, a percentage, or some other type of measure, depending on the needs of the dashboard user.
In TURBOARD, an info cell can be converted into a gauge, which is a circular or semicircular dial that is divided into segments or zones, with each segment or zone representing a different range of values. It has a pointer or needle that indicates the current value of the metric being measured. The pointer or needle can be colored or otherwise highlighted to draw attention to values that are outside of normal or expected ranges.
Gauges are often used in dashboards to display metrics such as speed, temperature, or progress towards a goal. They are typically designed to be simple and easy to understand at a glance, with clear indicators of whether the metric is in a good or a bad range.
Info Cell and gauge dashlets can be customized in TURBOARD in various ways to suit the needs of the dashboard user in the dashlet playground (PG) sections.
Regional (SVG) Maps
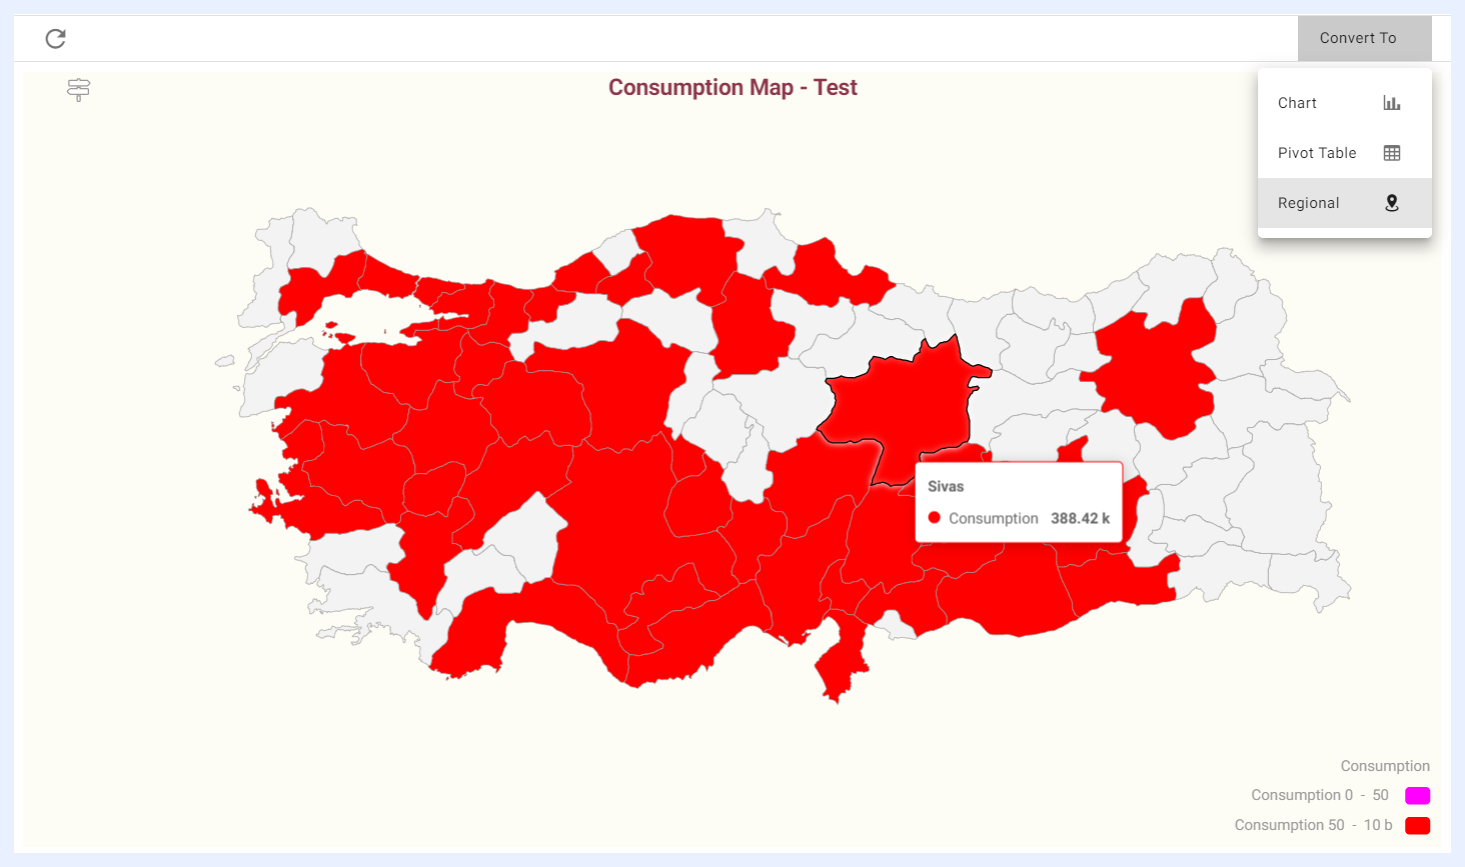
Regional maps are useful in data visualization when you have location information but not specific coordinates (latitude and longitude) or a defined boundary (polygonal region information). They are displayed using SVG (Scalable Vector Graphics) technology, which allows for interactive features such as hover-over tooltips, clickable regions, and other visual elements.
By using a regional map, you can create dashboards or other data visualizations that compare different territories or regions within a dataset as it allows you to create an interactive map dashlet.
For example, if you have a dataset with energy consumption information broken down by state, you could use a regional map to display the consumption data for each state as a color-coded heat map. Users could then interact with the map by hovering over individual states to see more detailed information about the consumption in that region.
Note
The SVG maps that are needed for your data visualizations are uploaded and configured in TURBOARD in “Administration” > “Maps” > “Regional Maps” section.
Geographical (GIS) Maps
A GIS (Geographic Information System) map is a digital map that uses layers of data to represent geographic information. It can include information such as roads, buildings, land use, and demographics, and can be used in an interactive way for analysis, and decision making. It is a toolset for visualizing and analyzing geo-spatial data by showing data points in exact locations using visualizations that are most suited to a map.
To visualize data using GIS in TURBOARD, an add-on module called (GIS-S) is required. This means that only TURBOARD clients who have purchased the GIS-S module will be able to use the “Geographical” dashlet types to create and analyze their data.
Note
GIS maps and basemaps that will be used by designer users to overlay the data points when working with geographical dashlets are configured in “Administration” > “Maps” > “GIS Maps” section.
Visualization Types on Geographical (GIS) Maps
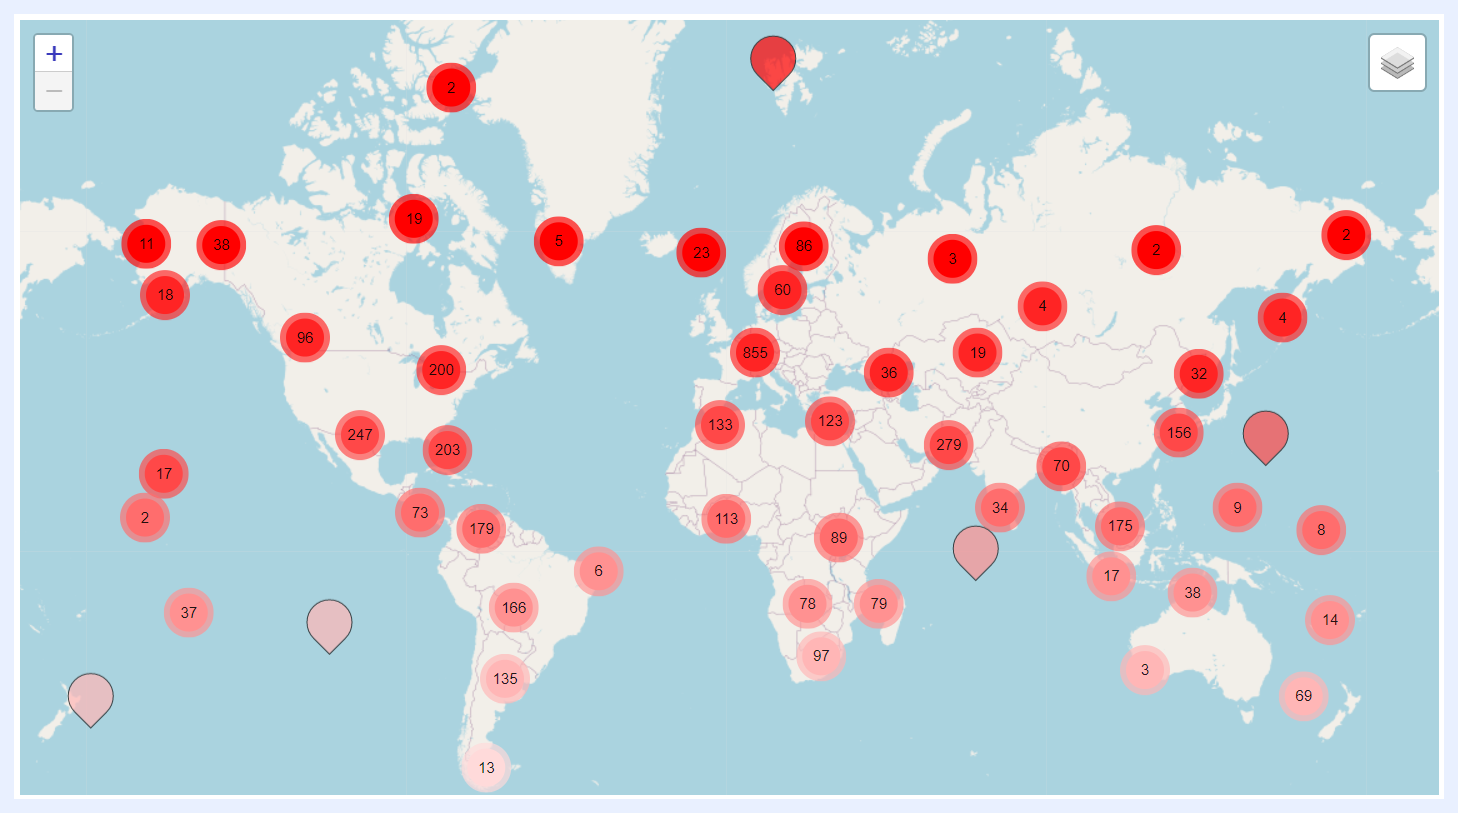
1. Clustered Pin Map:
Shows clusters of data points densities that are located in close proximity to each other as pins. This can be useful when there are a large number of data points on the map and it becomes difficult to distinguish between individual points.
It also allows displaying different types of data on different layers within the map (using basemaps). For example, one layer might show the locations of retail stores, while another layer shows the population density in the surrounding area. By layering different types of data, it becomes easier to see patterns and relationships between different variables.
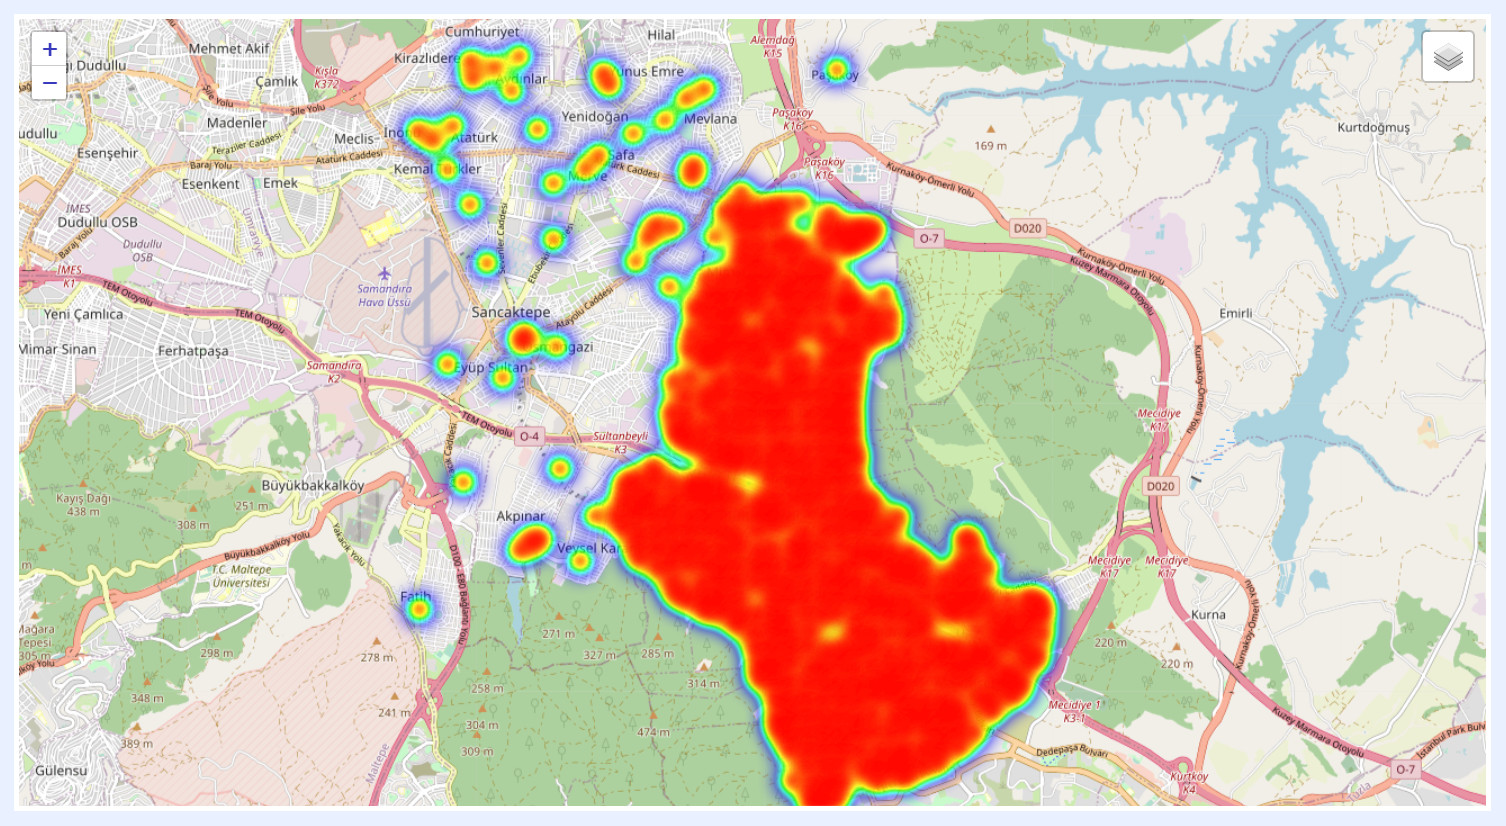
2. Heat Map:
In a Heat Map, areas with high data density are represented by warmer colors, such as red or orange, while areas with low data density are represented by cooler colors, such as blue or green.
Heat Maps are particularly useful for displaying datasets that have a large number of data points distributed over a geographic area. By using color to represent data density, a Heat Map can provide a quick visual summary of where the data is concentrated and where it is more sparse.