Help Topics & Resources
Advices for High Performance
Disabling Unnecessary Filters
Turn off the filter feature for nodes that will not be used as filters when creating a view.
By default, all nodes, except the primary key, are set as filters. Disabling the filter feature for nodes with a particularly high cardinality (nodes in a dataset that have a large number of distinct values relative to the total number of records in the dataset) allows the view to be created with the cache times of the filters reduced.
Using Restrictions Instead of Filters
Restricting the view instead of always applying filters allows queries to return faster.
It also helps you to reduce repetitive actions, especially when you are trying to eliminate dirty data, such as always starting time from a certain date, not showing minus values, and so on.
Applying Horizontal Leveling For Multiple Pivots
Use horizontal leveling on dashboards and showcases with multiple pivots.
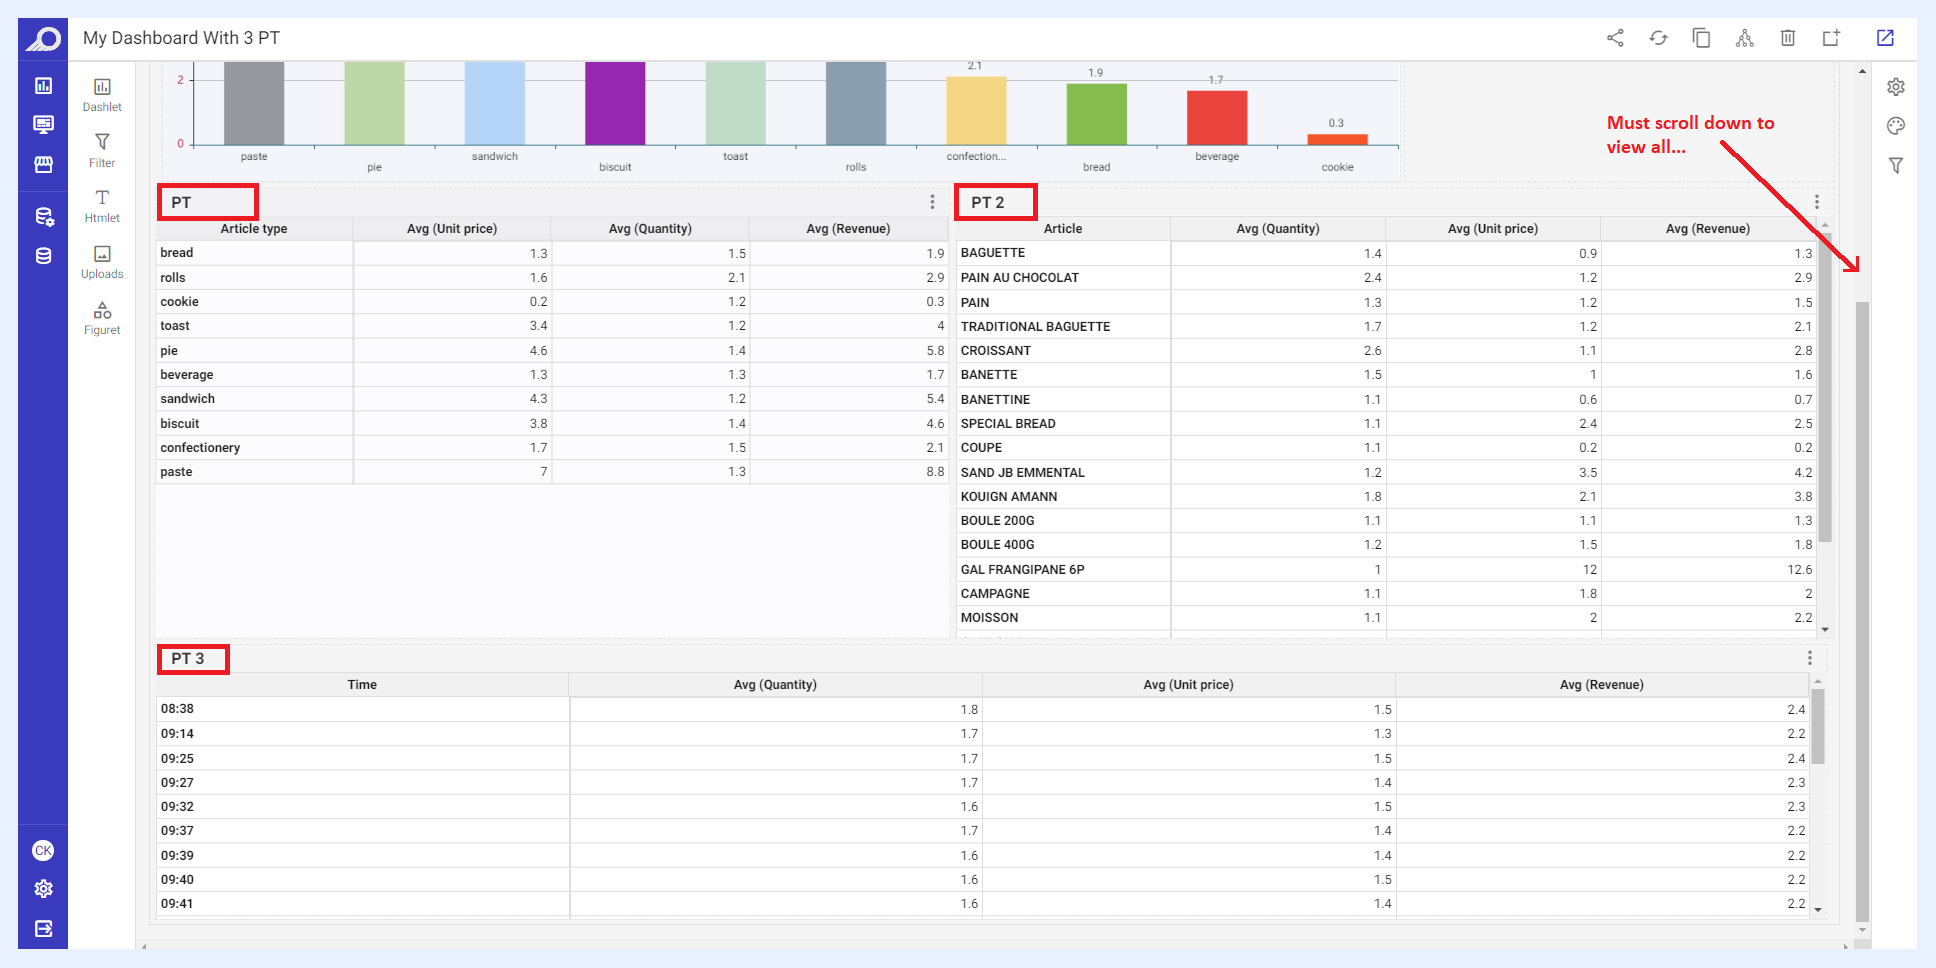
A Sample Dashboard with Multiple Pivot Tables before Applying Horizontal Leveling
For visualizations with multiple pivot tables, placing the pivot table on the tabs with horizontal leveling will significantly reduce the loading time of the visualization.
Additionally, horizontal leveling for multiple pivots has an additional benefit of allowing the dashboard to fit within the screen without requiring the user to scroll.
Placing several pivot tables in one view can make it harder for users to process and analyze the information. When there are too many pivots in one view, the visual clutter can overwhelm the user, causing cognitive overload and making it difficult to find the information they need. It can also make the dashboard slower to load and navigate, which can further increase the cognitive load and reduce the user's ability to make sense of the data.
By applying horizontal leveling and tabbed structure for multiple pivots, users can view the data faster and in a way that is easier to process and understand, without overwhelming them with too much information at once.
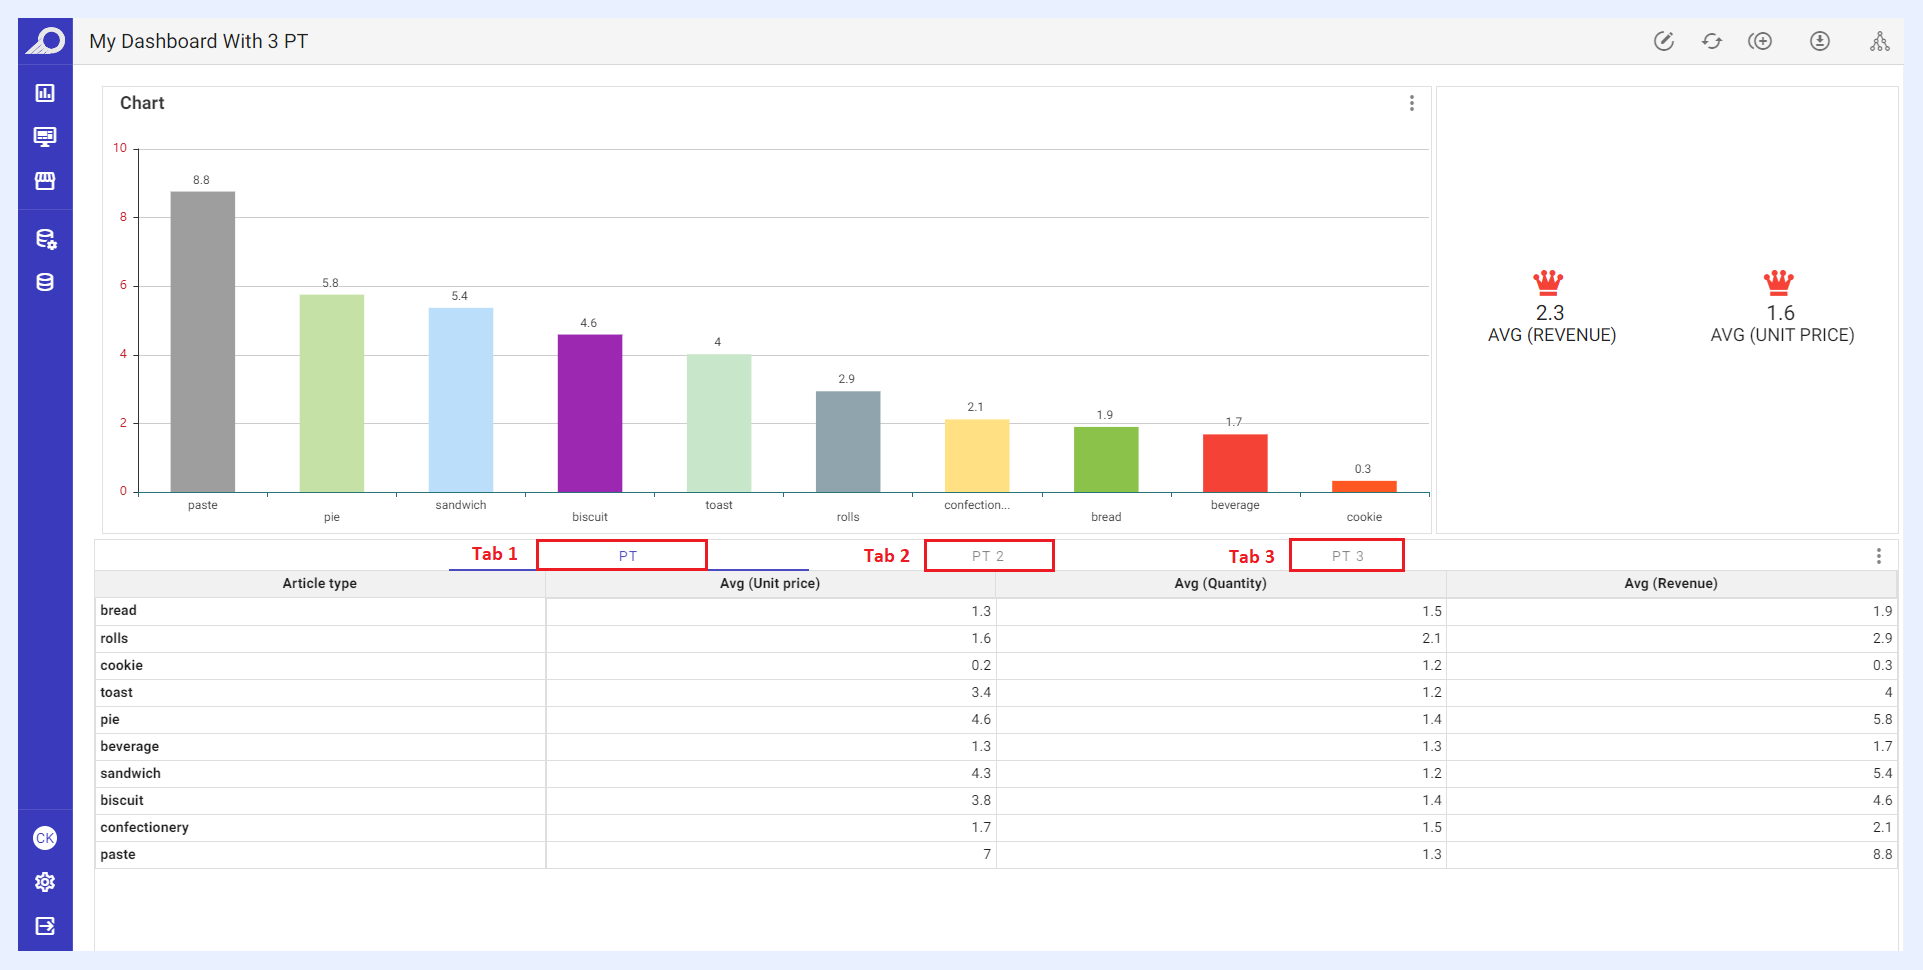
Horizontal Leveling Applied on a Sample Dashboard with Multiple Pivot Tables
You can apply visual differences with CSS in their visual names to make the tab titles more obvious in the pivot tables that you place in the tabbed structure.
Using Calculated Measures Instead of Expressions
Use pandas functions in the calculated measure and make advanced calculations.
While expressions send a query to the related data source, calculated measures act on the result printed on the screen as a result of the query. The performance of the calculated measure is much higher because it does not query the database, but only acts on the fetched result.
Assigning Cache Triggers Whenever Possible
Choose a cache trigger field for every possible table as it will benefit performance.
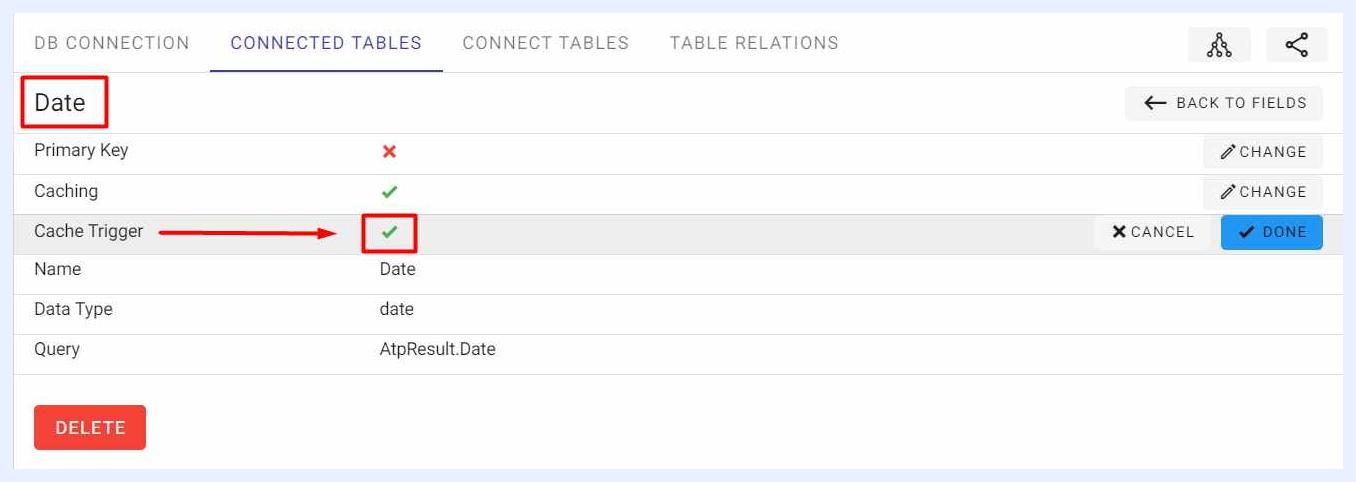
When you assign a trigger field (for fields of data type “DateTime” only), the trigger mechanism is triggered only when the showcase is entered. It also refreshes only the viewport table, not the entire system's cache, thus fetching the data much faster. In other words, it eliminates database hits for unchanged results, optimizes the use of RAM and disk IO, and fetches faster visualizations for consecutive accesses.
If “Cache” option is activated, the dashlets are cached when first opened, then each time they are opened, the last update time of the trigger field and the last cache time are checked, and the system decides accordingly whether to fetch the result from the database or the cache.
Optimizing Your Database
Database optimization is an important aspect of maintaining high performance for any BI platform that connects to it. To optimize your database and help ensure that TURBOARD is running at peak performance, we recommend the following actions:
Consider adding indexes to columns that are frequently used in queries (dimensions) or where data is searched (filters).
Use partitioning to divide large tables into smaller, more manageable pieces. This helps to improve query performance by reducing the amount of data that needs to be scanned for each query.
Remove unused objects like tables, indexes, or partitions that are no longer needed can help to improve database performance.
Q&A – Designer Questions
This section is designed to provide TURBOARD users with answers to common questions that they may have about our platform.
We understand that using a new product can be challenging, and that you may have questions that you need answered in order to get the most out of your experience. That's why we've compiled this list of frequently asked questions and provided detailed answers to help you quickly find the information you need.
In addition to this section, you can also refer to our website's FAQ section for general information about the features and services we offer.
We also want to note that while we've included answers to many frequently asked questions in this section, there may still be questions you have that are not addressed here. If that's the case, please refer to the related documentation section in our user guide, where we provide thorough explanations to ensure that all of your questions are answered.
We encourage you to explore all of the resources available to you to maximize your experience with TURBOARD.
Sharing Visualizations with Other Designer Users
Can we share a report or a dashboard sample with other TURBOARD users and have it designed, built or edited as a team?
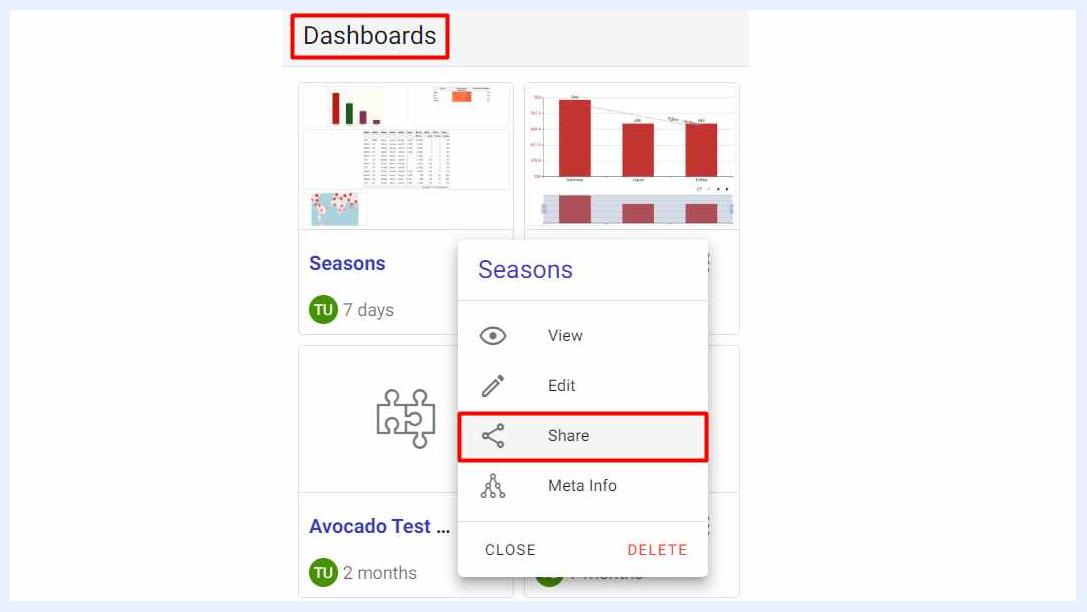
Yes. TURBOARD enables users who have designer (Edit) privileges in a team to design, build, edit and share reports and dashboards and gives them the ability to work efficiently and collaboratively.
Data Quality & Scrubbing Process Options
How can we determine data quality and data scrubbing process?
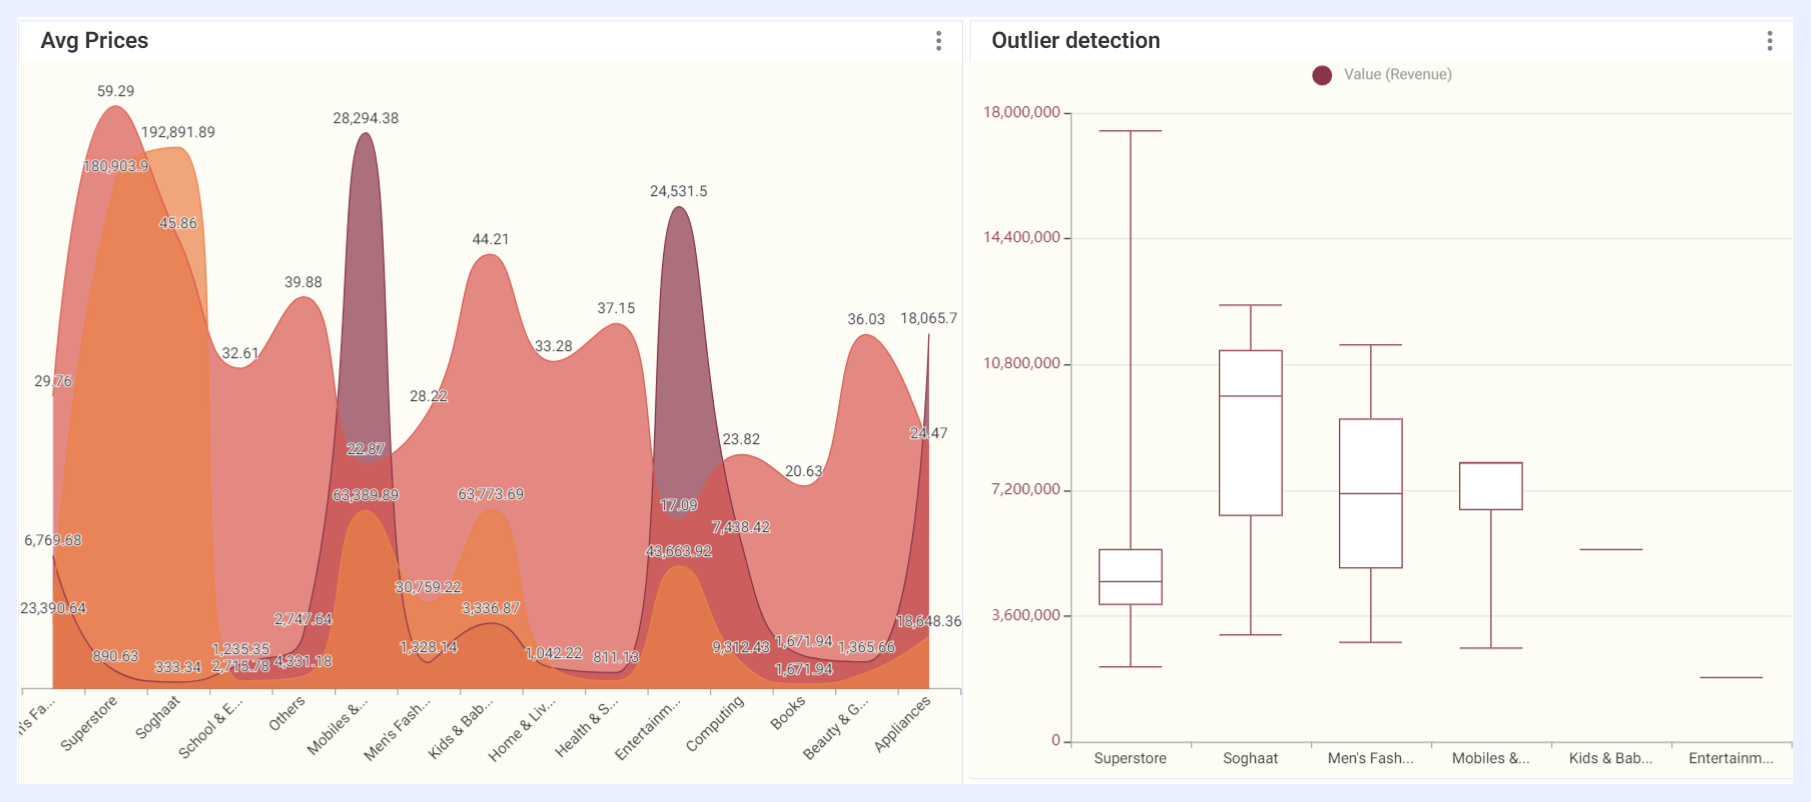
Although TURBOARD is not an MDM (Master Data Management) tool, you can still define heuristics, set alerts to be warned via e-mail, or use box plotting for the outlier detection. See the sample image below.
Assigning a Node as a Measure & a Dimension
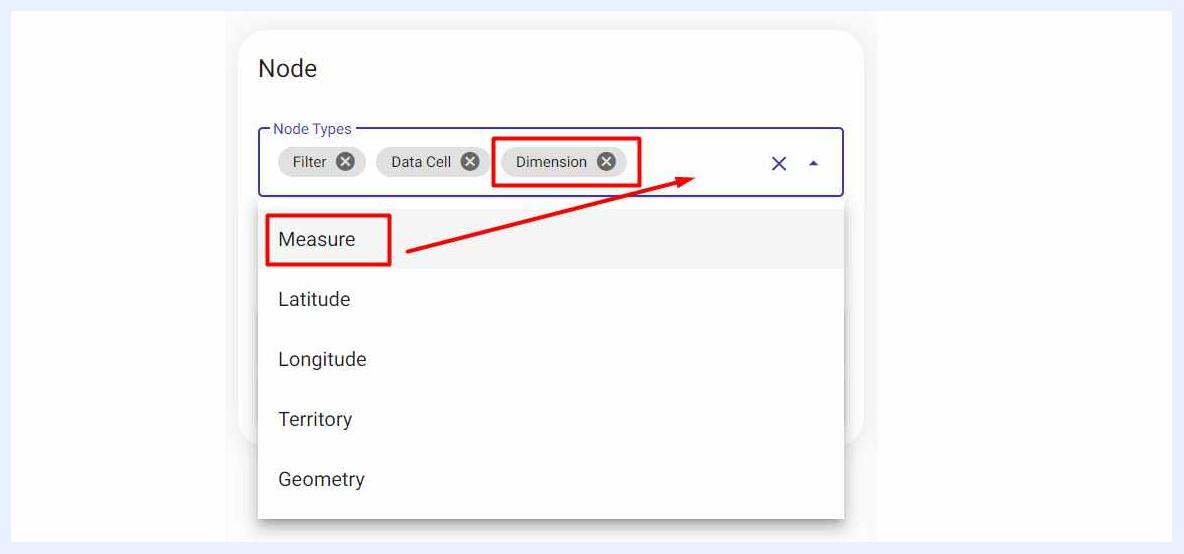
Can a node be assigned both as a measure and a dimension?
Yes, just add it to the “Node Types” combobox. It will be listed as both Dimension and Measure.
Casting Field Data Types
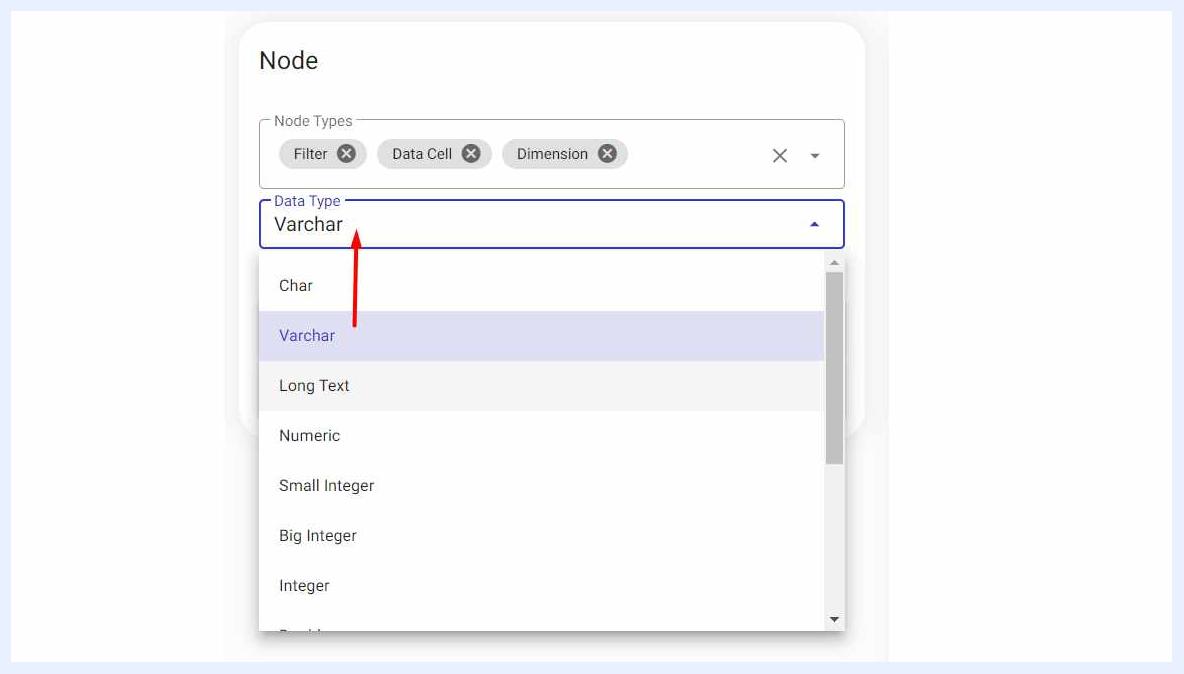
Can the field data type be casted?
Yes, change it from “Data Type” combobox.
Excluding a Dashlet from Dashboard Filters
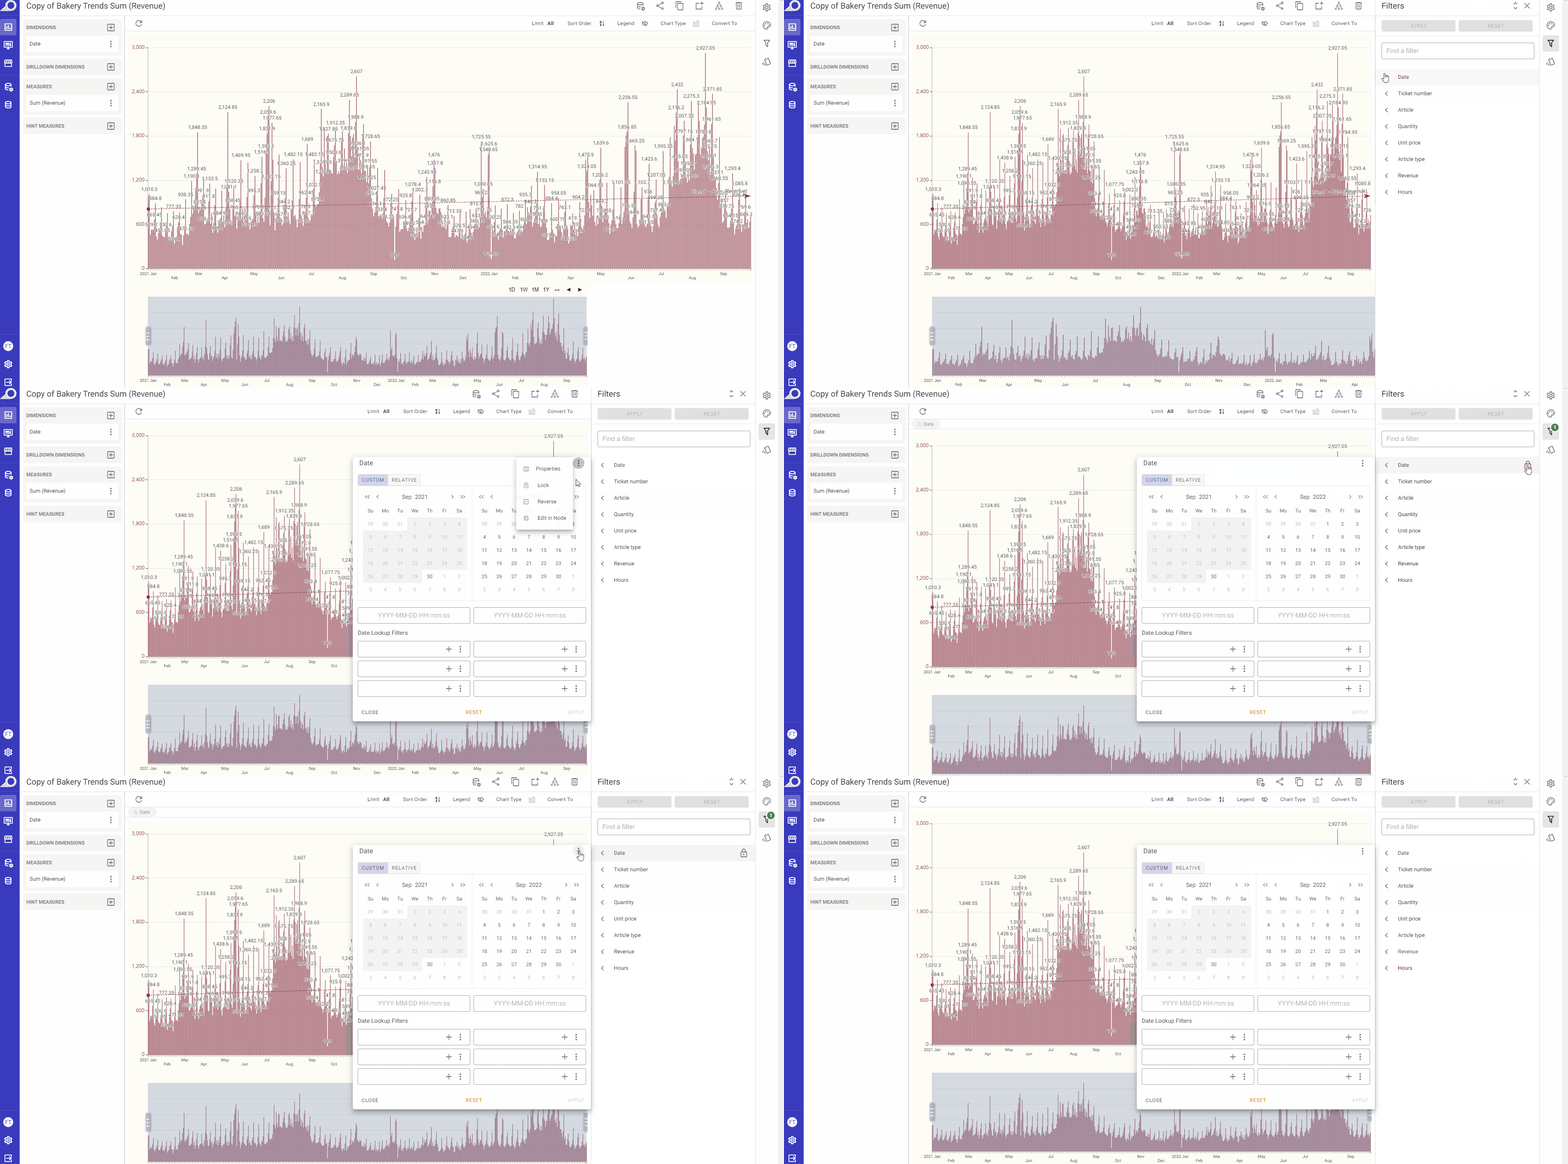
How do I ensure that a dashlet is not affected by the dashboard filters?
To do so, simply go to “Edit“ dashlet option > Click on its “Filters” icon > Choose the filter/s that you do not want to be affected from the slide-out menu > Click on the filter’s right corner ellipsis menu > Click Lock option.
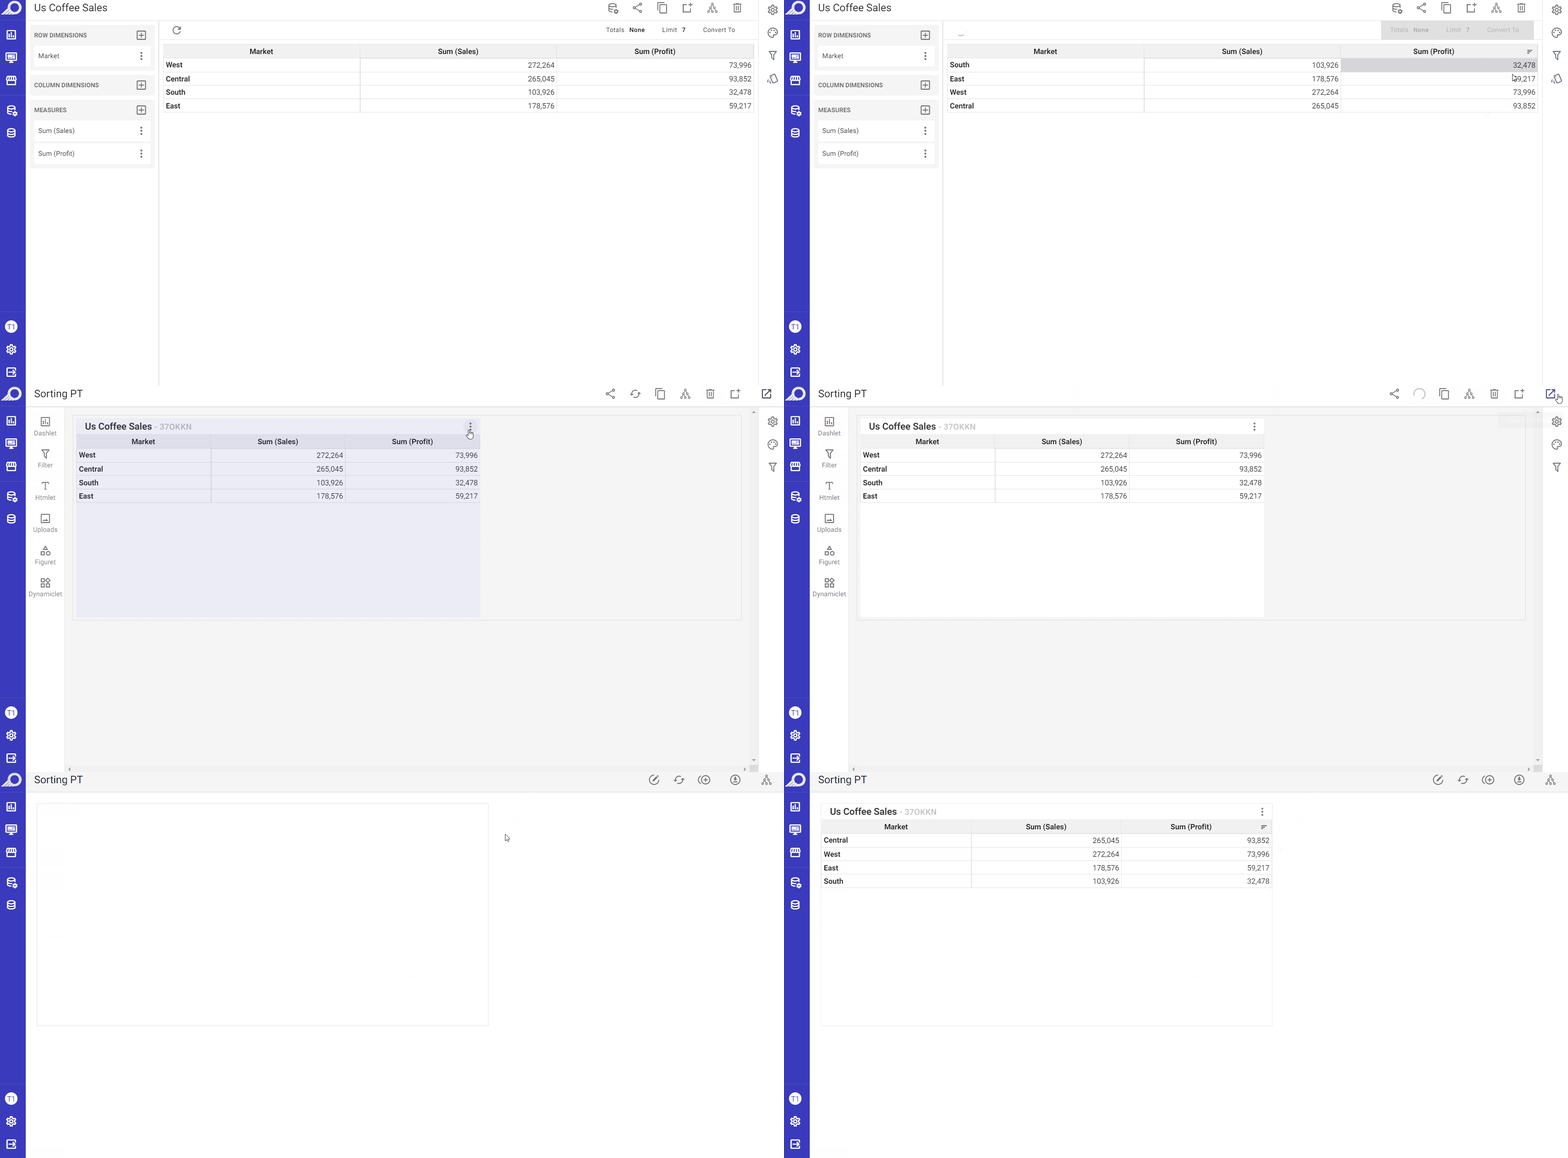
Sorting Pivot Tables in Dashboards
How do I set a pivot table to be sorted in a specific order within the dashboard?
When you set the sorting of your PT dashlet in the required sorting order, it will always appear in the same order that you specified in the related dashboard as well. Simply, go to the dashlet “Edit“ mode and choose the sorting that you desire.
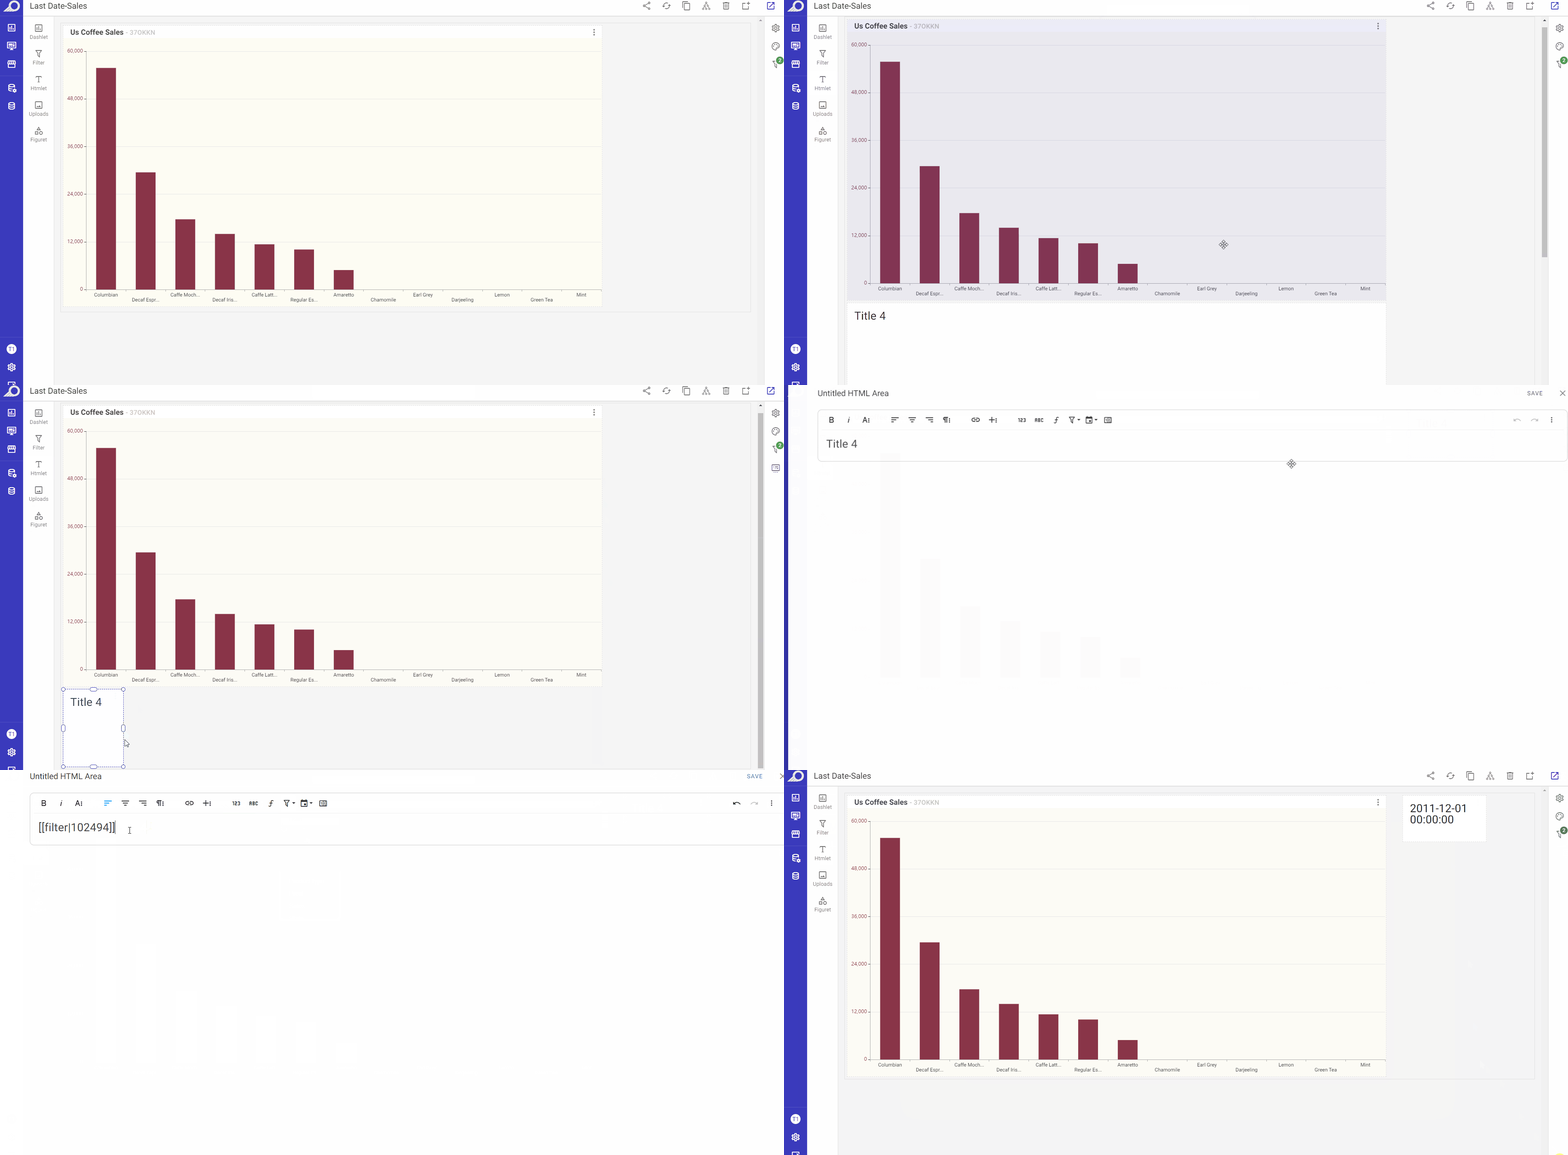
Showing Last Available Date in HTML Field
How do I show the last available date in a dashboard for the date dimension in the HTML field?
In the dashboard “Edit“ mode, you can display the maximum date using the “Max“ function and the ID information of the node in the HTML field. See the GIF below.
Uncontrolled Query Cases
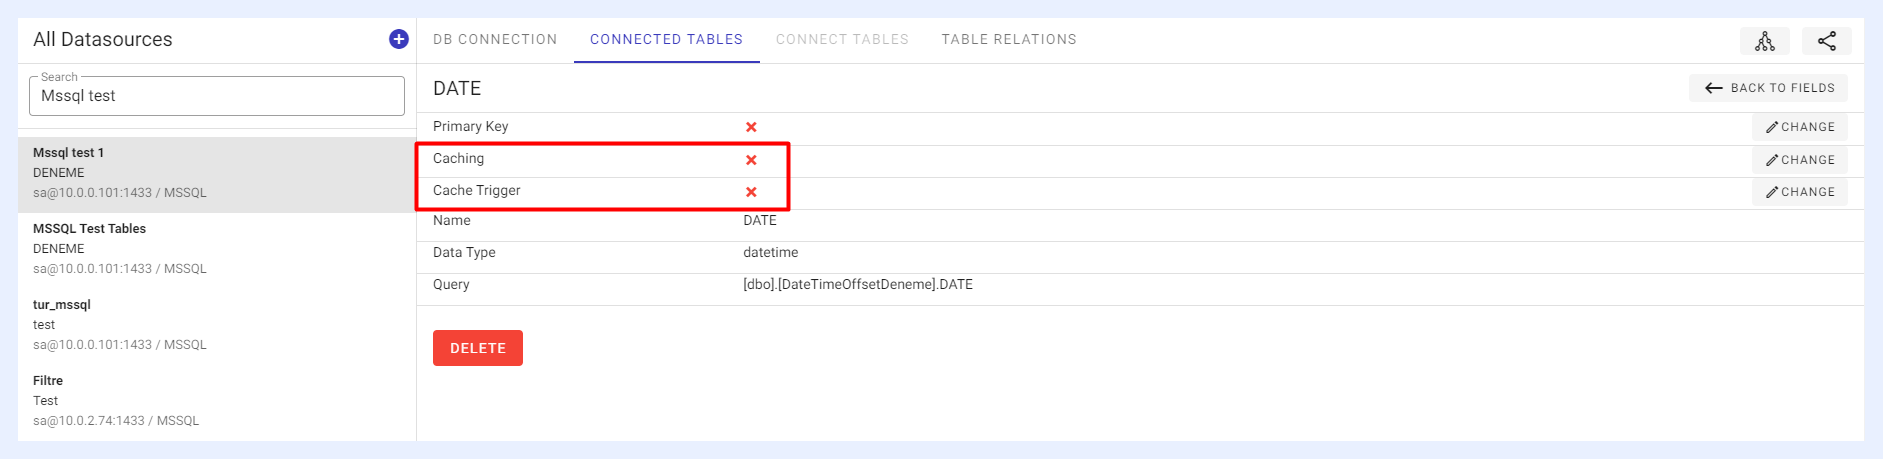
In which cases an uncontrolled query is sent to TURBOARD?
If the caching trigger is not turned on and caching is not enabled/activated for the data tables and its fields, it will send a query every time it is entered. See the image below.
Meaning of Codes Displayed on Dashlets
What is the meaning of the codes on the dashlets and what are they for?
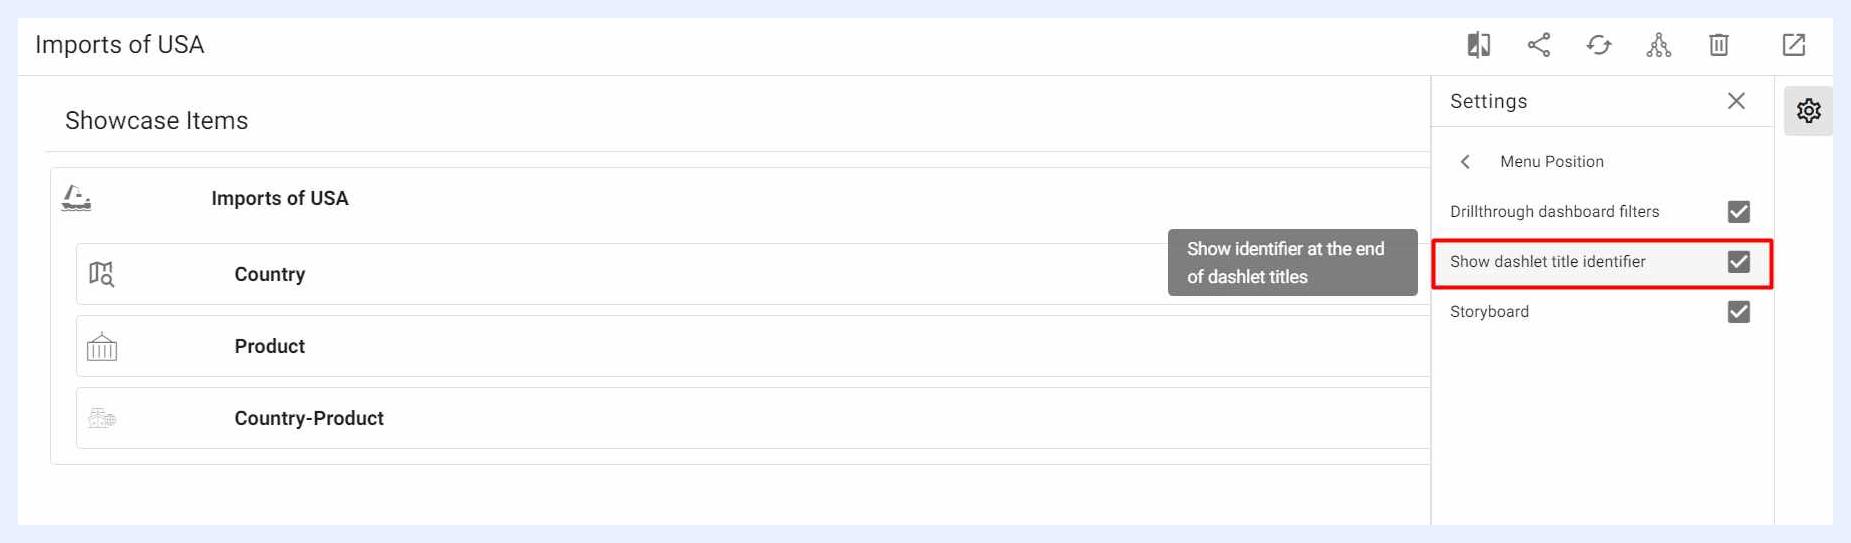
There are 2 codes that can be displayed beside each dashlet title.
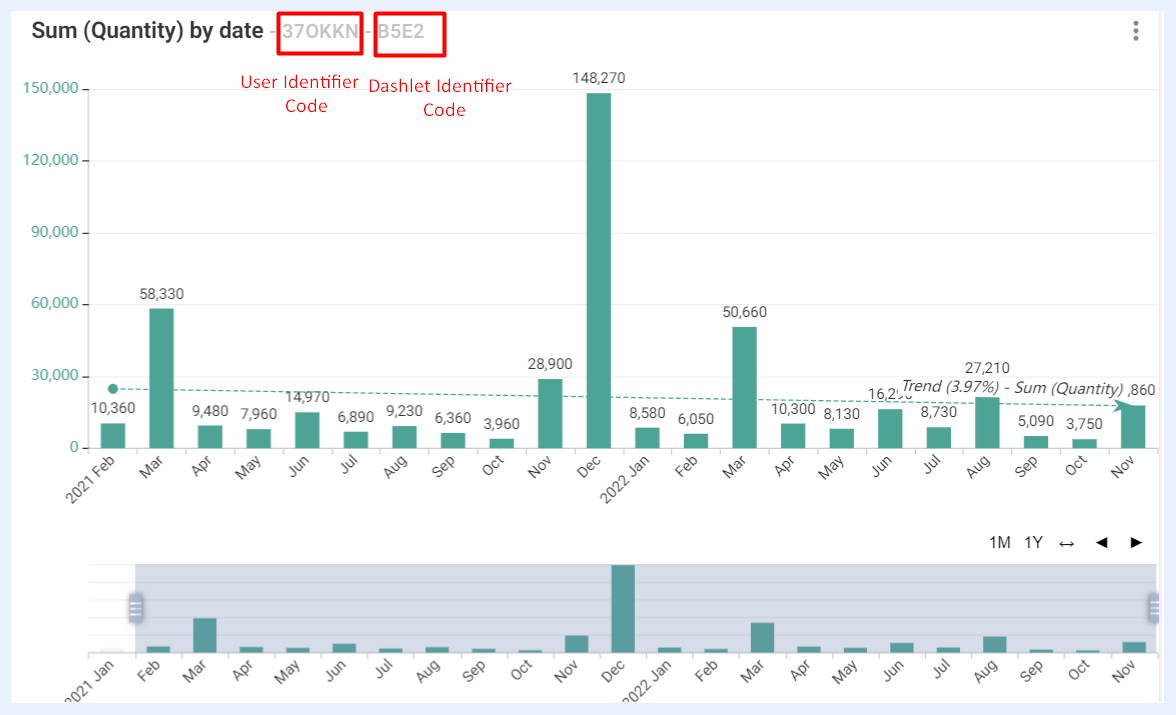
The first one is auto-generated specifically for each dashlet. They are unique identifiers for the dashlets and they help tracking applied actions and activities. They appear in showcases only and can be set to be displayed or hidden on the showcase from the selected showcase “Edit” window as in the image below.
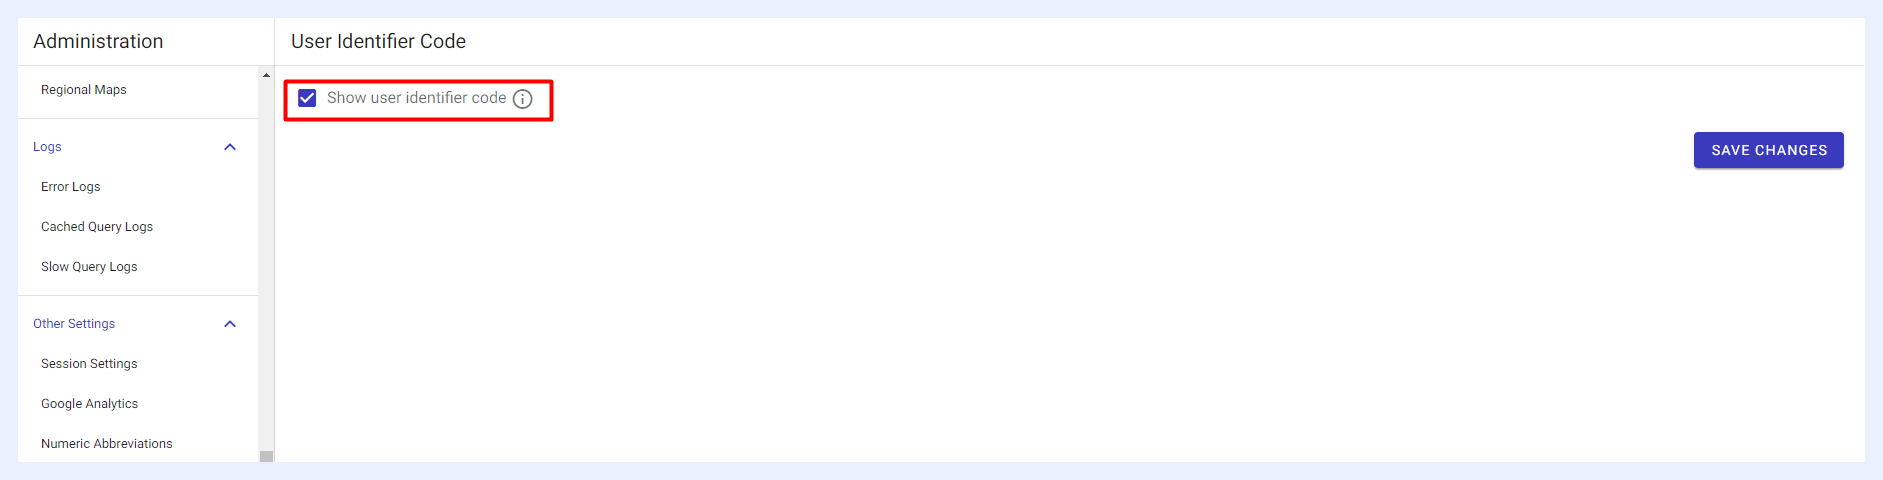
The second code is a unique identifier for the user who is viewing the dashboard and/or showcase. It helps tracking user activities. For example, if a user takes a screenshot of the relevant dashlet and sends it to another place, it can be found out which user sent it from the code on the dashlet.
This option can be set from “Administration” menu > “Other Settings” > “User Identifier Code” section as in the image below. When selected, the user identifier code will appear on all dashboards and showcases.
Normal Mode vs. Aggressive Mode Caching
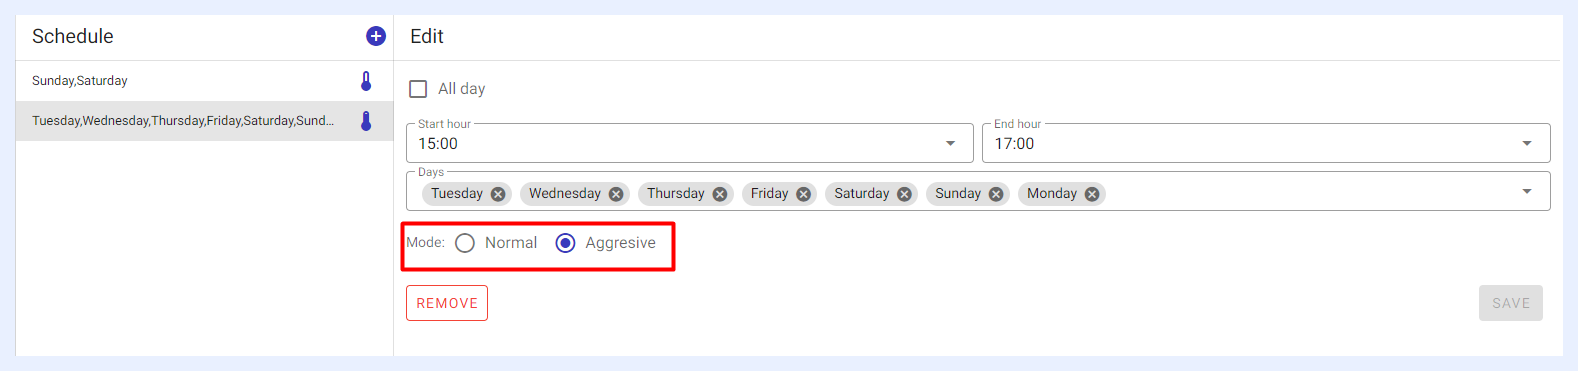
What is the difference between Normal Mode caching and Aggressive Mode caching?
In “Aggressive” mode caching, the system will run 5 queries concurrently, while in “Normal” mode, it will run queries one after another. If the aggressive mode overlaps the normal one, the system will enable the aggressive mode.
Q&A – Troubleshooting
Troubleshooting Errors
What shall I do if I get an error in a showcase, a filter or a dashlet that I have previously created and was in working condition?
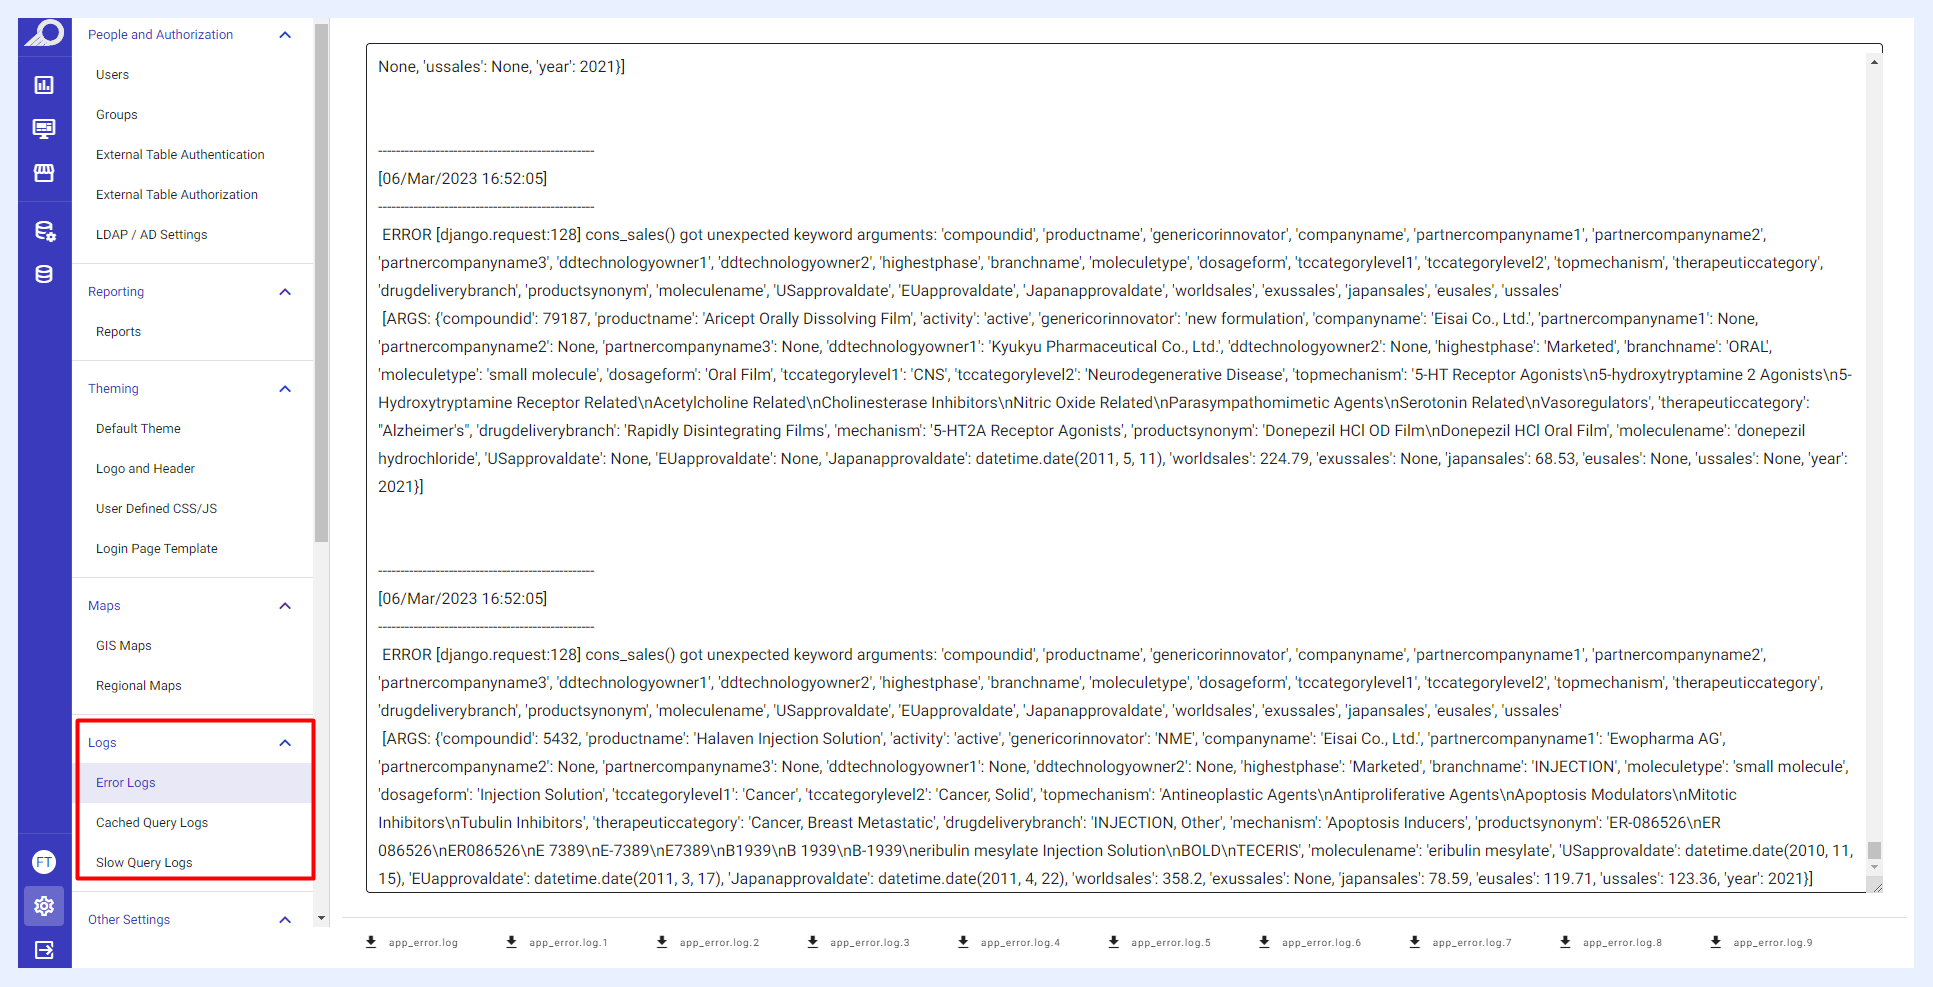
The first place you need to check is the logs which are accessible by navigating to the “Administration” option > “Logs” section. You should proceed by examining the logs and finding where the error is.
Fixing Merged Filters
The merged filters do not work or appear faulty on my dashboard, how can I solve this?
First, check if the merged filters are all cached and if the corresponding field at the source database has data. If the filters are not cached, you may cache them in the relevant data view(s) by checking the “Enable caching” check box.
Refresh the filter caches in the data views of the merged filters, then refresh the cache in the relevant dashboard/showcase.
Check the fields and make sure that the relevant ones are not deleted in the tables containing the nodes of the combined filters.
If you are unable to resolve the issue with these steps above, contact our support team at support@turboard.com.
Refresh & Update Issues
The changes that I made in my dashlets are not reflected in the showcase, what shall I do?
Check if a cache trigger is activated for the relevant data source. If there is no cache trigger in the data source:
Refresh the cache in the relevant dashlet. Refresh the cache in the showcase as below.
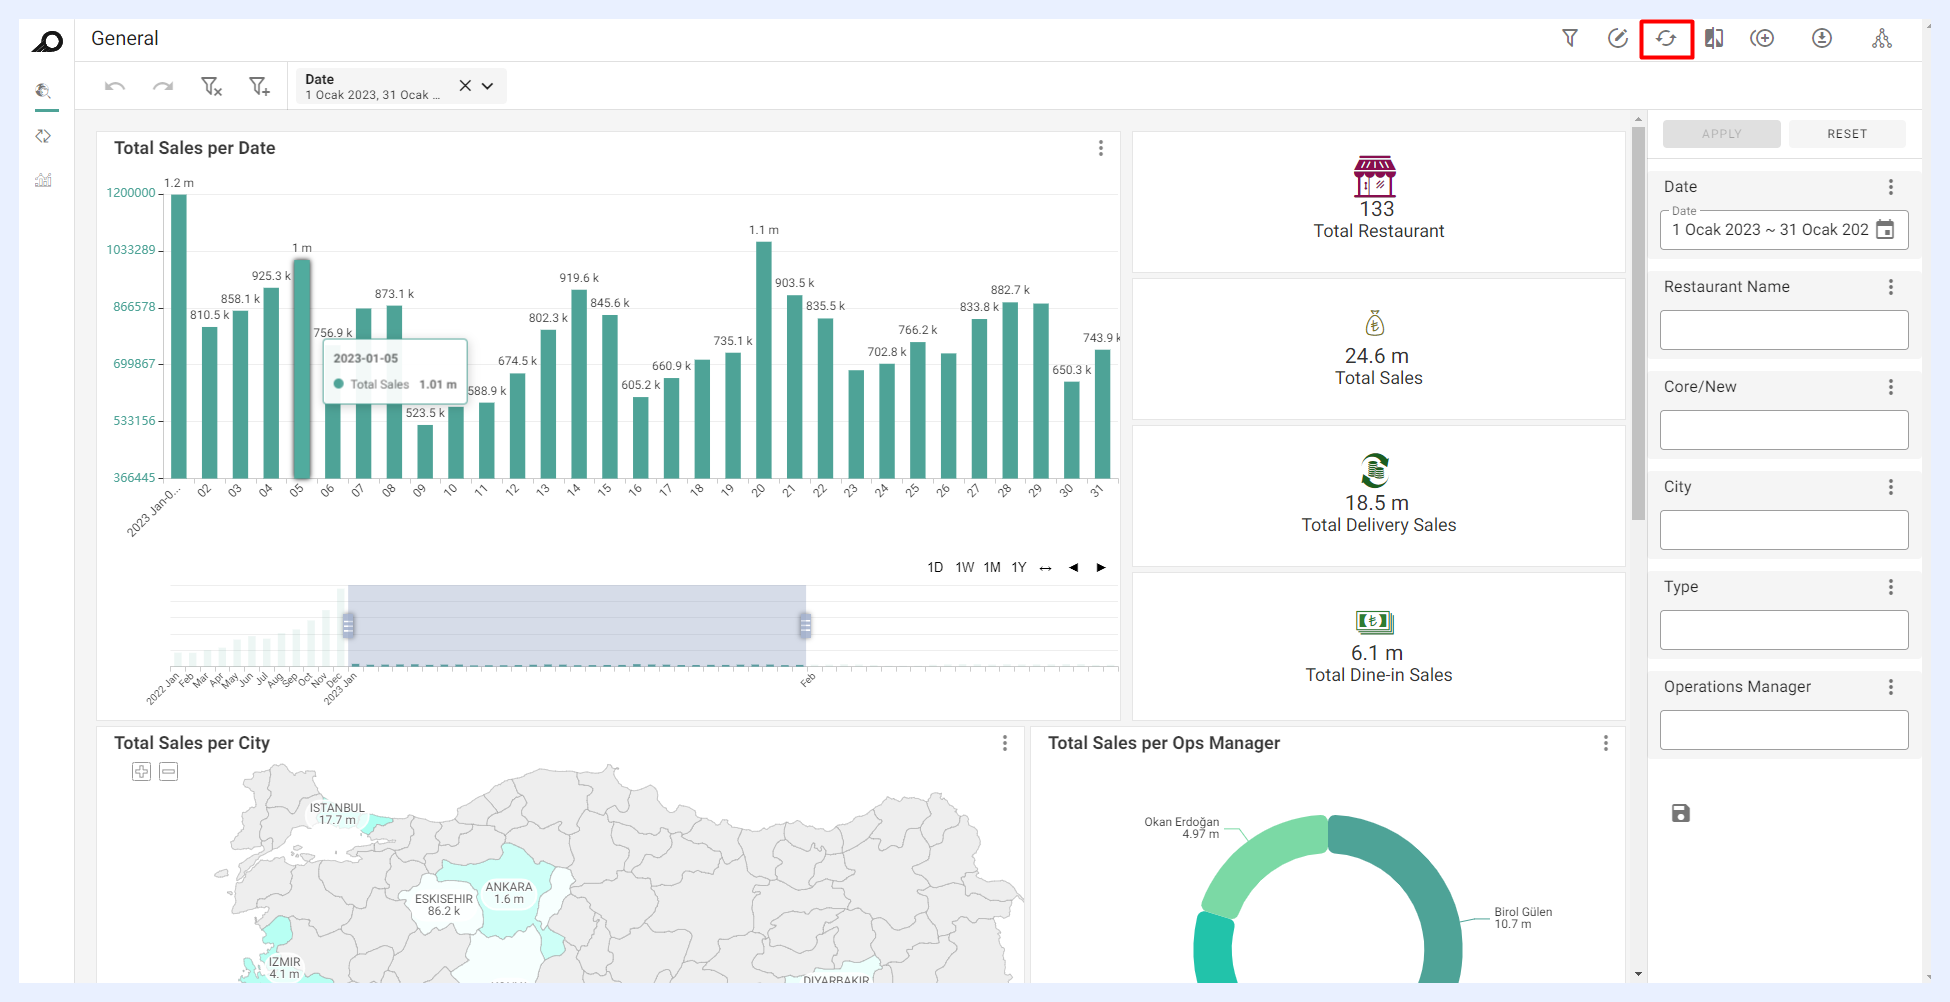
If the changes are still not reflected in the window display, try again by clearing the cache in the browser that you are using (e.g. Google Chrome).
Column Filtering in PTs
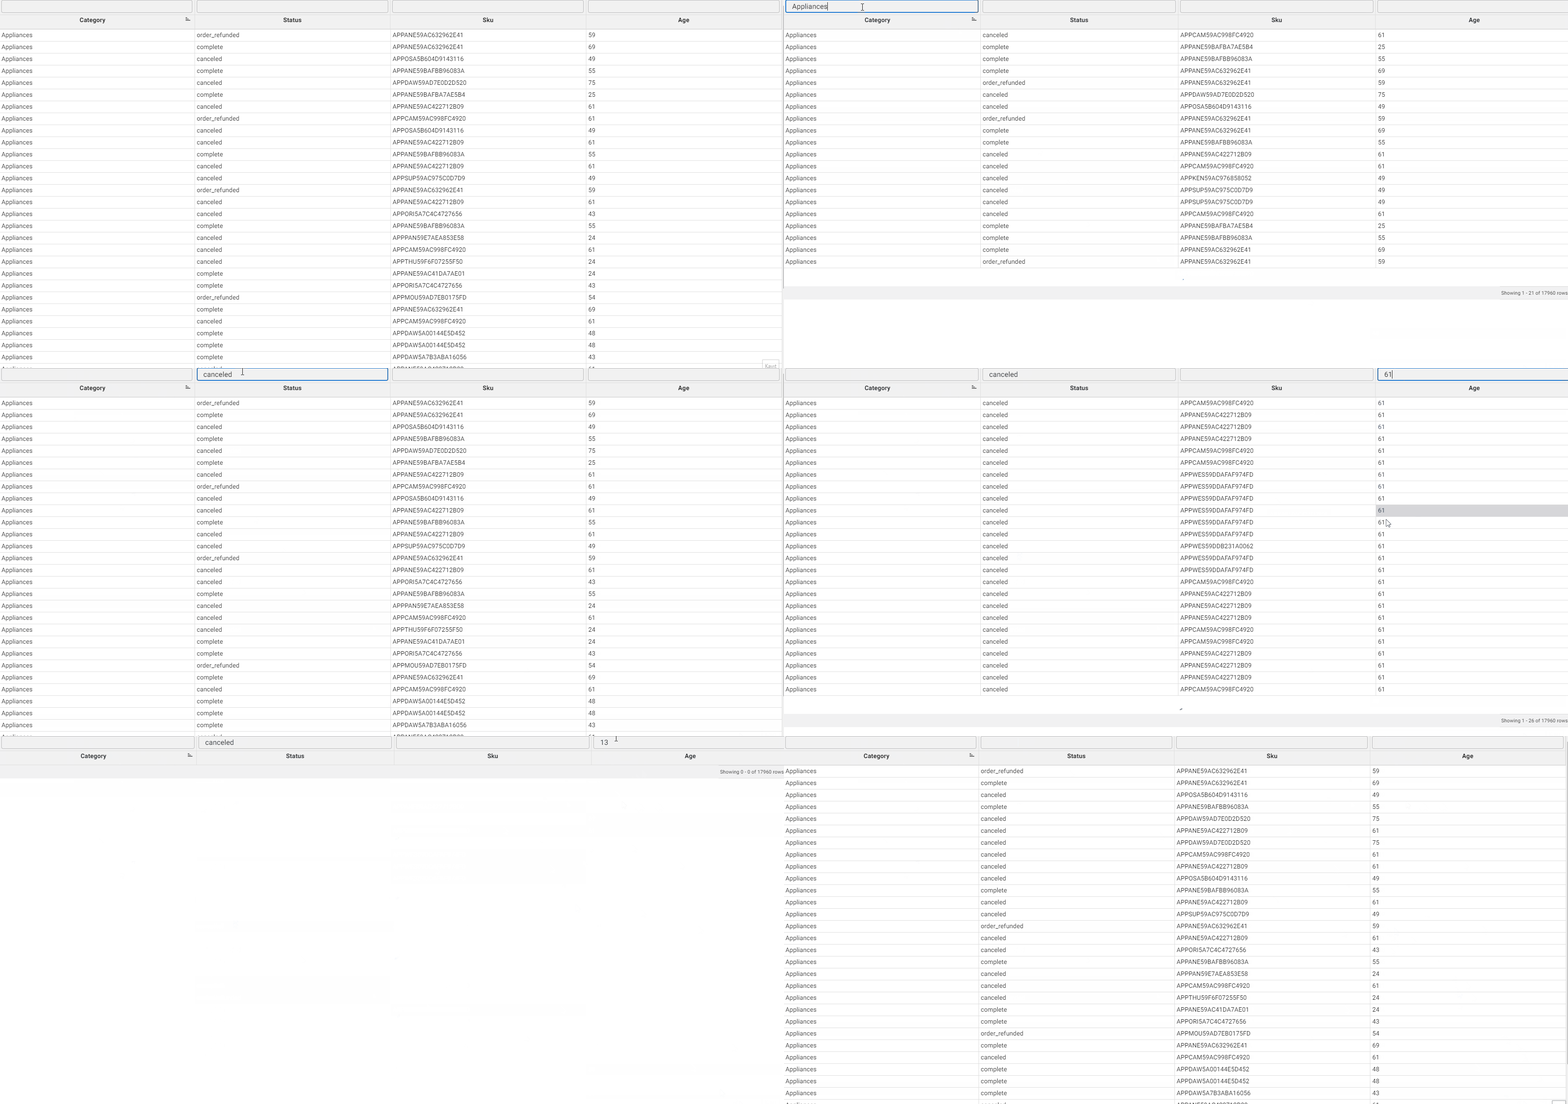
When I use column filtering in a datacell based pivot table, the filtering results sometimes do not appear and I get a “No Data to Display” message on my screen. Why is that?
Column filtering generally filters rows according to both partial and complete entry of the data cell values in the related column filters. However, for partial entry, it only works and fetches results for data cells of type “VARCHAR”. While for data cells of type “INTEGER”, you have to fill the complete value inside the filter field. Otherwise, it will not filter any rows and will give you a “No Data to Display” message. See how it works below.
Troubleshooting Slow Performance
TURBOARD seems to be working slow. My dashboards and showcases take a long time to fetch data from my DB. What shall I do?
If you are experiencing slow query response times in TURBOARD, it may be helpful to check TURBOARD Logs (Slow Query Log and Cached Query Log) for any problematic queries.
If the problematic row was not found in the logs, you may contact our support team at support@turboard.com to help you identify any problematic queries that may exist in your database.
Once you identify the problematic query or queries that are causing the slowness, it can help you identify the specific database tables or operations that are causing the performance bottleneck and take steps to optimize them.
To avoid slow query response times when creating or configuring dashboards in TURBOARD, it is important to take some precautions as below:
Interactive filters should be used with care. Adding all filters by default can create interactivity between filters that are not related to each other. To prevent this, filters should only interact with the respective filters they are related to.
To avoid creating a waiting situation and slow loading of dashlets, it is recommended to use only one measure in each Info Cell. When multiple measures are used, synchronous querying is performed, which can cause the dashlet to load late. Hence, for databases that are not optimized for high-frequency querying, it is better to have Info Cells with single measures.
Expressions that can be converted to calculated measures should be converted. Using measures as expressions can cause additional database queries and slow down the dashboard's performance. Therefore, keep only those expressions that cannot be converted to calculated measures. Calculated measures work on query results, so it is recommended to use them as much as possible to improve dashboards’ performance.