Maps
GIS Maps
A GIS (Geographic Information System) map is a digital map that uses layers of data to represent geographic information. It can include information such as roads, buildings, land use, and demographics, and can be used in an interactive way for analysis, and decision making. It is a toolset for visualizing and analyzing geo-spatial data by showing data points in exact locations using visualizations that are most suited to a map.
To visualize data using GIS in TURBOARD, an add-on module called (GIS-S) is required. This means that only TURBOARD clients who have purchased the GIS-S module will be able to use the “Geographical” dashlet types to create and analyze their data. Additionally, the GIS Maps configuration window here will only be visible to those clients who have purchased the module.
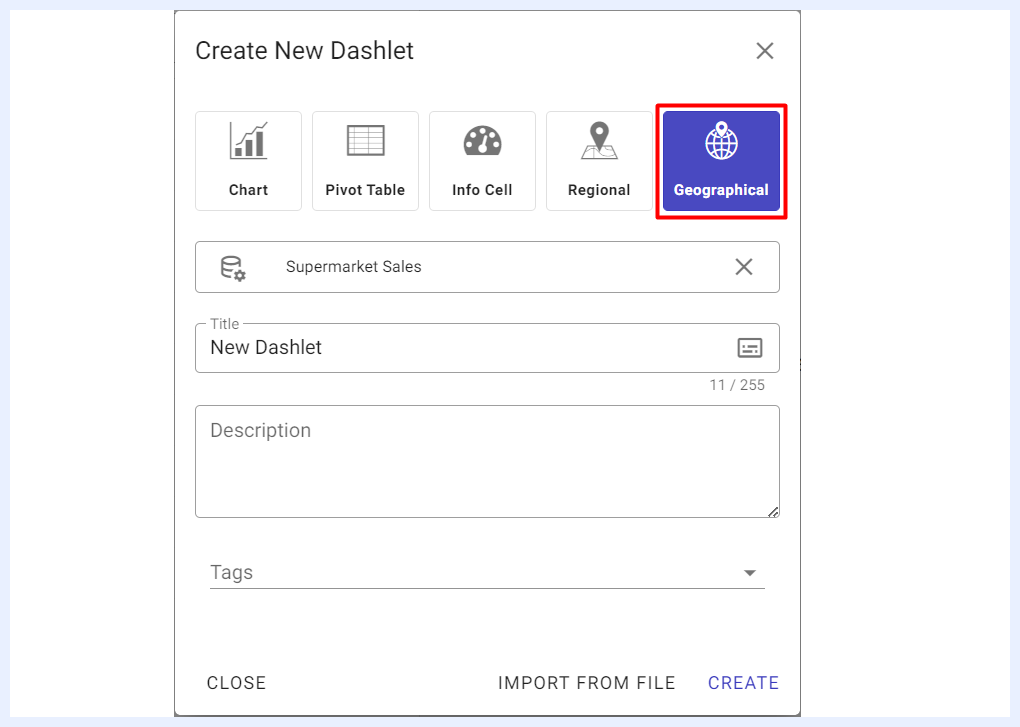
Geographical dahlets are only shown to TURBOARD workspace with GIS-S add-on module
Under this section, the Admin user can add/edit the basemaps that will be used by designer users to overlay the data points when working with Geographical dashlets. The admin user may choose to embed a map which is the product of a GIS map server such as QGIS or ArcGIS, in formats such as WMS/WMTS/PNG.
Note
TURBOARD GIS-S module has a default GIS map configured in the system (OSM) from the OSM server for the world map. This means that the Admin user does not need to configure any GIS map unless additional maps are needed for adding multiple GIS maps as overlays on top of each other to allow further analysis. For example, you can overlay a map of population density on top of a map of land use to analyze how population density relates to land use patterns.
Configuring GIS Maps in TURBOARD
How to add/edit a GIS map to your TURBOARD platform?
1 Go to Administration > Maps > GIS Maps.
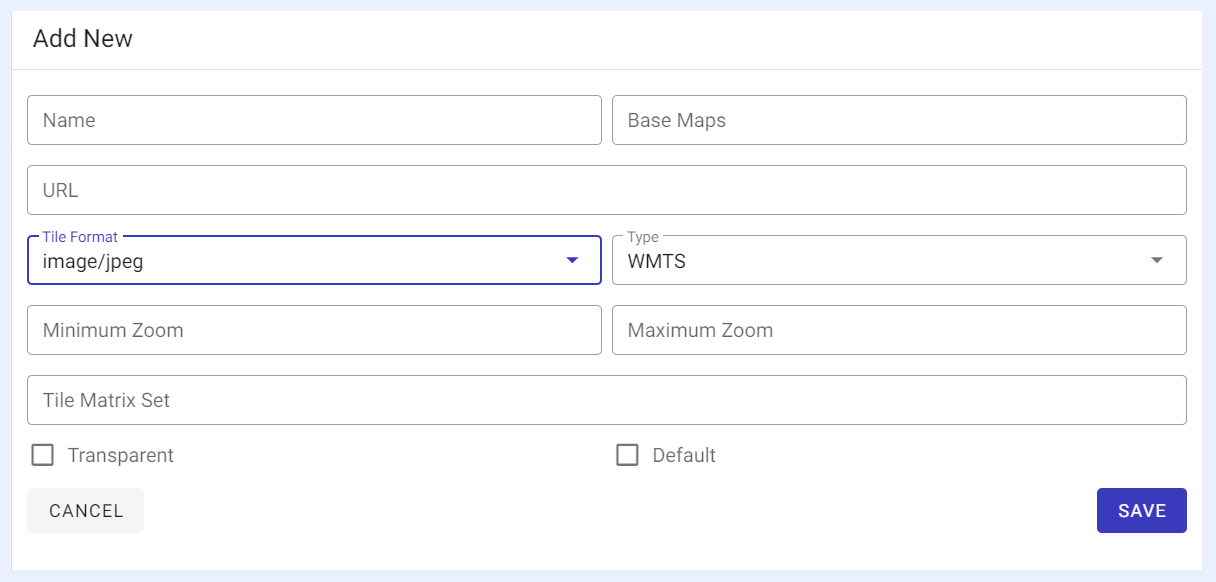
2 Click + Add a new GIS map button to “Add” a new GIS map, or select the required map from Maps list and click on it to “Edit” its properties in the window that opens on the right:
-
“Name” field: give a title to your map.
-
“Base Maps” field: this field is only activated for maps of type “MTS” and “WMTS” as they can be used to serve other basemaps.
-
“URL” field: determine the URL template for accessing map from its map server.
-
“Tile Format” field: select the tile format of the map from the drop-down list.
-
“Type” field: select the map type from the drop-down list.
-
Zooming fields: determine min. and max. zooming for the allowed zoom-in and zoom-out options for the map. Optional fields in which if left empty, the default zooming of the map will apply.
-
“Tile Matrix Set” field: this field is only activated for maps of type “WMTS” to determine the set of zoom levels and corresponding tile resolutions for the added map by entering the TileMatrix identifier.
-
“Transparent” check box: if checked, the added map will have transparent features which allows multi maps placed as layers on top of each other for further analysis.
3 Click SAVE button.
4 SET AS DEFAULT button: when clicked for the selected GIS map, it will become the default map when creating a Geographical dashlet for all Designer users, and the other added/available GIS maps can be used as additional basemaps/overlays.
Regional Map
In TURBOARD, you can upload any SVG map (also called Regional Maps) in order to create an interactable map dashlets to compare customizable data for each territory in your datasets.
How to add an SVG map to your TURBOARD platform?
1 Go to Administration > Maps > Regional Maps.
2 Click + Add a new regional map button in the window that opens on the right.
3 Give a title to your map in the “Title” field and click ✓ correct symbol icon next to the field.
4 Click Choose a .GeoJson file and submit icon at the right side of the window to upload your SVG map file (GeoJSON map format only).
5 If the file is uploaded properly, your map will appear and you can add synonyms to any selected region(s) by clicking on the region > filling “Synonyms” field > clicking ADD button.
Important
Make sure that your map file format is GeoJSON and its main field name is 'name'. Otherwise, the map will not be uploaded properly.
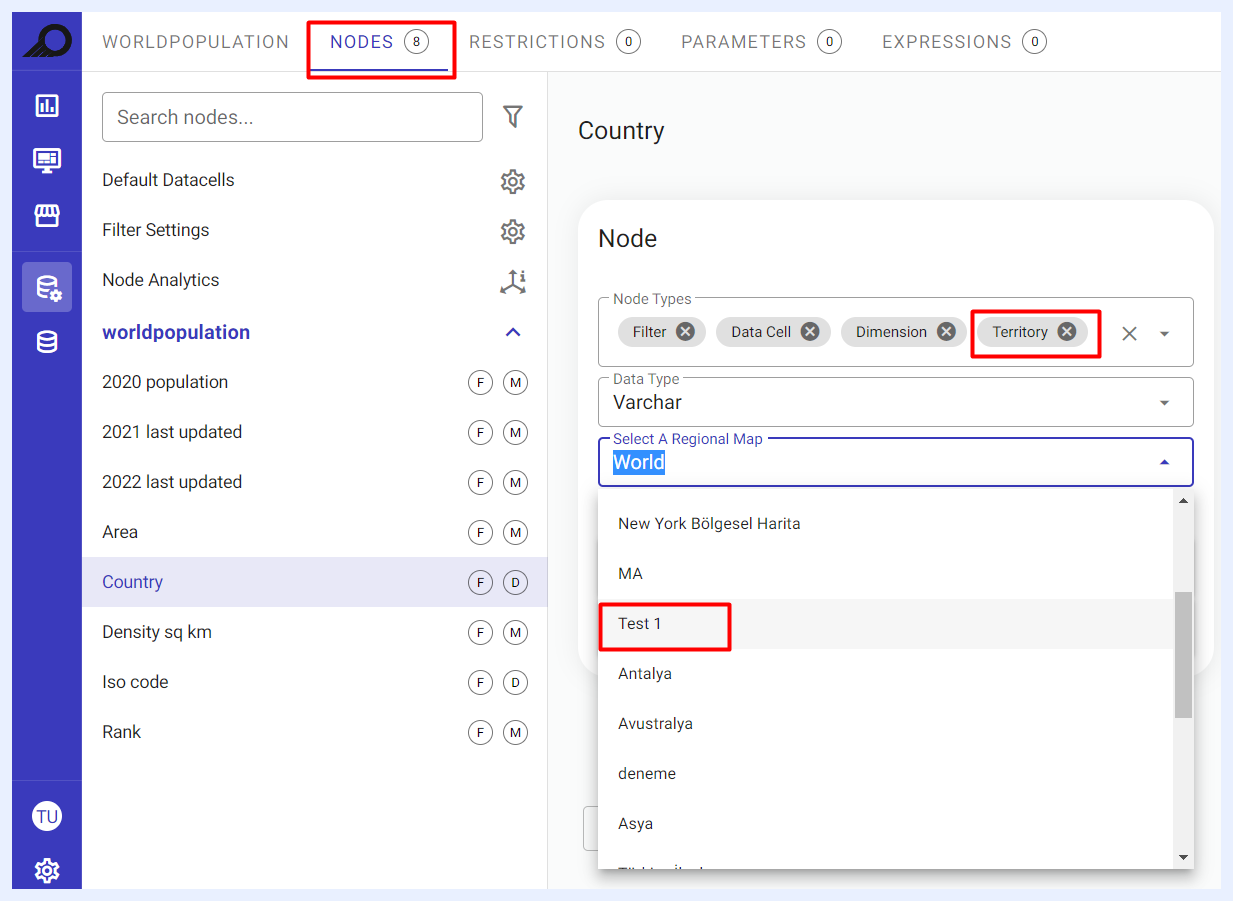
The uploaded map with its given name will be available under “Nodes” Properties of the “Views” for the nodes of type “Territory”, in which you can link it to these nodes.
Use Cases for “Synonyms” Feature in Regional Maps
You can view cities that are grouped together for various reasons. For instance, cities may be grouped together based on their Sales Region, Production Region, or other factors, and this allows you to easily track them as a collective grouping on the map.
It allows you to create customized labels for regions on the map. For example, you can set synonyms for a state or province that include commonly used abbreviations or alternative spellings, which can make the map more user-friendly for your audience.
It can be used to filter and search for regions on the map. This is particularly useful when you have a large number of regions or when you need to search for a specific region quickly.
You can use it to provide localized labels for regions on the map. For example, if you are creating a map for a specific country or region, you can use synonyms to provide the names of regions in the local language, which can make the map more accessible and relevant to your audience.