Dashboards for End-Users
Benefits and Features
TURBOARD dashboards serve as a crucial tool for businesses to efficiently analyze data. As the primary interface for end-users to access, comprehend, and use business data, they expedite the decision-making process.
The end-user dashboard provides various navigation options and quick action function buttons and icons to enable users to:
-
Quickly navigate to the desired data with minimal clicks, promoting ease of use and understanding.
-
Customize the data by using filters and drill-down, selecting and modifying the chart type, or utilizing the cloning feature.
-
Facilitate communication and sharing of data across different departments, mediums, and users, fostering collaboration towards a common objective.
-
Offer real-time insights into the data with the capability to refresh and update it as needed.
How to view a Dashboard in TURBOARD?
1 From the “Navigation Sidebar Menu” > Click on Dashboards.
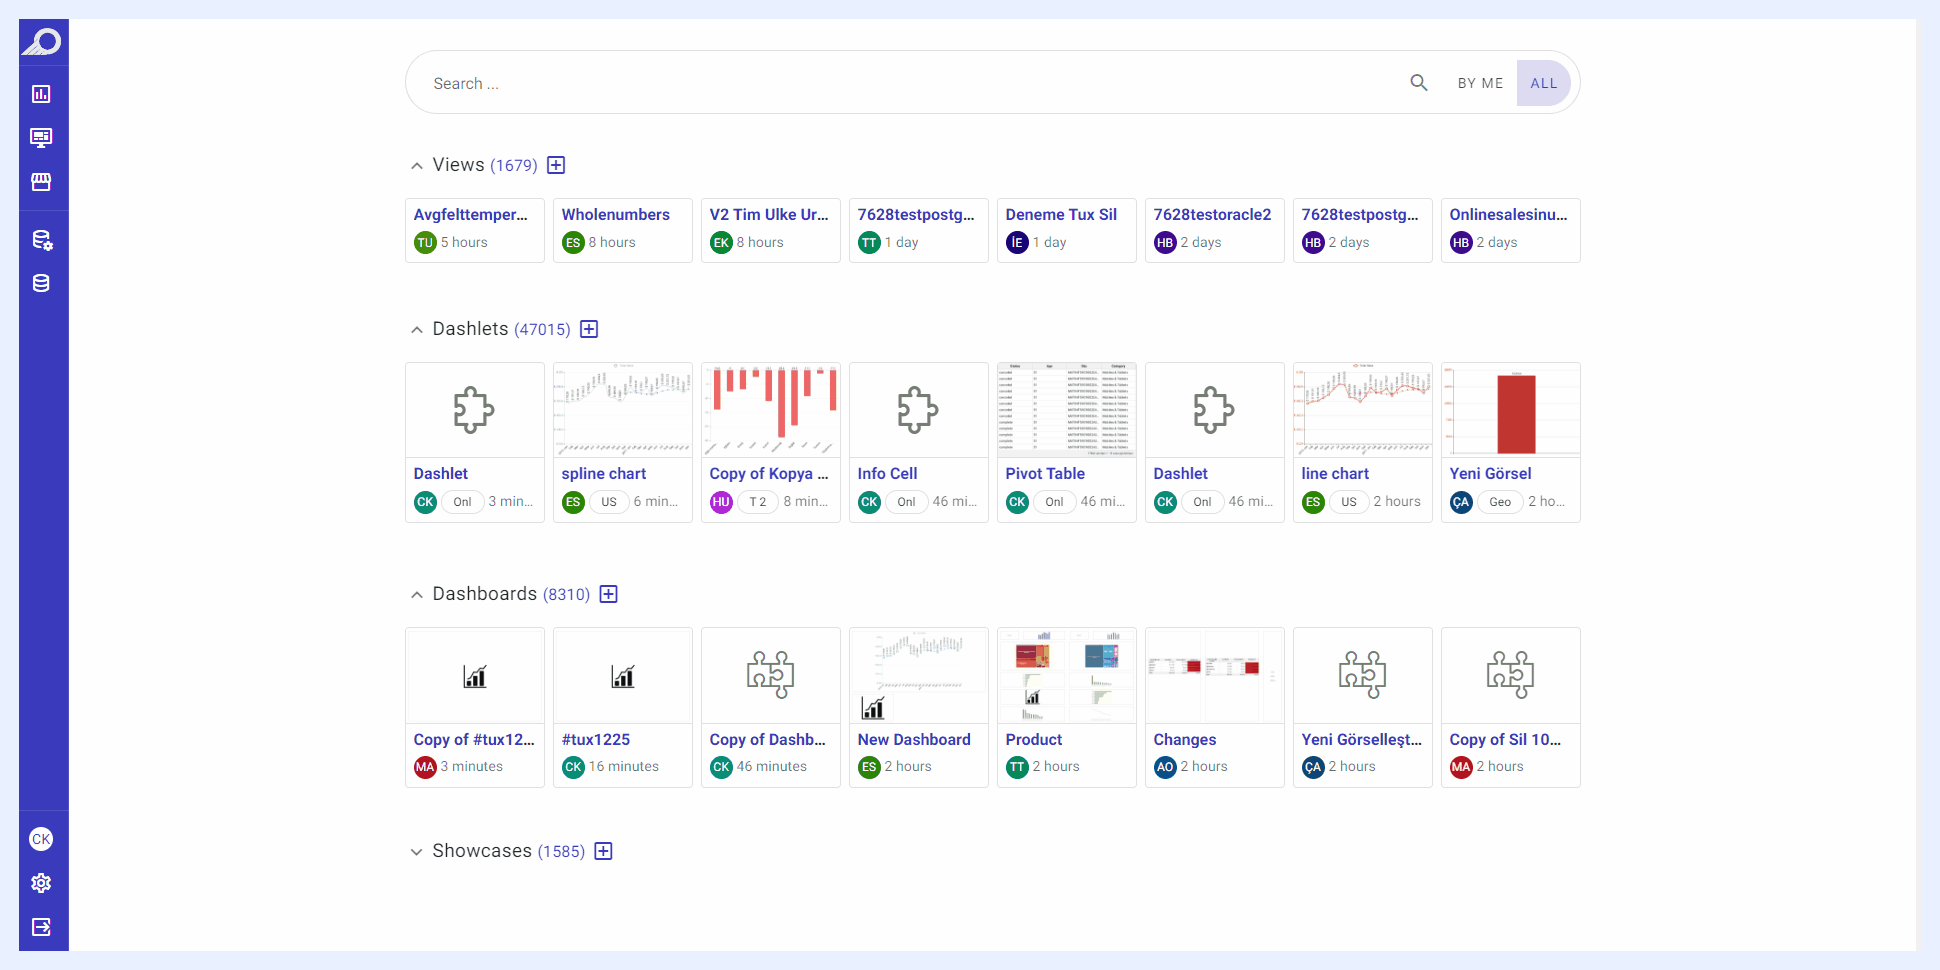
2 The dashboards’ listing window will open where all the shared dashboards with the end-user will be listed in boxes or cards. Click on the required dashboard to open its view mode or click the dashboard’s ellipsis menu and select View option.
3 Alternatively, you can access the dashboards’ listing window from TURBOARD “Start Page”.
Note
Designer users (with “Edit” access) can directly view the dashboard by clicking the View dashboard icon in dashboard “Edit” mode. Additionally, when a designer user clicks on the dashboard from its listing view window, it will open it directly in “Edit” mode instead of “View” mode.
Below are several actions that end-users can utilize on the dashboard to streamline navigation, gain insights, and customize data in accordance with their analysis and business needs.
Dashboard Filters
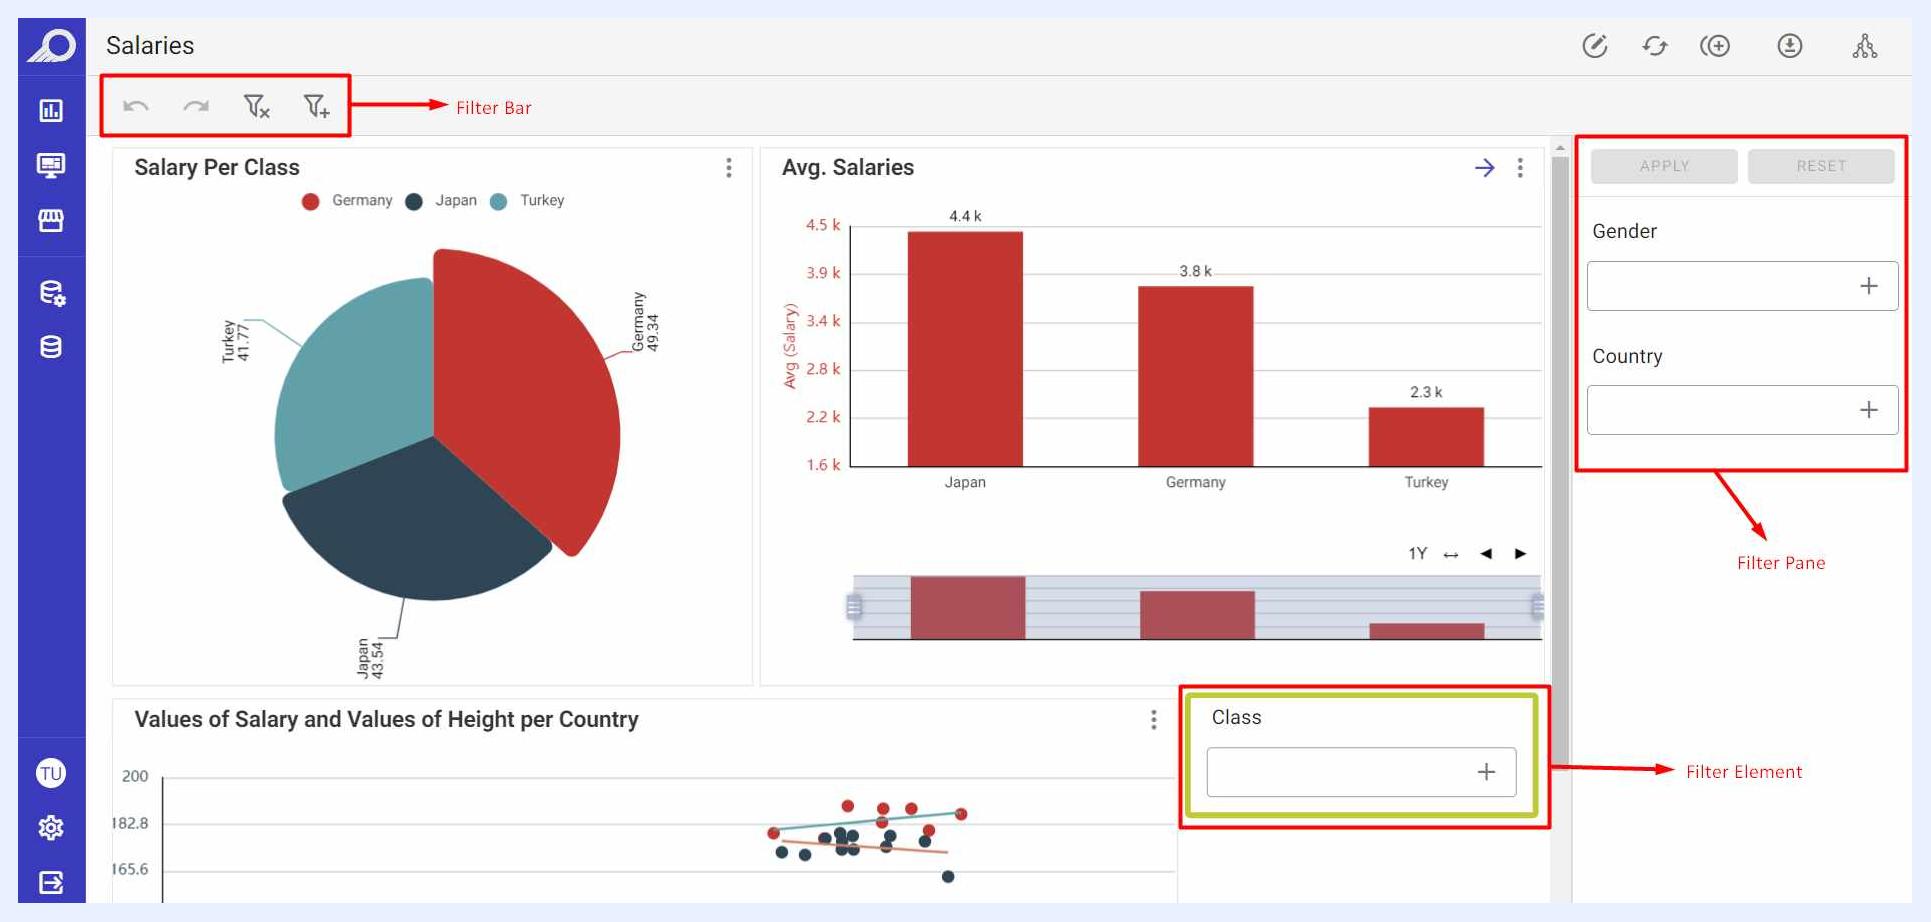
Designer users can customize the filters and how they are displayed to end-users. Those filters may appear to end-users as:
-
Right/Left Side Filter Pane: end-users can select the required filter/s > click
SEARCHbutton. Alternatively,RESETbutton will remove the applied filters to allow the user to start new filtering. -
Left-top Filter Bar: end-users can click
Add Filtericon > select the required filter/s > clickAPPLYbutton. Other available icons allow users toResetand remove the applied filters, navigate through the previously applied filters through theUndoandRedoicons. -
Filter Element on the Dashboard’s PG: end-users can click
+icon on the filter element > select the required filter/s > clickAPPLYbutton. To remove the applied filters, users can clickXicon.
Note
When a user applies filtering using the Filter Pane, the resulting search can be saved for the user as a personal bookmark that can be accessed by the same user any time by clicking MY SAVED SEARCHES button.
End-users can add multiple dynamic measures and dimensions to a dashboard using the ADD + capability without designer intervention. Multiple measures can be layered side by side for comparison, and additional dimensions can be added to pivot tables as rows or columns, turning the dashboard into an ad-hoc report builder for exploring data from different angles.
Dashboard Quick Actions Ribbon
At the top-right side of the dashboard “View” window, several icons are available to apply general actions directly on the dashboard.

| Dashboard View Action Icons Explained | |
|---|---|
| JAS Explain: | analyzes the dashboard or individual dashlets and generates a natural-language narrative of the data. Three built-in AI Personas are available — Action-Oriented Manager, Strategic Executive, and a customizable persona — each producing a different explanatory style suited to the audience. |
| Add a clone: | the “Clone” feature is TURBOARD’s patented solution to easily compare changes in dashboards’ visualizations by presenting these changes side-by-side with synchronized vertical scrollbar only (no horizontal scrolling). By cloning a dashboard vertically within the same interface/medium, it significantly eases the process of comparing the changes on different criteria and directly exploring the effects of different filters. End-users can create up to 4 clones and analyze the data with different filter settings in each one. When a clone is added, an icon to Remove it automatically appears next to the Clone icon. Note that in order to clone a dashboard, at least one filter must be added to the dashboard. |
| Edit: | to open the dashboard in “Edit” mode to modify its elements, designs and settings. This option will appear to users whose dashboard is shared with them with “Can Edit” privileges only. Viewer users will not be able to edit the dashboard but only view it. |
| Refresh dashboard and dashlets data cache: | to update the data displayed on all the dashboards of the showcase and their components (dashlets) by reloading the temporary storage location (cache) where data is stored. |
| Change theme: | to modify the color palette and overall appearance of the dashboard and use a different theme than the default applied for TURBOARD's general elements and designs, and/or the theme selected by the designer. This customization option allows you to view your dashboard according to your preferences. |
| Export: | end-users can export the whole dashboard as PDF, Excel, Word, or PPT (Presentation) or send it to a recipient via the “Send to E-mail” feature. The format(s) and the export options that are allowed for end-users are determined and configured by the dashboard’s designer. The exported formats are designed to best suit the needs of users. For example, when exporting the dashboard in Excel format, the auto-generated Excel file will be named according to the dashboard name and the applied filters (if any). Its first sheet will have the dashboard’s URL link and a list of the applied filters. When the dashboard is exported via “Send to E-mail” option, the default recipient e-mail address will be that of the user and can be changed to any other e-mail address, the dashboard will be attached as a PDF file in the sent e-mail, and the e-mail design will be according to the configurations and settings in “Administration” > “Other Settings” > “SMTP Settings”. |
| Share meta info: | when clicked, a pop-up window opens listing the related data source(s), the view(s) of the dashlets added to the relevant dashboard, in addition to the showcases where this dashboard is added to. These elements are also clickable to allow the user to navigate directly to them. It can also be accessed from the dashboard ellipsis menu in the dashboards’ listing window, namely the “Meta Info” option. This option will appear to Designer users only. |
Dashlet Options for End-Users
End-users can also apply several actions on the dashlet level. These options are available though the dashlet’s ellipsis right-top menu.
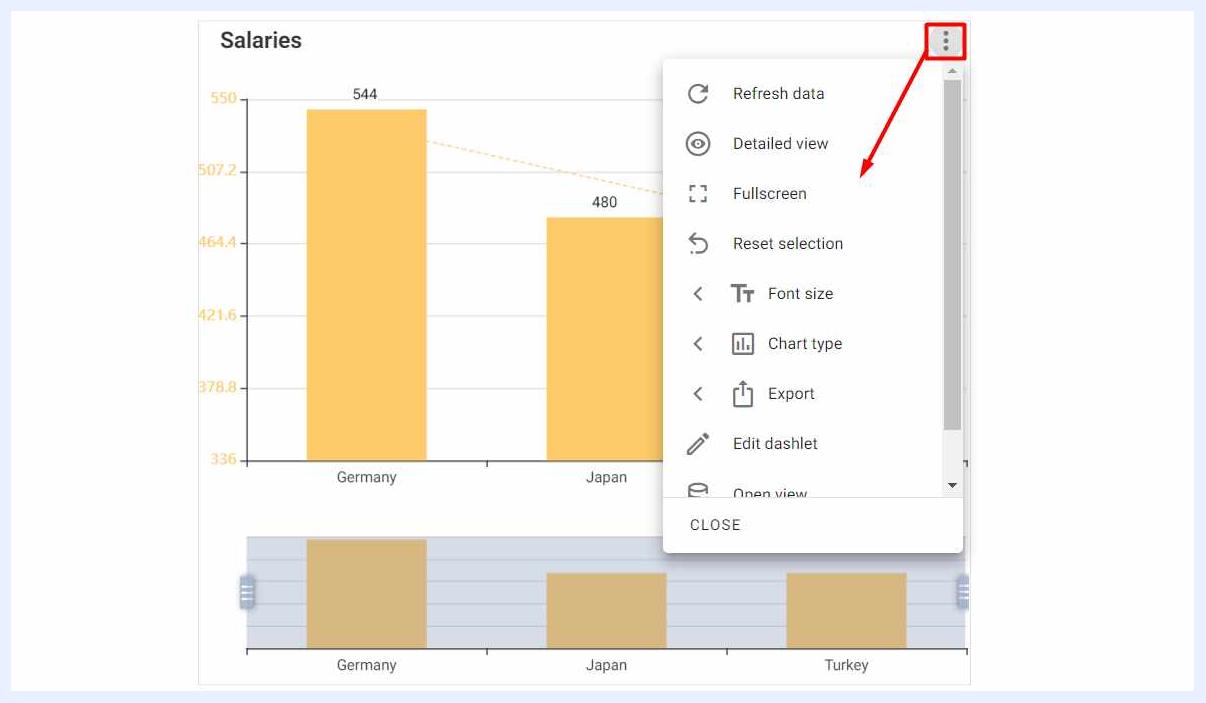
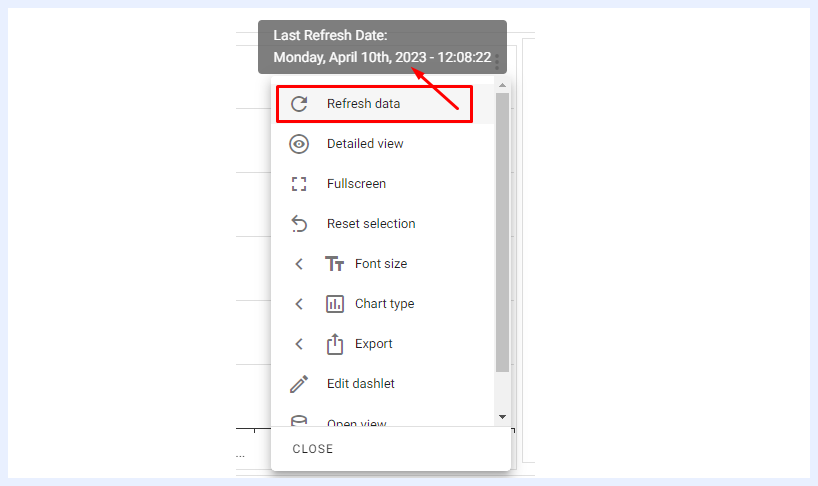
- Refresh data: to update the data of the selected dashlet by reloading the temporary storage location (cache) where data is stored. On hover, the last refresh date and time are displayed to users.
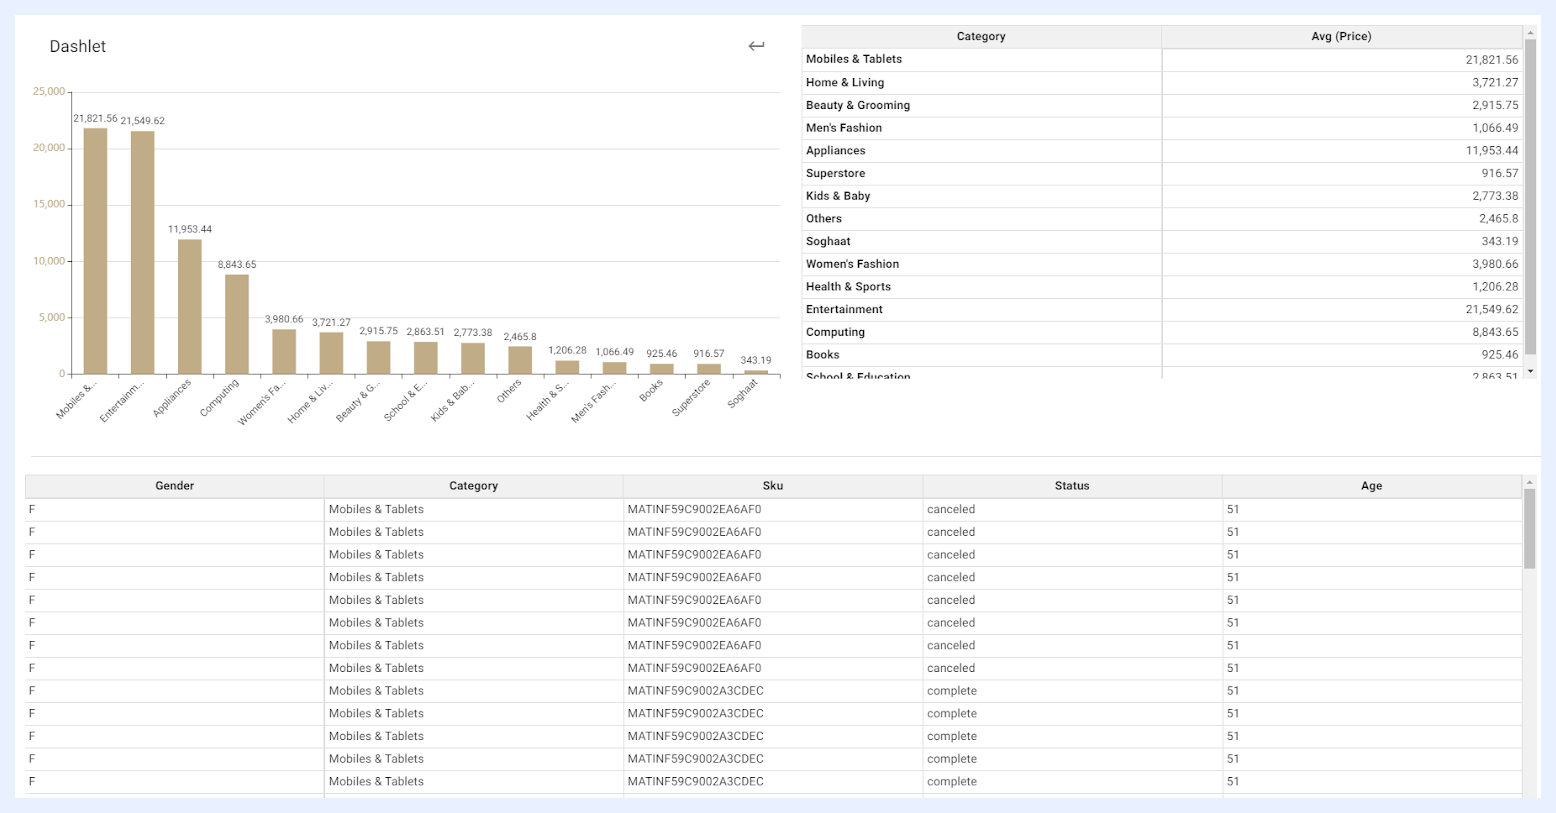
- Detailed view: when selected, the dashlet will open in a new window showing its detailed table according to its relevant view, the pivoted table with the default datacells, and the original dashlet (chart, gauge, info cell, map or PT).
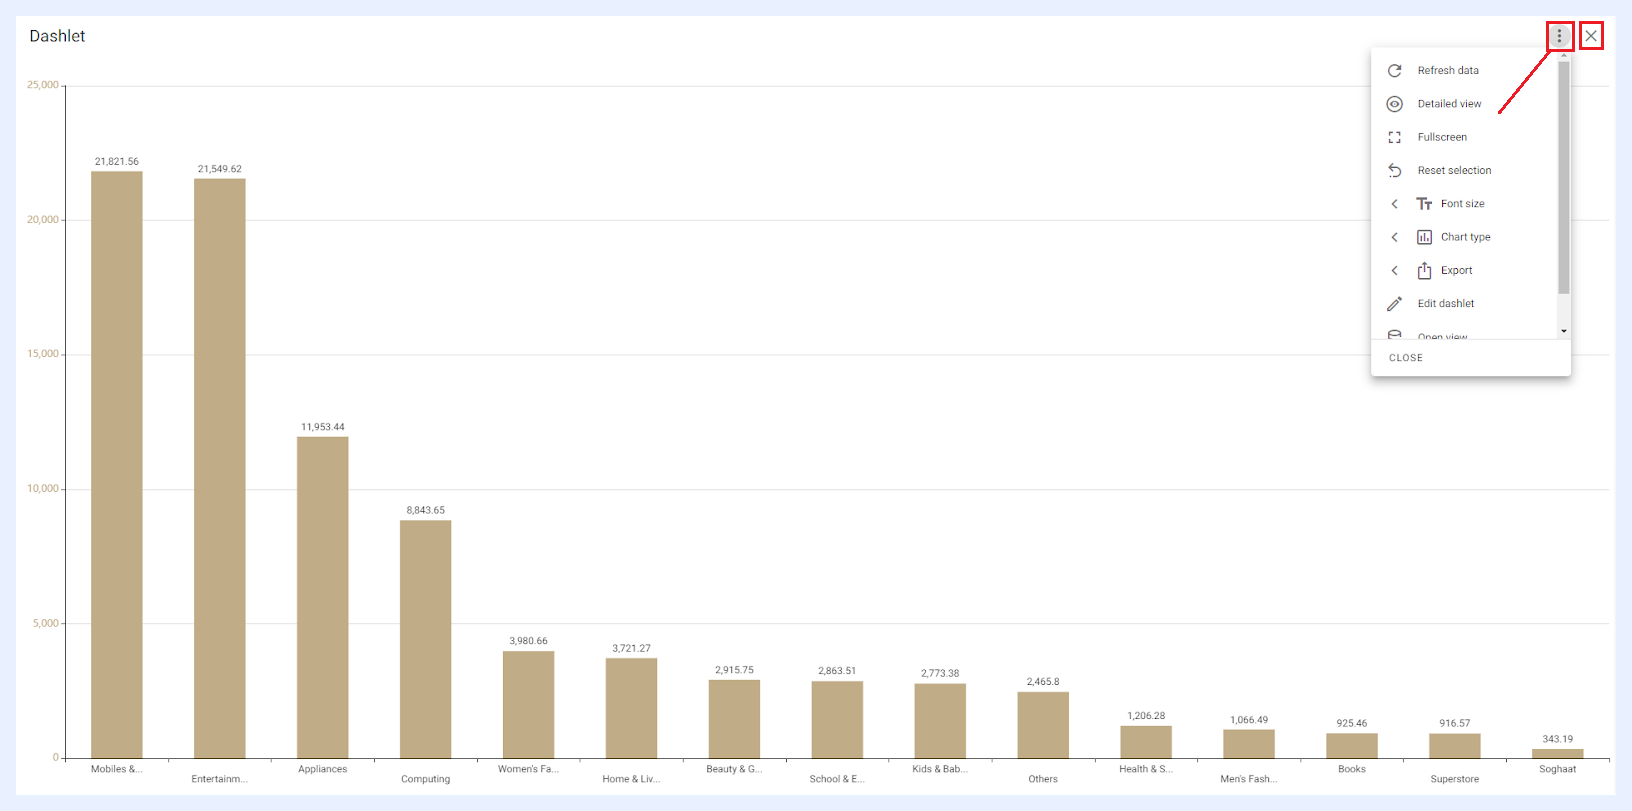
- Fullscreen: when selected, the dashlet will open in a mode that covers the entire screen, replacing the current dashboard. To return to the dashboard, the user can close the dashlet window using the
Xicon button. The ellipsis menu will also be available to the user in the fullscreen mode.
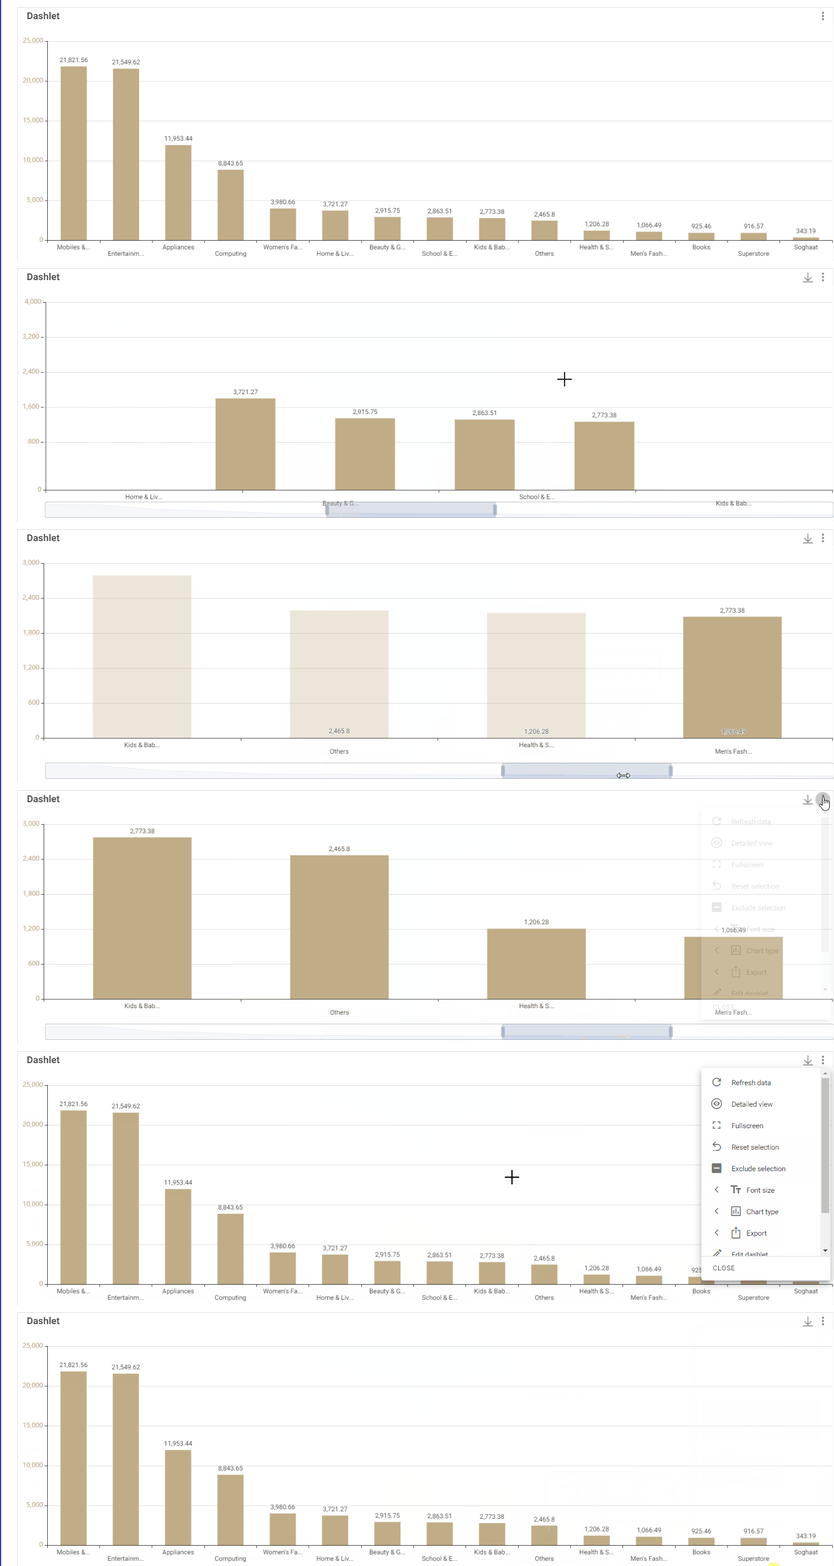
- Reset selection: if the end-user has made a selection on the dashlet, using this option allows resetting the selection to the default.
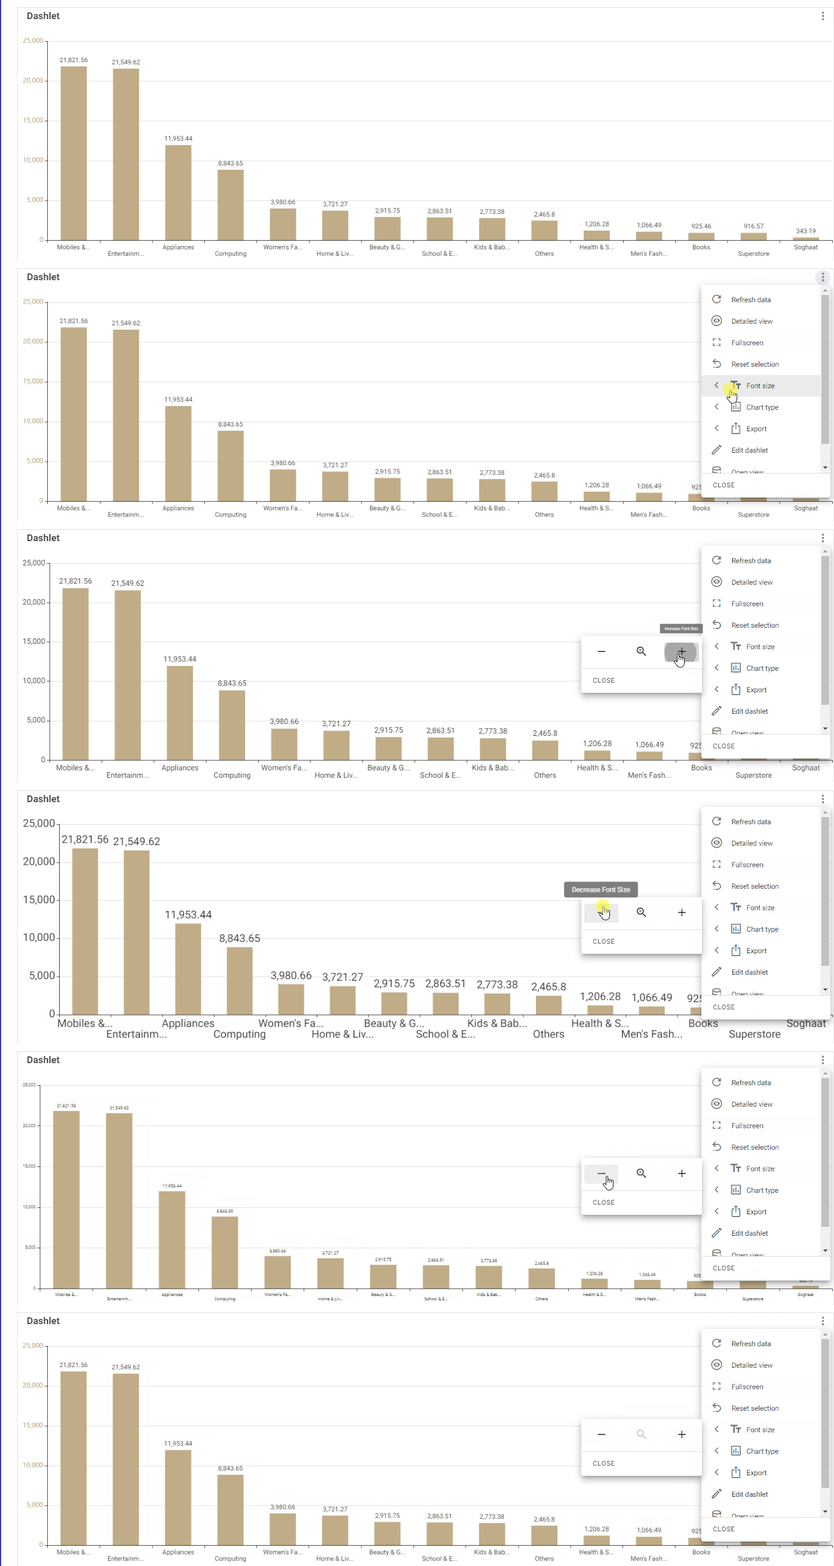
- Font size: end-users can manipulate the font size of all the texts of the relevant dashlet using this option. You can enlarge or reduce the font size and reset it as needed.
-
Export: end-users can export a single dashlet (not only the whole dashboard) in different file formats and can print it out as well. The format(s) and the export options that are allowed for end-users are determined and configured by the dashboard’s designer.
-
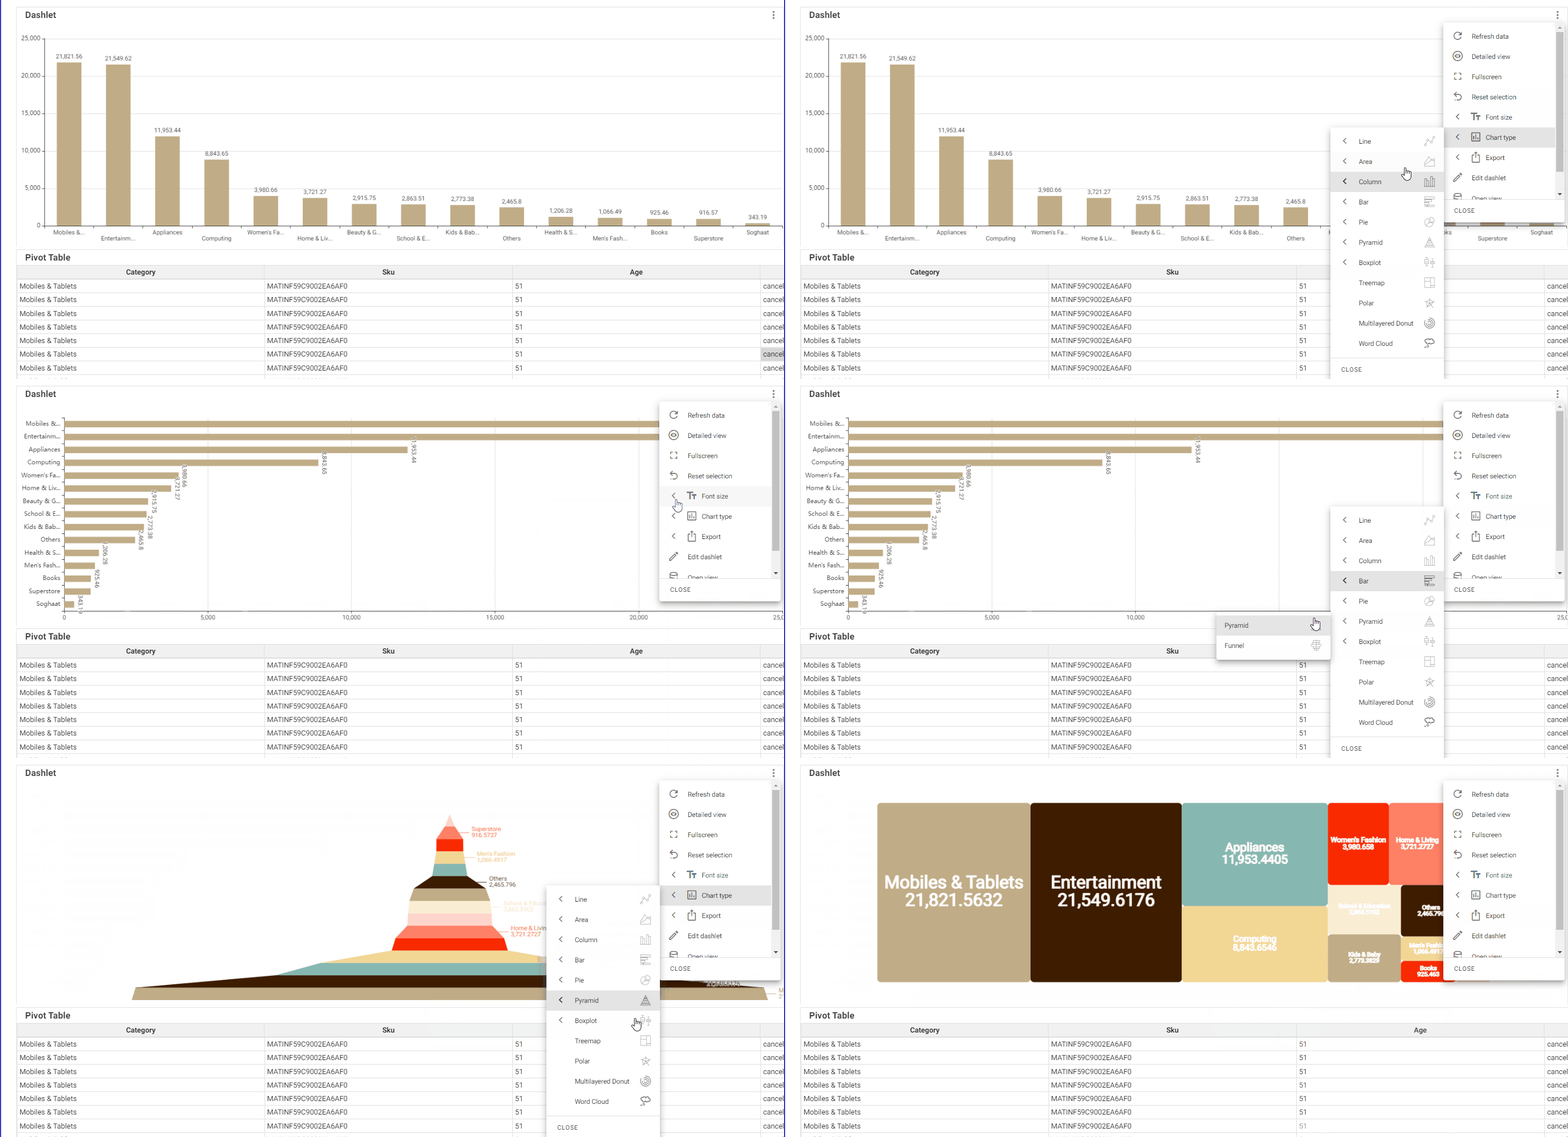
Chart type: using this option, end-users can directly change the chart type in the UI without affecting the original dashlet type for other users. End-users may realize that a certain chart may not be the best one to visualize its data. For example, a pie chart with data labels may not fit the specified area well. In this case, users may try other options and explore other types of charts in the UI directly with a click of a button. The changes made in the UI are not saved, and only that user can see the updated charts. This feature is only available for dashlets of type “Chart” and will not appear in the relevant ellipsis menu for other dashlet types.
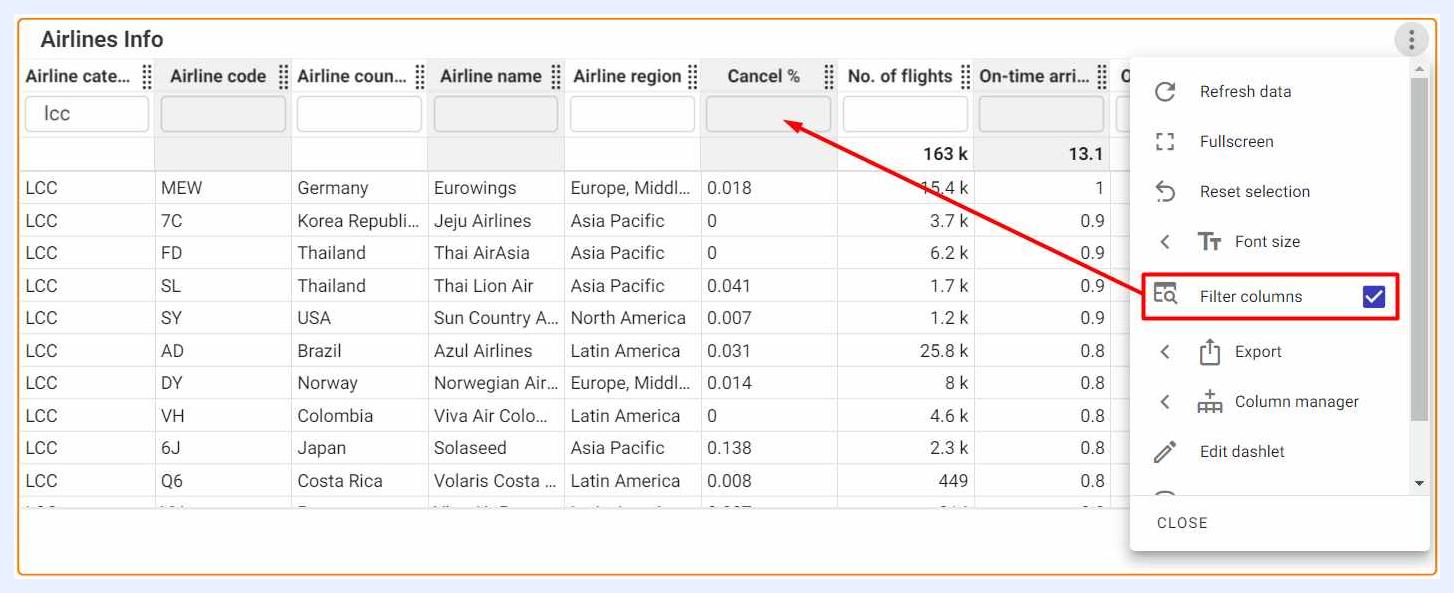
- Filter column: when selected, it allows the user to filter the results in unpivoted table dashlets using search filters for each column in the table. This feature is only available for dashlets of type “Pivot Table” and will not appear for pivoted tables nor in the relevant ellipsis menu for other dashlet types.
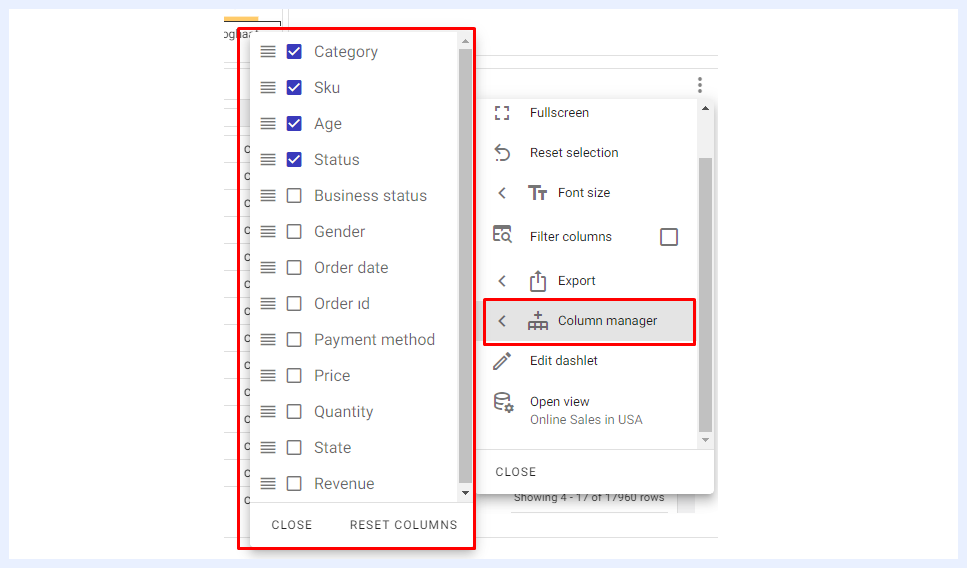
- Column manager: to remove some columns from unpivoted table dashlets if needed. This feature is only available for dashlets of type “Pivot Table” and will not appear for pivoted tables nor in the relevant ellipsis menu for other dashlet types.
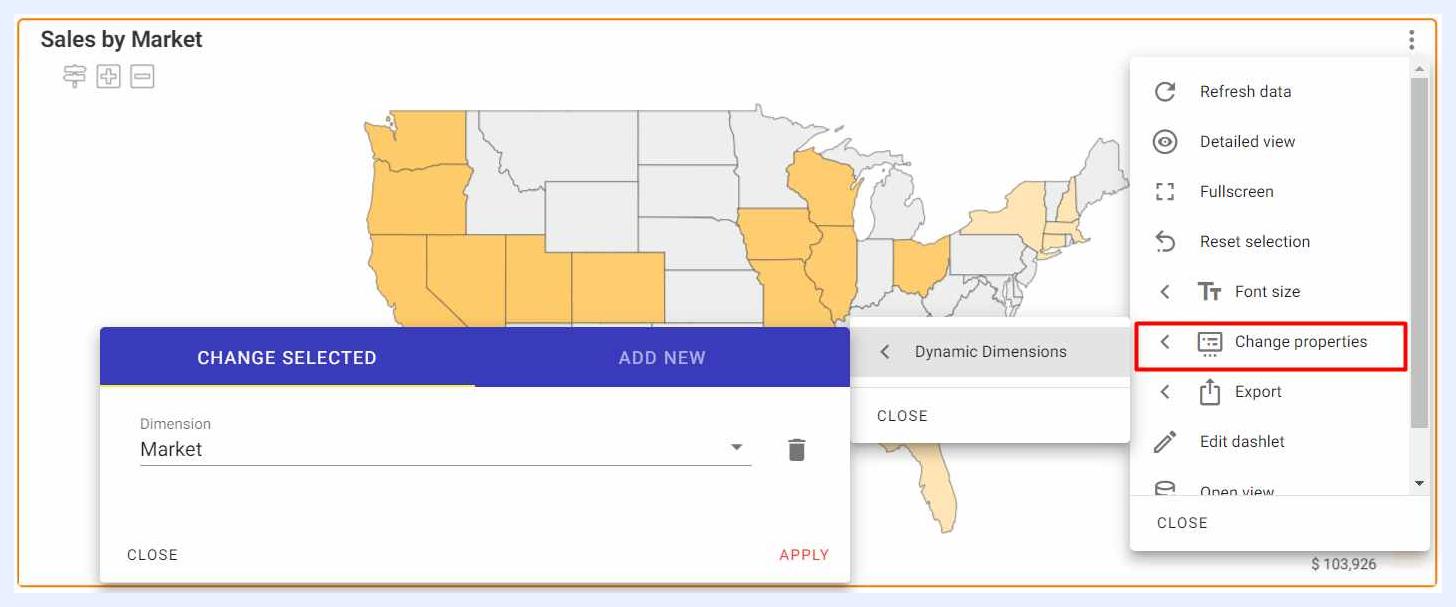
- Change properties: using this option and if a regional map dashlet has Dynamic Measure(s) and/or Dynamic Dimension(s), end-users can change these nodes directly in the UI without affecting the original dashlet for other users. This feature is only available for dashlets of type “Regional Map” and will not appear in the relevant ellipsis menu for other dashlet types.
-
Edit dashlet: to open the dashlet in “Edit” mode to modify its elements, designs and settings. This option will only appear to users whose dashlet is shared with them with “Can Edit” privileges.
-
Open view: to open the relevant view in “Edit” mode to modify its nodes, data tables and any other required settings. This option will only appear to users whose view is shared with them with “Can Edit” privileges only.