Dashlet Playground Sections
Dashlet Playground (PG) Sections
The page where the dashlet is configured (add/edit mode) is called the playground (PG) in our terminology.
There are several layers to configure the visual on the PG where these layers generally share the same location and general features in the PG for all the 5 types of dashlets as below. Some features and settings are specific to certain types of dashlets than others. I.e. they will appear on the playground of the related dashlet type only, or they have different functionalities according to the dashlet type.
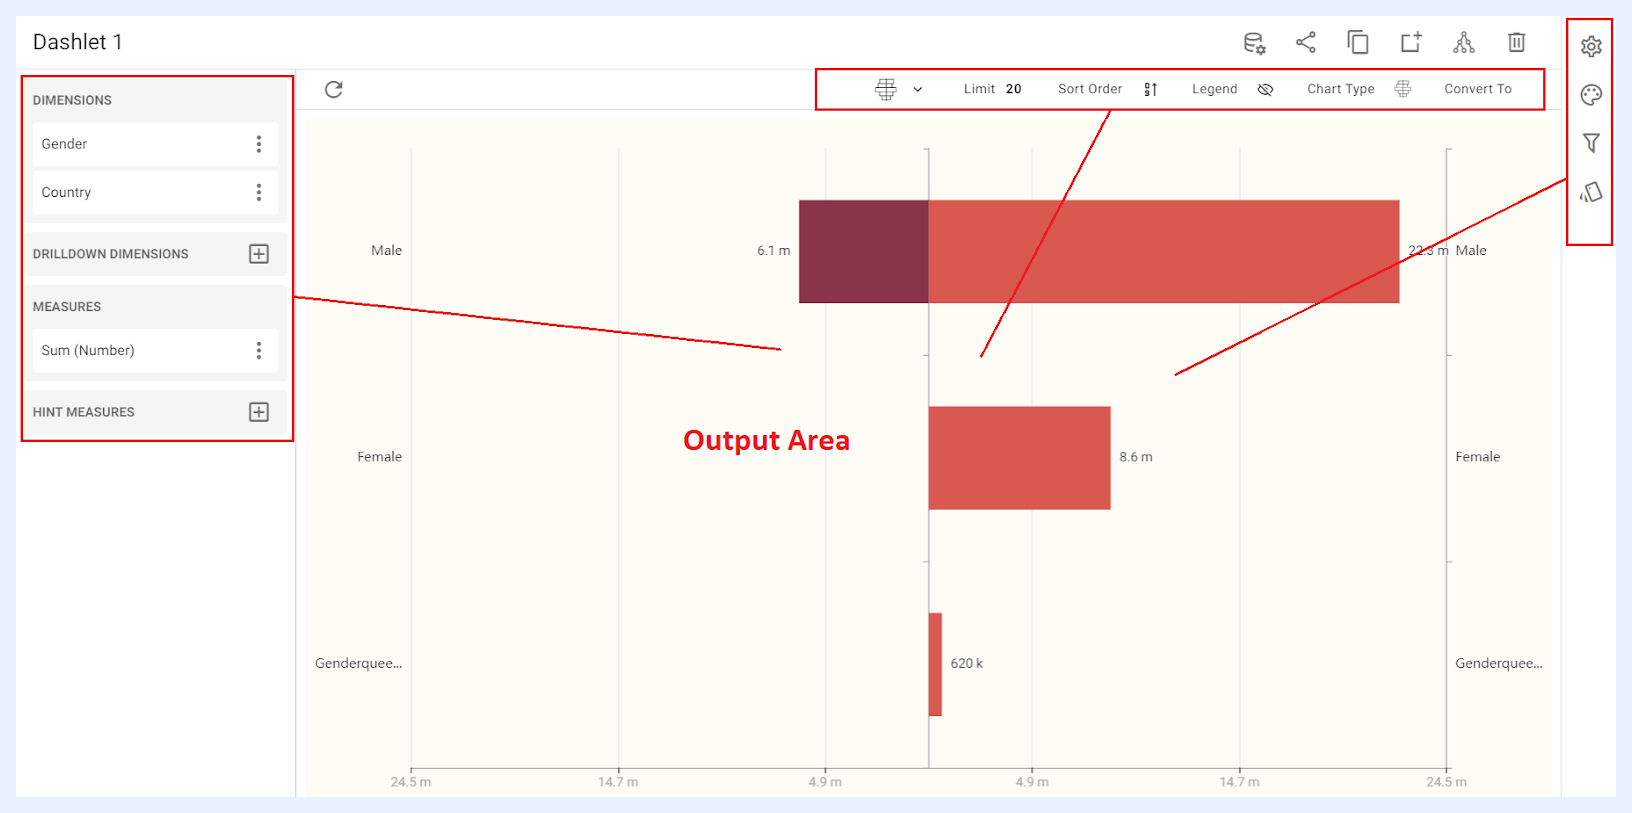
The shared sections that have common functions for all dashlet types are: Output Area, Quick Action Ribbon, and Dashlet and Playground Toolbar.
Other sections that have chart type-dependent features and functionalities will be demonstrated according to each chart type, and they are namely: Nodes Pane, Dashlet Settings and Configuration Panel (Settings, Styling, Filters and Conditional Formatting).
What is the Nodes Pane in Dashlet PG?
Nodes Pane is the section located on the left side of the PG, where the nodes of the view are listed as dimensions, measures, datacells in addition to the custom-added expressions. They are grouped according to the node types as determined in the view and according to the dashlet type.
The user can add a node to the dashlet by clicking the + right-corner icon for the related node type then clicking ADD button for the selected node.
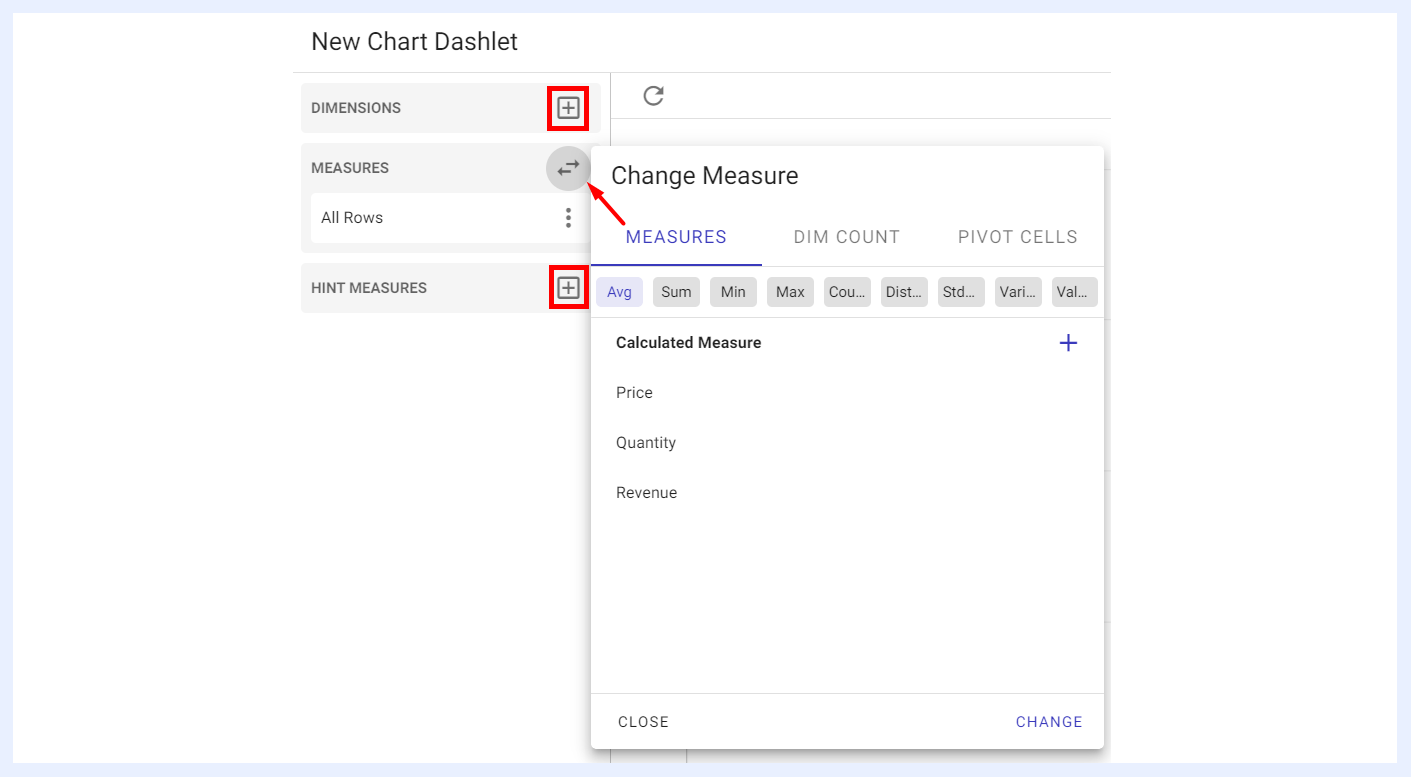
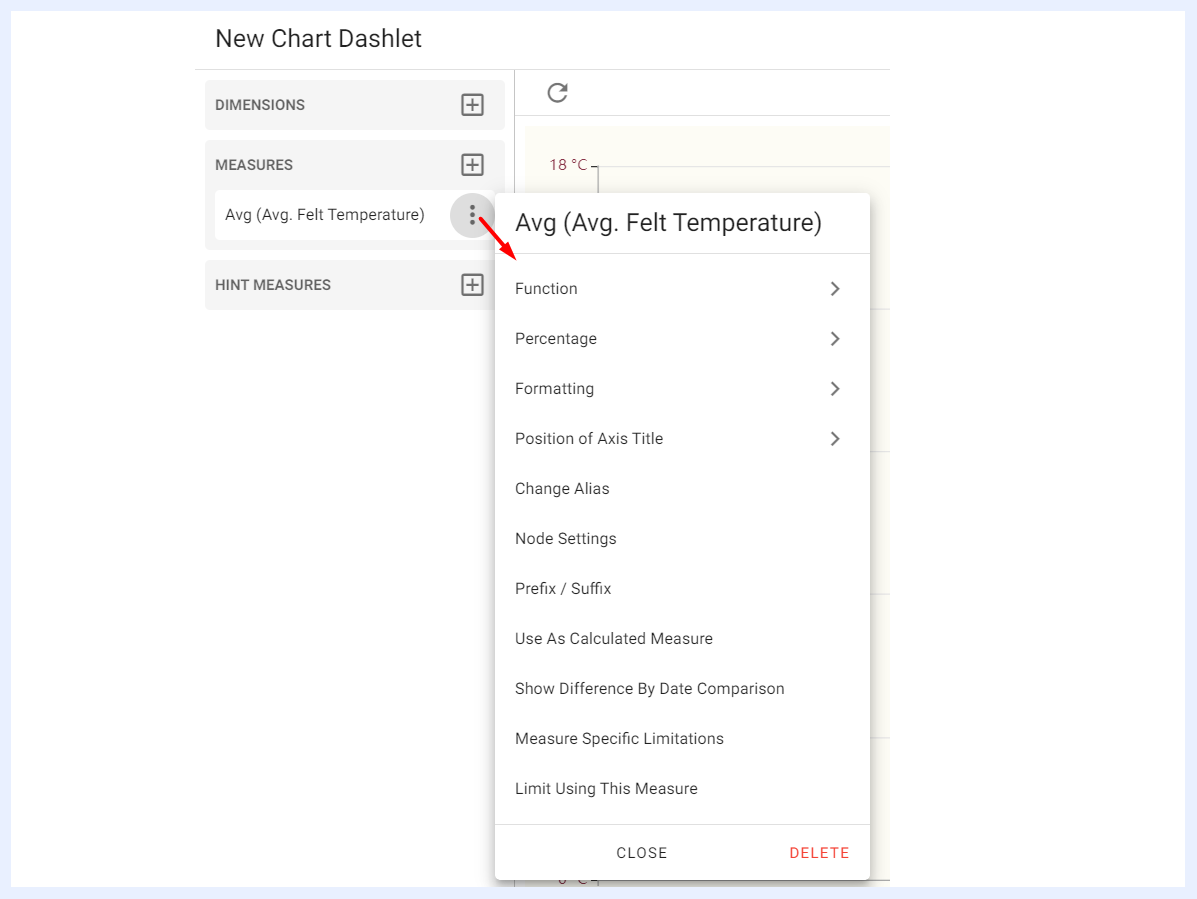
The added node(s) will be listed under “Nodes Pane” in which you can change its settings and edit its preferences by clicking the ellipsis menu for the added node. Those settings and preferences are dashlet type-dependent as well.
Output Area
The output area is the result of the dimension(s) and measure(s) combinations – which differs according to each dashlet type. It interactively responds to the designer's selections.
There is no save or update button as all the actions are auto-saved. This means that whenever any setting is changed and/or a configuration is selected, the changes are automatically saved and directly applied to the resulting dashlet in the output area.
Quick Actions Ribbon
At the top-right side of the dashlet’s add/edit window, several icons are available to apply general actions on the dashlet. The quick actions ribbon is available for all dashlet types, and always available at the same location.

| Dashlet Quick Action Icons Explained | |
|---|---|
| Edit data view: | to go to the “View” from which the dashlet is connected to. This option directly opens the Edit View page in a new window as you may need to edit or change the nodes’ settings while working on your dashlet. |
| Share: | to share the dashlet and make it available to either for public or with defined user(s) and/or group(s). When a dashlet is shared with “Can View” privilege, shared users will only be able to view the dashlet. When it is shared with “Can Edit”, shared users can apply changes to the dashlet settings as well. This option can also be accessed from the Dashlet’s ellipsis menu in the Dashlets’ listing window. |
| Copy: | to duplicate and copy the dashlet with the same settings but under a different name, where you have the option to open it in the current window or in a new tab/window. |
| Add to the selected dashboard: | to add the dashlet to an existing dashboard by selecting the required dashboard in the overlay window that opens then clicking ADD button, or to add it to a new dashboard through + CREATE A NEW DASHBOARD button that is available in the same overlay window. |
| Share meta info: | when clicked, a pop-up window opens listing the related data source, the view that the dashlet depends on, in addition to the dashboards and the showcases that this dashlet is used in (if not a newly created dashlet but opened in “Edit” mode). This option can also be accessed from the Dashlet’s ellipsis menu in the Dashlets’ listing window, namely the “Meta Info” option. |
| Remove: | to delete the dashlet. |
Dashlet and Playground Toolbar
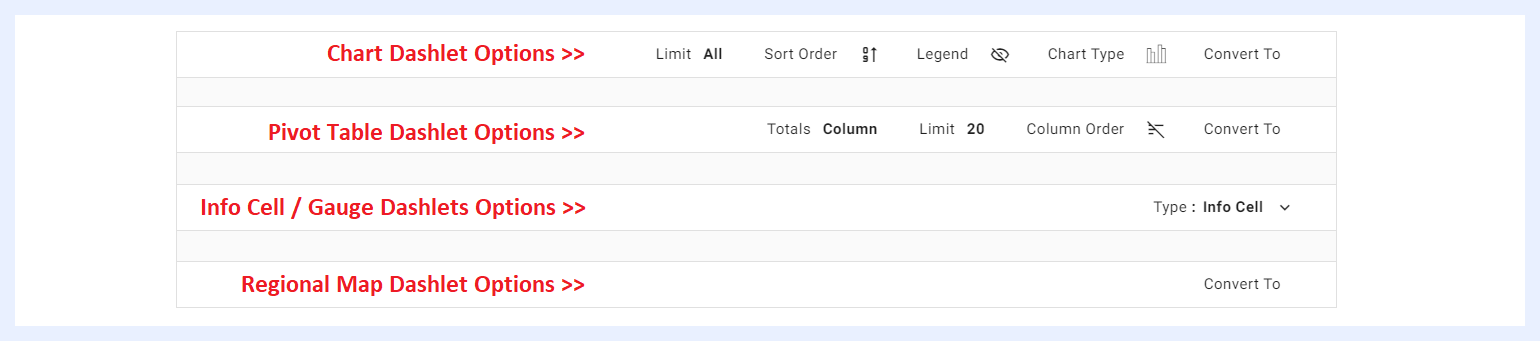
Located just above the output area, it provides the designer with the most common/needed view options on the Dashlet.
Some of these options are available for all deshlet types, while others are type-dependent as below.
| Dashlet and Playground Toolbar Options Explained | |
|---|---|
| Convert to: | some dashlet types can be converted into another type directly in the dashlet PG area. A chart can be converted into a pivot table and vice versa, and a regional dashlet can be converted into either a chart or a pivot table. However, if the number of dimensions and/or measures in the dashlet exceeds the maximum allowed for the targeted type, TURBOARD will notify the user and offer alternative options for converting the dashlet to the required type. |
| Limit: | to limit the number of displayed results if needed. This option is only applicable to chart and pivot table dashlets. |
| Sort Order: | to sort the resulting values in descending, ascending or alphabetical order. This option is only applicable to chart dashlets. |
| Legend: | to show the legend on the chart and determine its relative location. This option is only applicable to chart dashlets. |
| Chart Type: | to change the chart type from the available other types. This option is only applicable to chart dashlets. |
| Column Order: | to sort the columns in the table and arrange their order from left to right in descending, ascending or alphabetical order according to the names/values of the columns. This option is only applicable to pivot table dashlets. |
| Totals: | when applied, the totals for all the columns that have numeric values (such as price, quantity, etc.) can be displayed either at the top of the table or at the bottom. This option is only applicable to pivot table dashlets. |
| Type: | an info cell dashlet can be converted to a gauge or vice versa. |