Chart Configuration Menu
Settings Panel
The Settings Panel in TURBOARD provides a variety of customization options to enhance the functionality and visual appeal of your dashlets. These settings allow you to tailor the behavior of dashlets to meet specific analytical needs, optimize performance, and improve the clarity of your visualizations. Below is an overview of the key settings available in this panel, each of which can be enabled or configured to refine how data is displayed and interacted with in your dashboards.
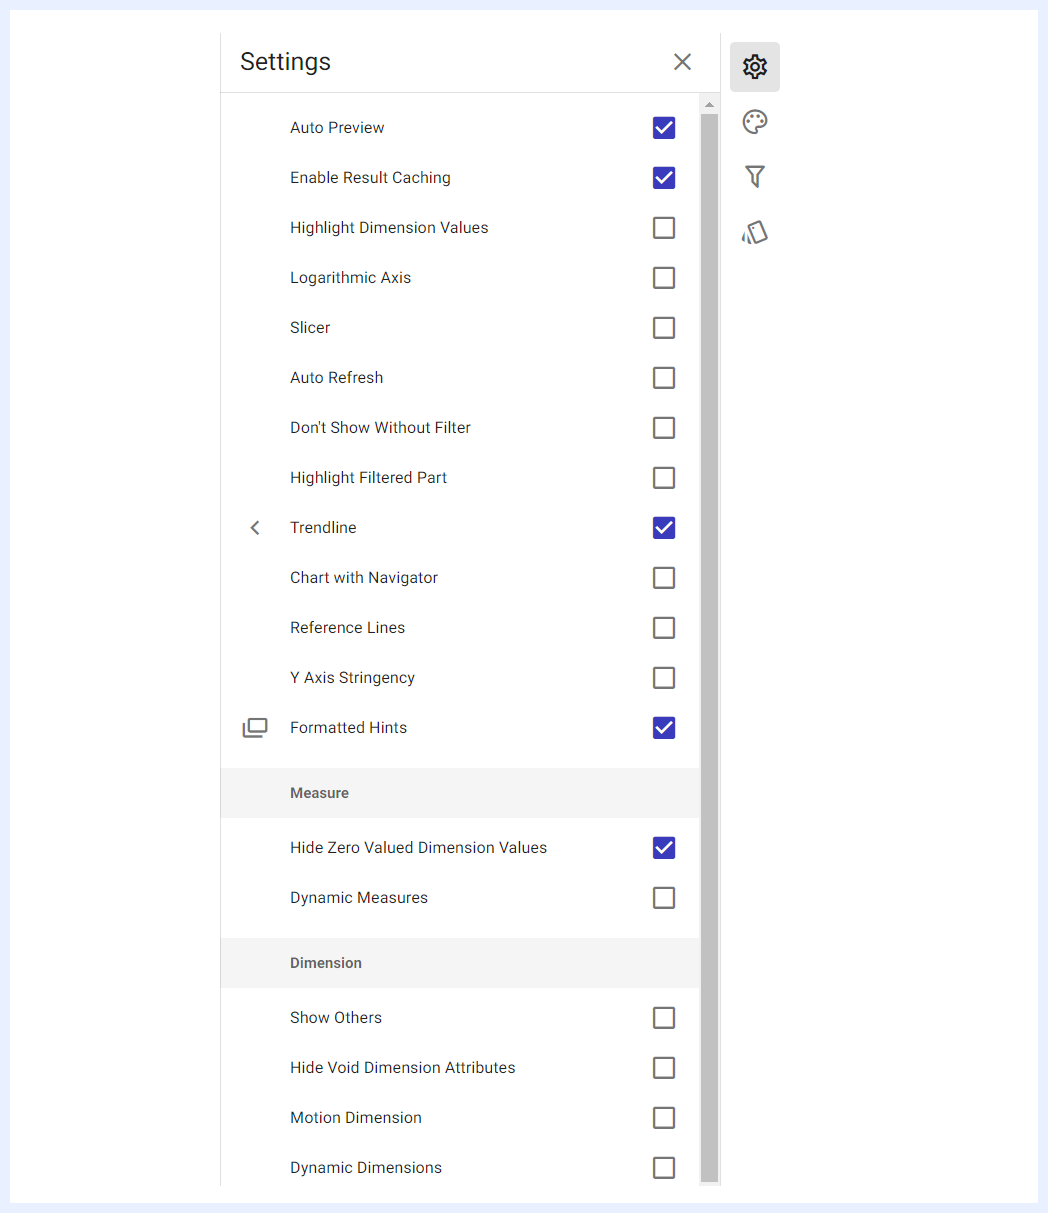
Auto Preview
When the “Auto Preview” check box is enabled, it will display the dashlet on the dashboard to automatically respond to any changes made on that dashboard. This means that the data in the dashlet will be refreshed and updated as changes are made. If the option is not selected, the dashlet data will only be refreshed when the refresh button is clicked. It's important to note that this feature only applies to the current dashlet and will not affect other dashlets on the related dashboard(s).
Enable Result Caching
When the “Enable Result Caching” check box is enabled, the data retrieved from the server will be cached in memory, allowing for faster response times for subsequent selections. The cached data is automatically refreshed.
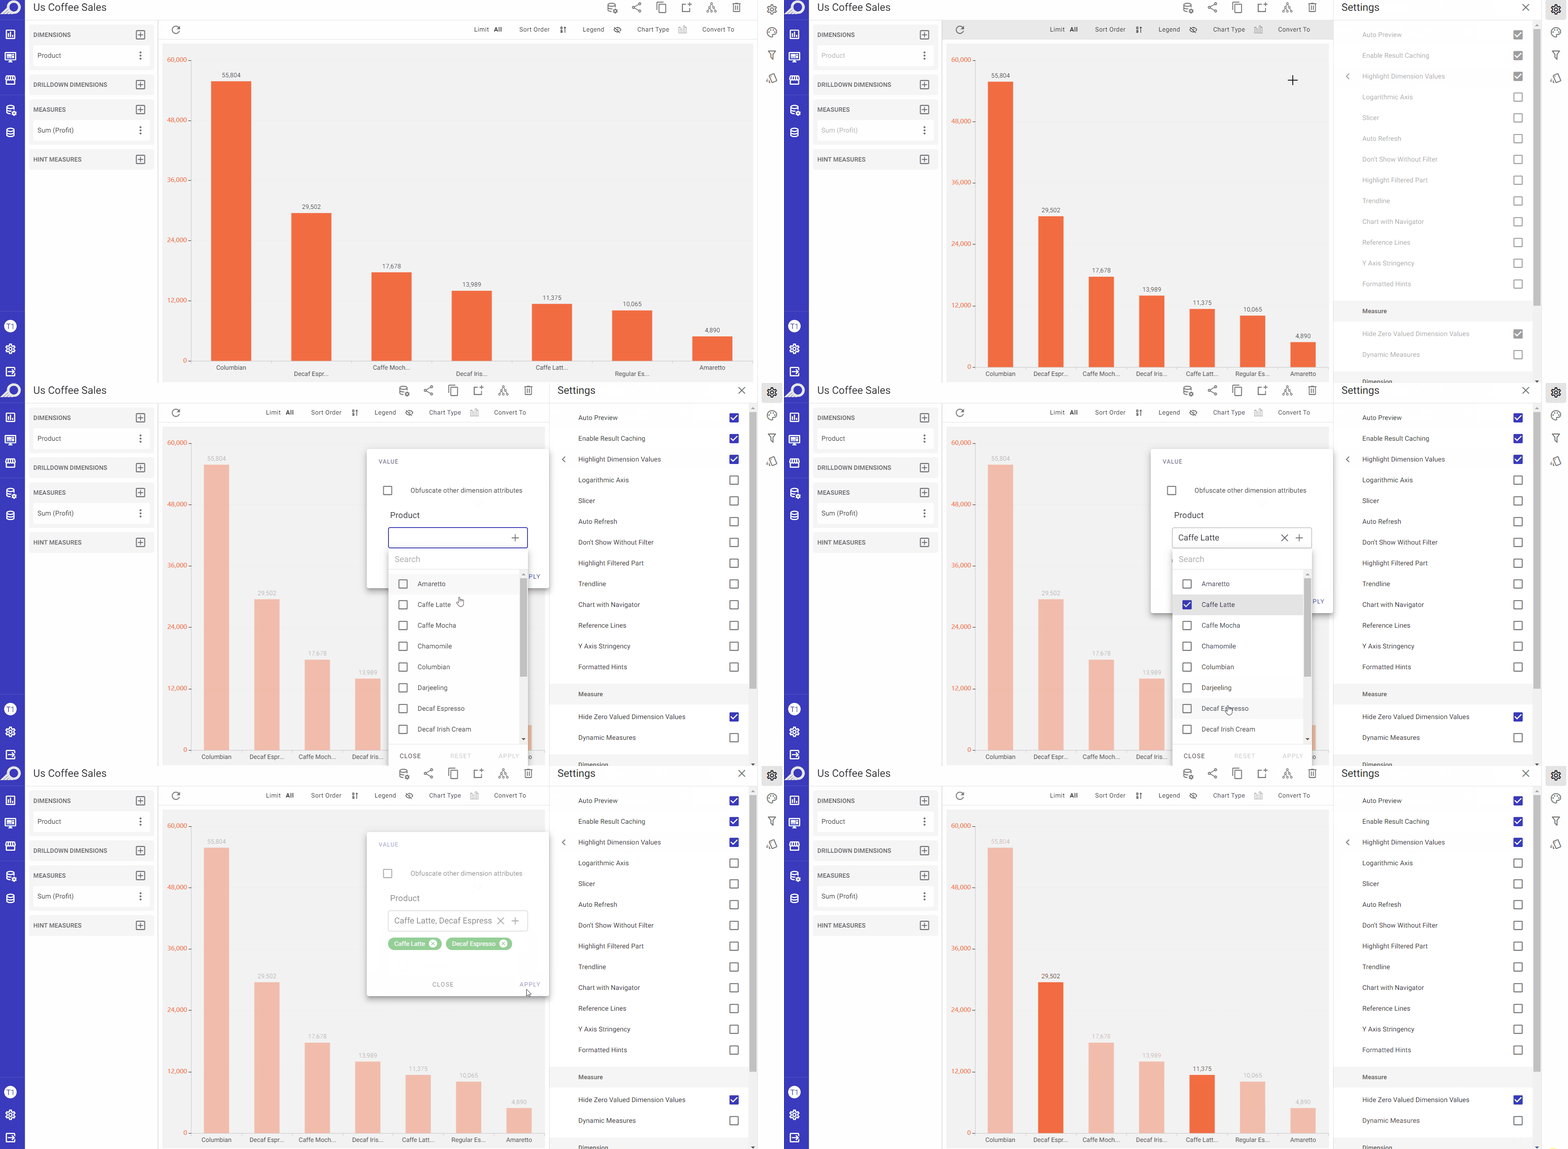
Highlight Dimension Values
This option is useful when dealing with complex datasets, where multiple dimensions are present in the chart. When using this option, it allows the user to emphasize specific values within a dimension on the chart. When this option is enabled, the selected values of the relevant dimension are highlighted with a brighter color, while other values are faded out or dimmed. The “Obfuscate other dimension attributes” check box in the slide-out window allows obscuring or hiding the attributes of other dimensions that are not currently being highlighted to further enhance the clarity of the chart.
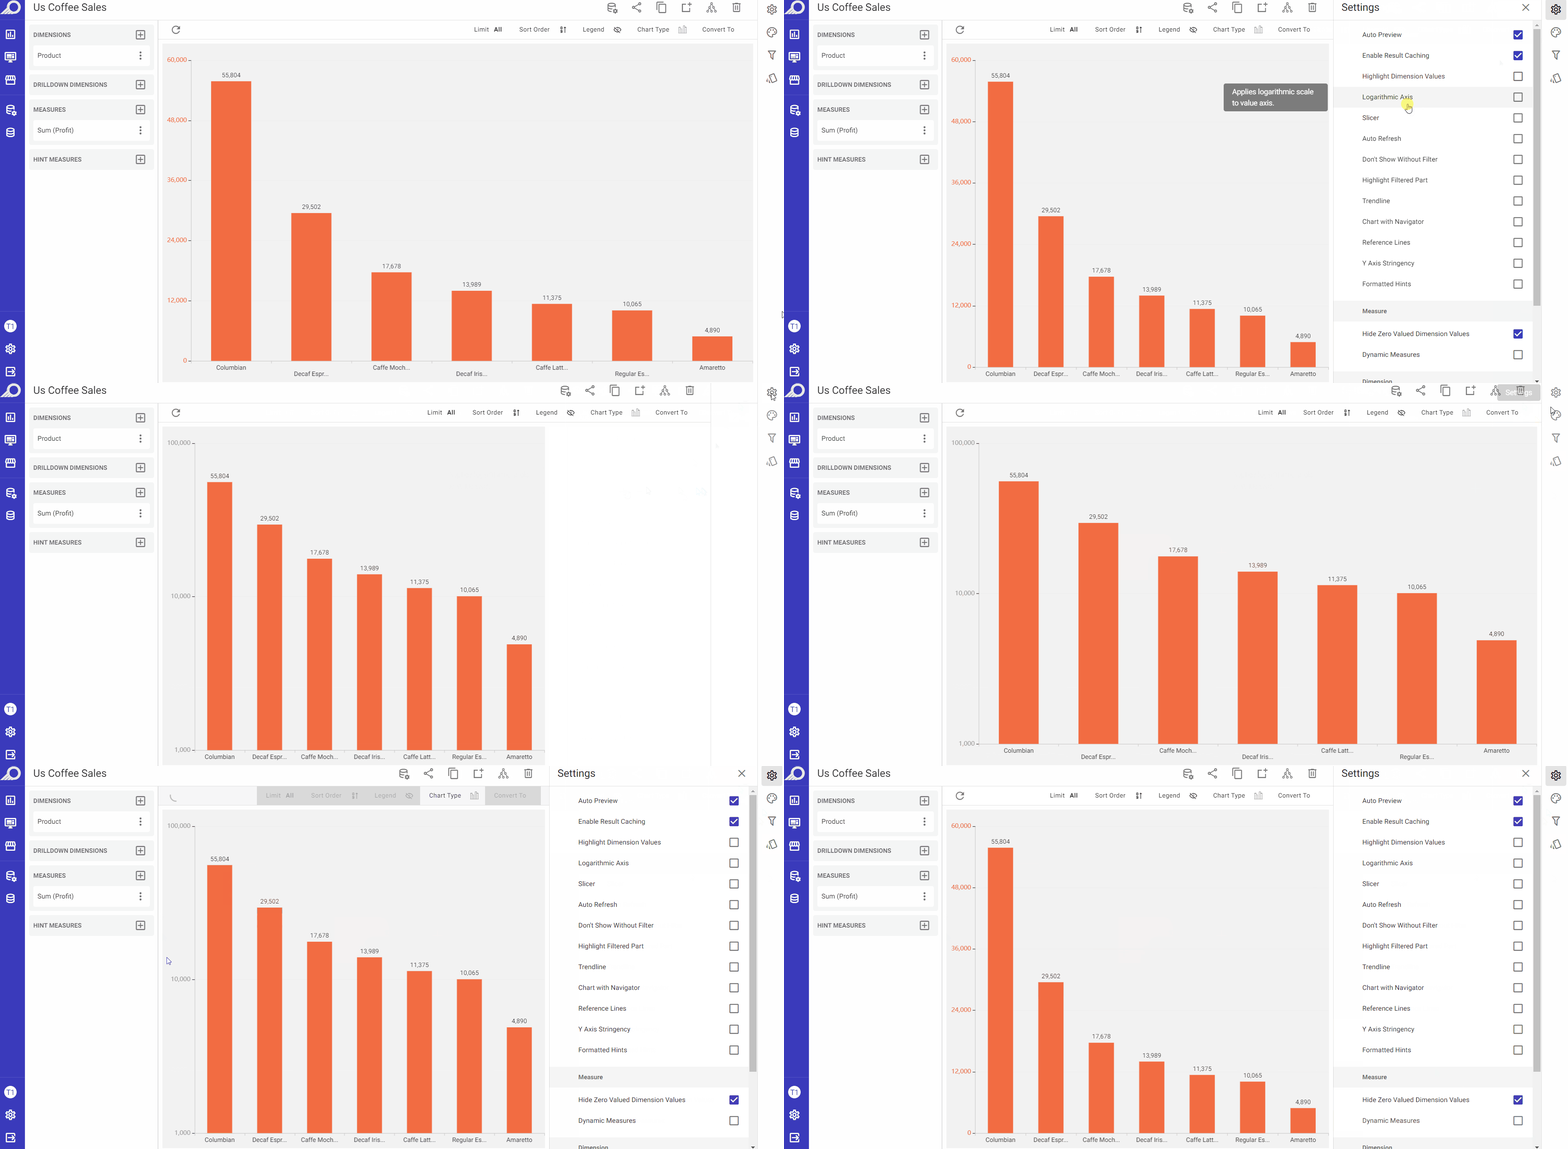
Logarithmic Axis
This option helps visualize data that spans a wide range of magnitudes, particularly when some values are much larger or smaller than others. When enabled by checking its check box, it will apply logarithmic scale to the value axis of the chart and will convert the scale of the axis from a linear scale to a logarithmic scale. For example, if the axis represents values from 1 to 10, each increment would be 1. In contrast, in a logarithmic scale, the values on the axis increase exponentially with each increment.
Slicer
When the “Slicer” check box is enabled, clicking on a value in the dashlet in its related dashboard will apply that value as a filter to the whole dashboard. If “Just highlight the selection” check box is checked, it will not act as a filter but will only highlight the selected value.
Auto Refresh
When the “Auto Refresh” check box is enabled, the related dashboard will automatically refresh at the specified intervals (in seconds), allowing you to set the desired duration for each renewal.
Don’t Show Without Filter
When the “Don’t Show Without Filter” check box is enabled, the dashlet will not display data without a filter being selected. In the overlay window that opens, “Any Filter” can be selected, or specific filter(s) can be chosen.
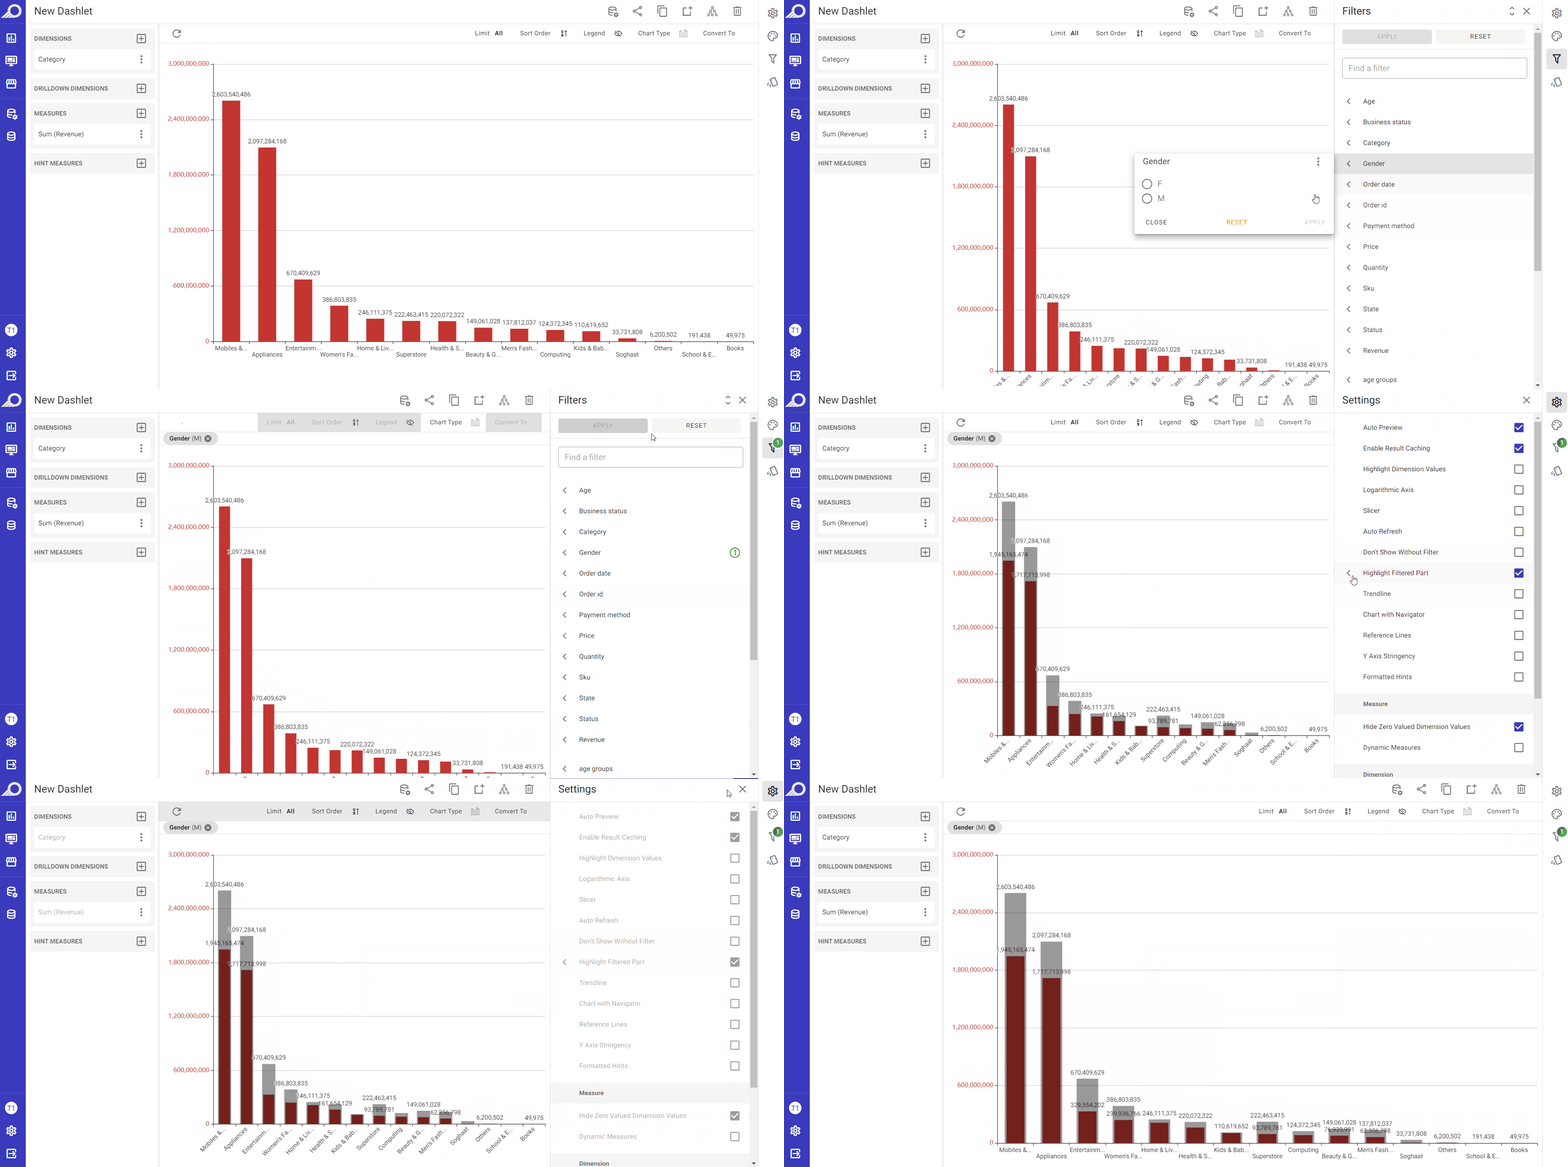
Highlight Filtered Part
This option allows the user to focus on a subset of data that is filtered, while also maintaining a view of the unfiltered data. When this feature is enabled, the unfiltered data is displayed in a faded color, while the filtered part is highlighted in bold. This allows the user to see the difference between the filtered and unfiltered data more easily.
Trendline
This option allows adding a linear or a moving average trendline to the chart. A trendline is a line that represents the general direction of a set of data points. It can be useful in identifying patterns or trends in the data, and in making predictions about future values. When the “Trendline” option is enabled by checking its check box, the user can choose between a linear trendline “Trendline” or a “Moving Average” trendline. The linear “Trendline” shows the overall change in value over time, and may have an “Opaque Background” to make it more visible. For the “Moving Average” trendline, the user can also specify the period over which the moving average is calculated.
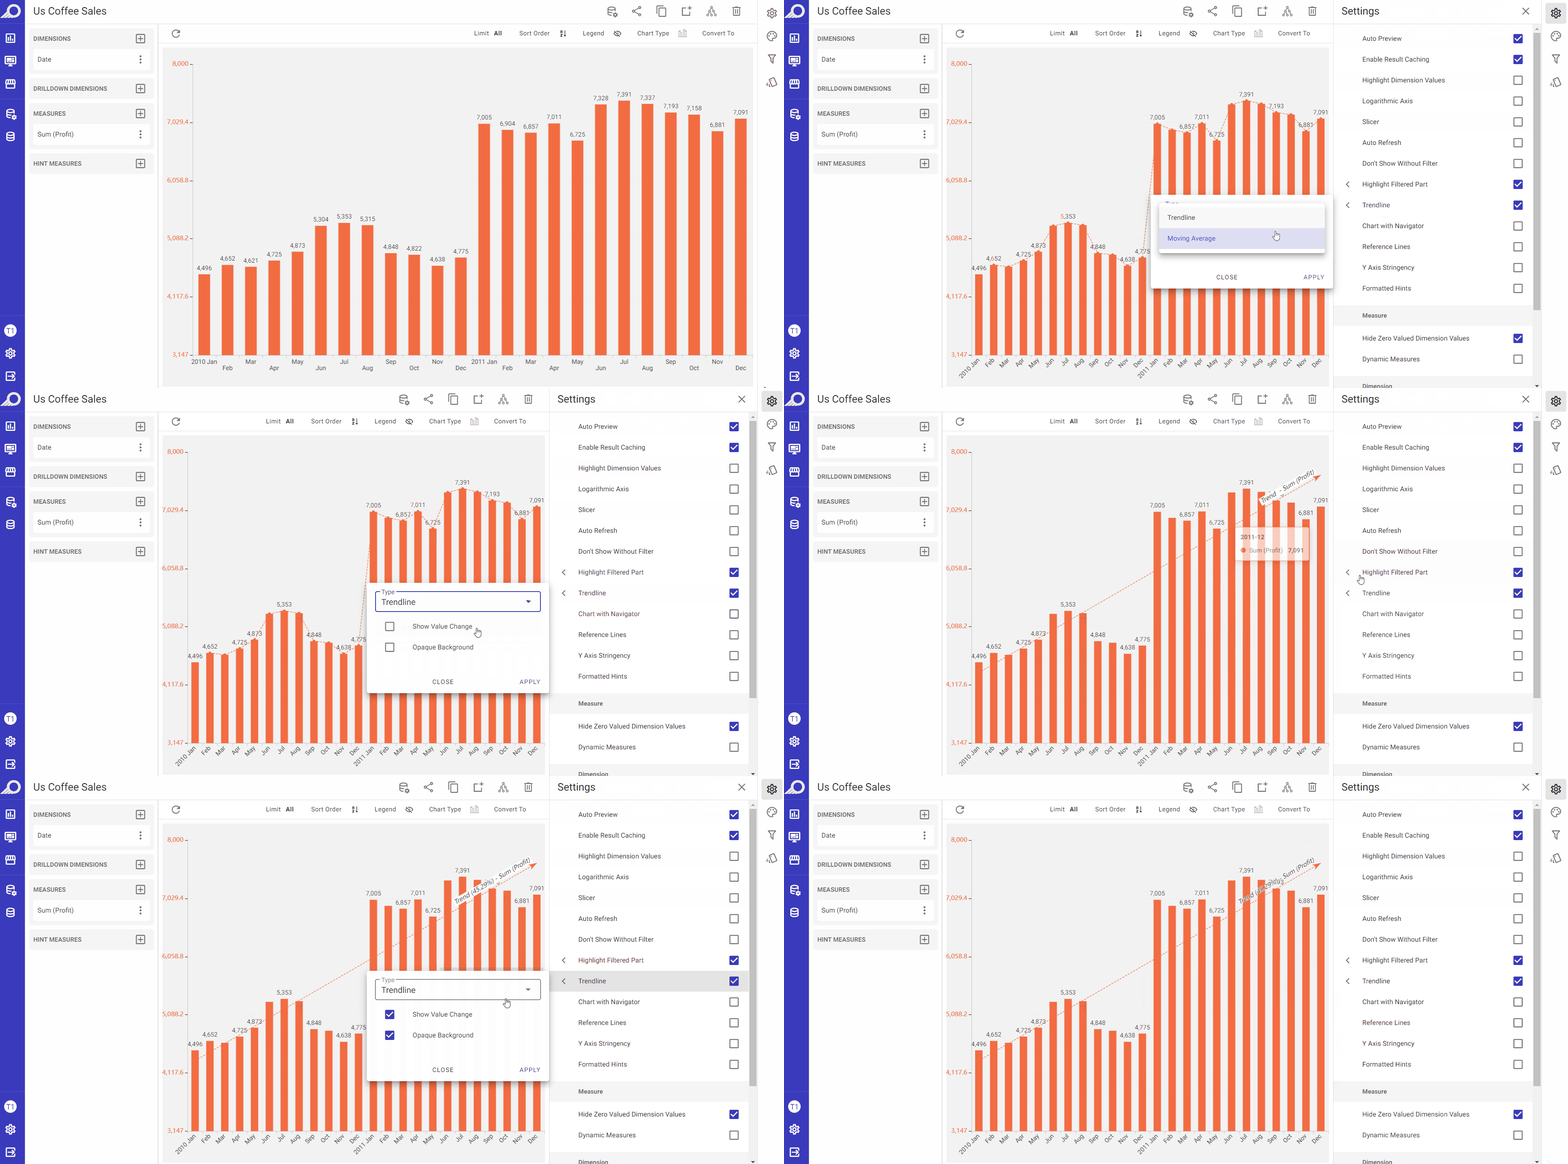
Chart with Navigator
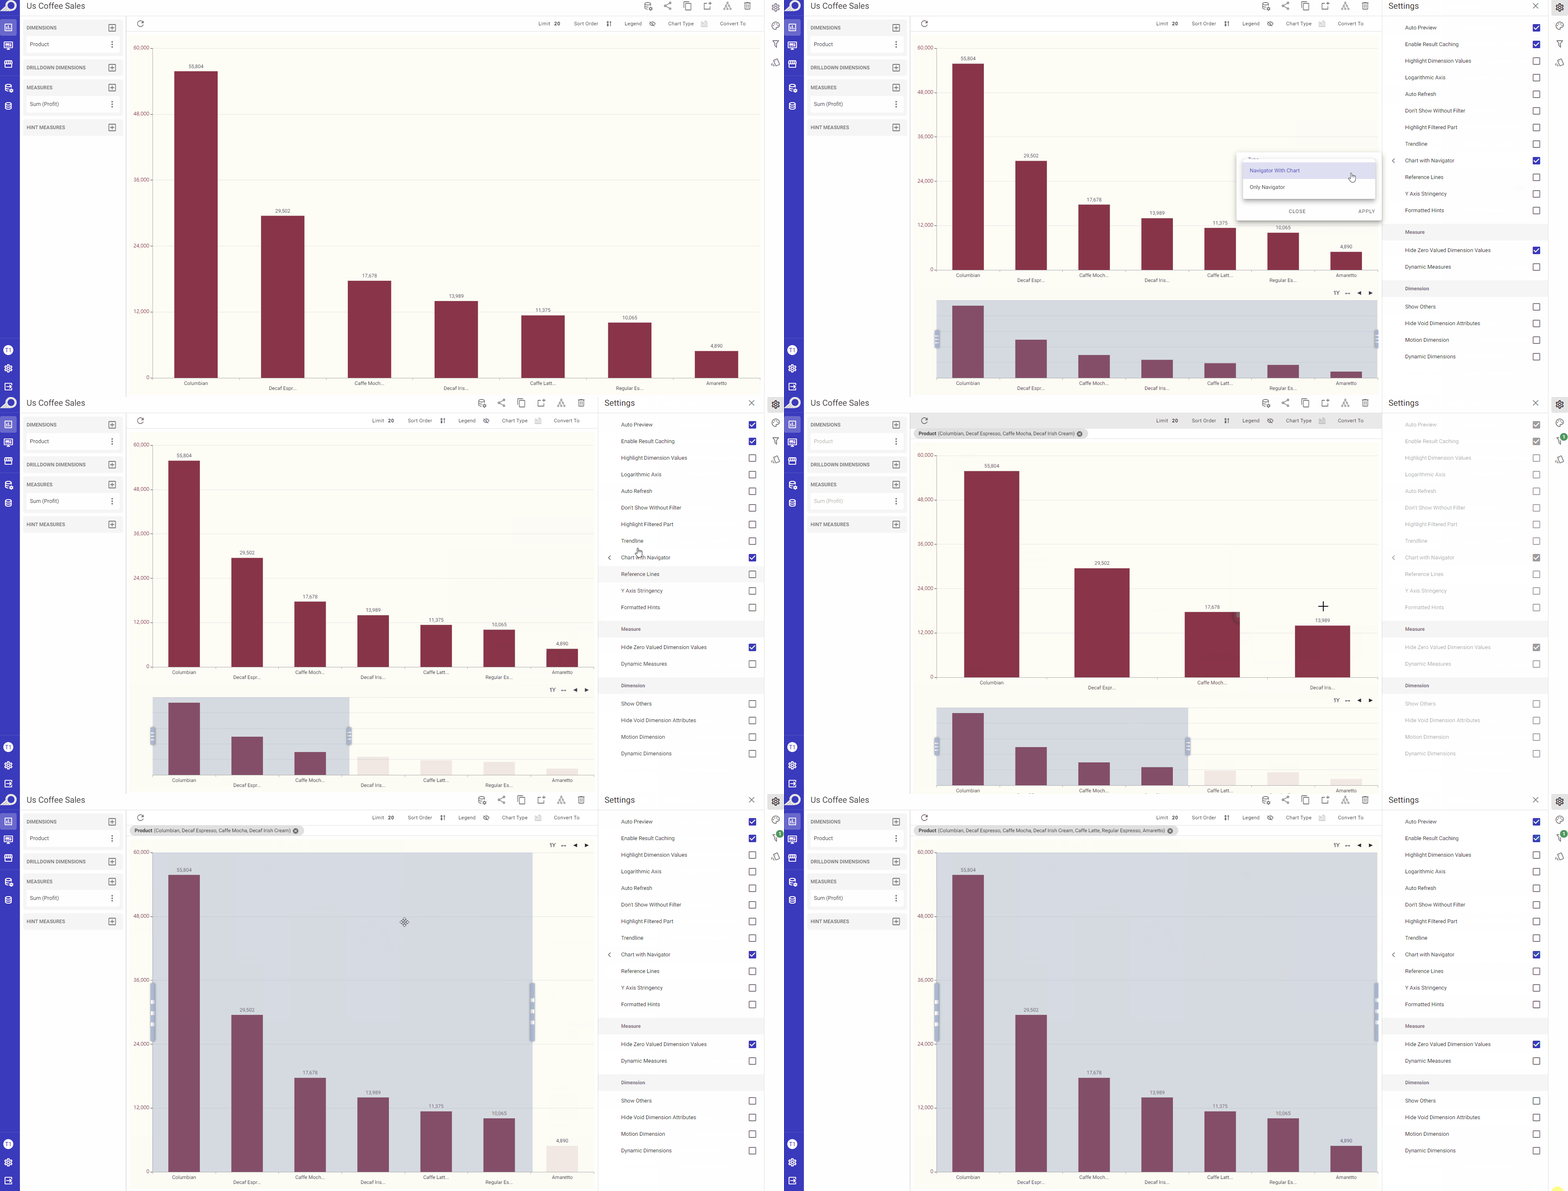
The navigator of a chart is a smaller chart or graphical element that provides an overview of the entire dataset being displayed in the main chart. It is typically used to allow users to quickly and easily navigate through large amounts of data. Therefore, it is best used for situations where the data is huge and the user needs to come closer or filter a specific part quickly and make inferences clearly.
A “Chart with Navigator” allows choosing and displaying a specific part of the dashlet, and also allows using different metrics on the navigator such as 1M (1 Month), 1Y (1 Year), etc. to change the data segments and navigate through them.
It offers a filter feature based on the first selected size. The default when a chart is created is “No Navigator”.
When the “Chart with Navigator” check box is checked, a slide-out menu will become available in which the user can:
1 Select the navigator “Type” form its drop-down menu:
- Navigator with Chart: when selected, the chart will appear as dual dashlets where the satellite is filtered according to the navigator and the navigator always shows the selected range.
- Only Navigator: when selected, the resulting dashlet will be a visual that always shows the entire data range, with the constraint region changing according to its filter only.
2 Determine “Minimum Range” for the navigator. A minimum range for the navigator means that the navigator is set to always display a minimum range of data, regardless of how much data is being displayed in the main chart.
3 Click APPLY button when the preferences are determined.
Reference Lines
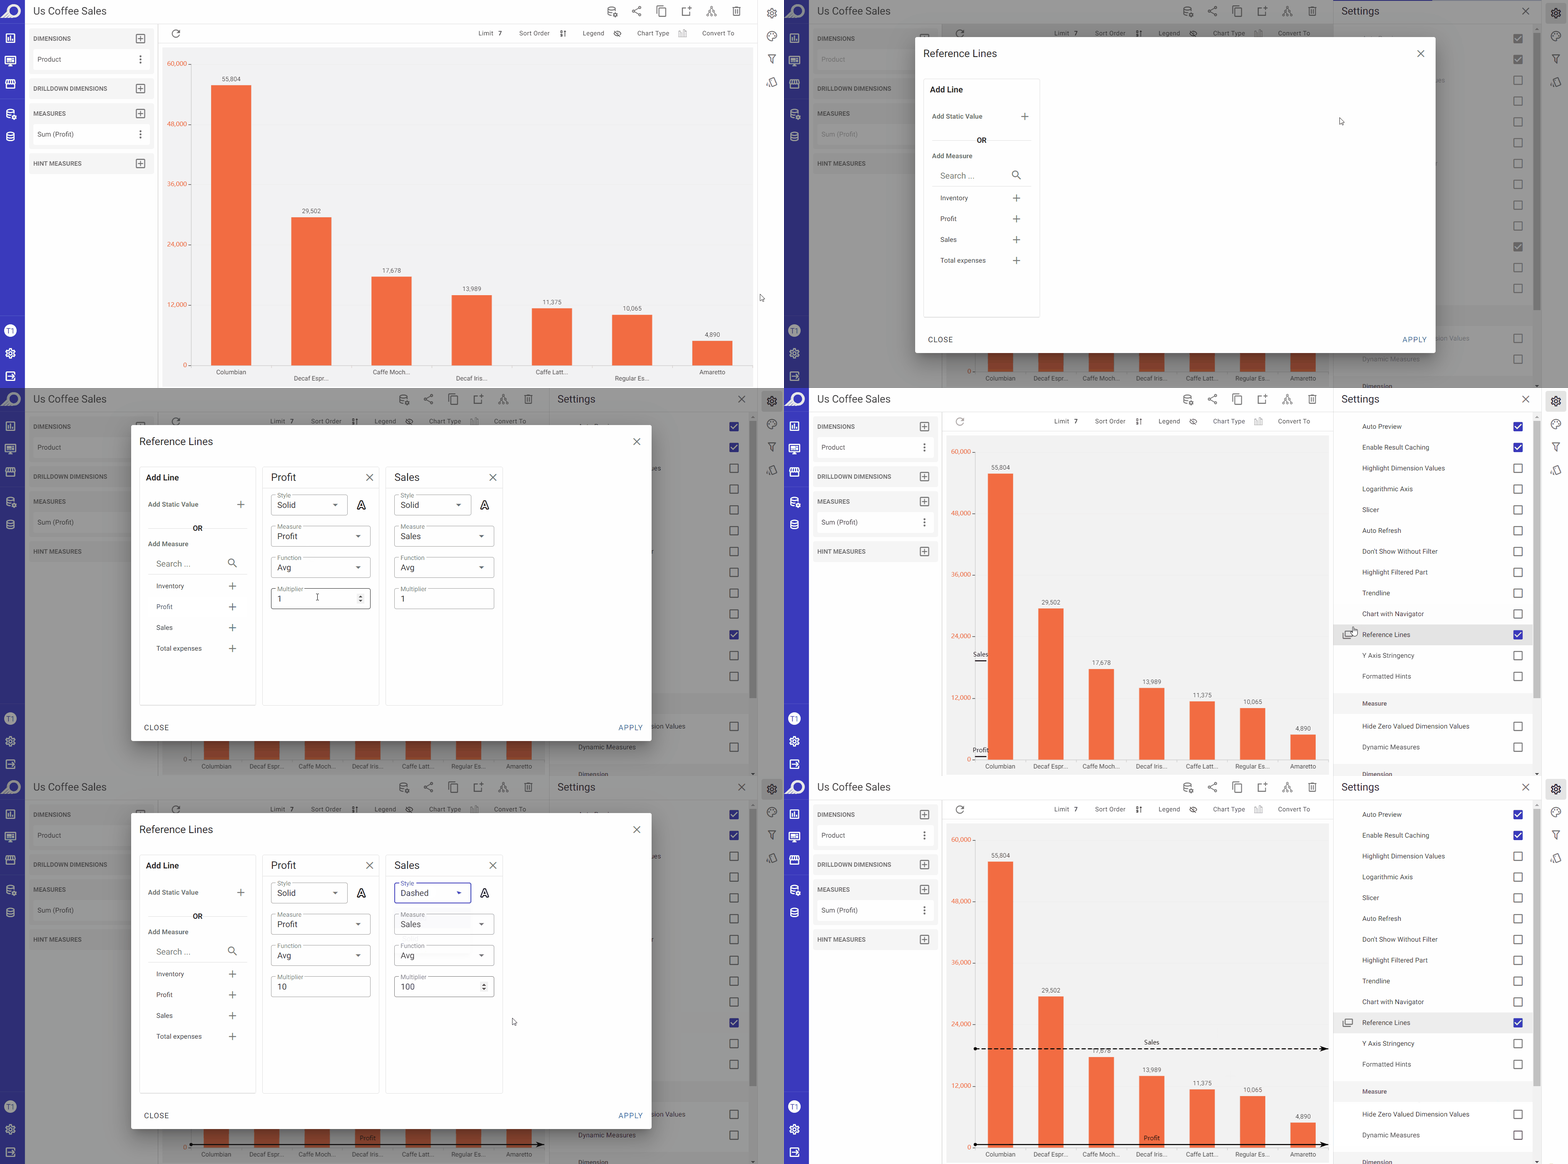
When the “Reference Lines” check box is checked, it allows adding one or more reference lines to the chart in the correspondent overlay window that opens. These lines can be used to indicate a specific value or threshold that is relevant to the data being displayed. The user can set the value of each reference line, either as a static value or by using a measure value. A static value would be a fixed number chosen by the user, while a measure value would be a value calculated based on the data in the chart. Additionally, the user can also choose the color of each reference line, which can help distinguish them from other lines in the chart.
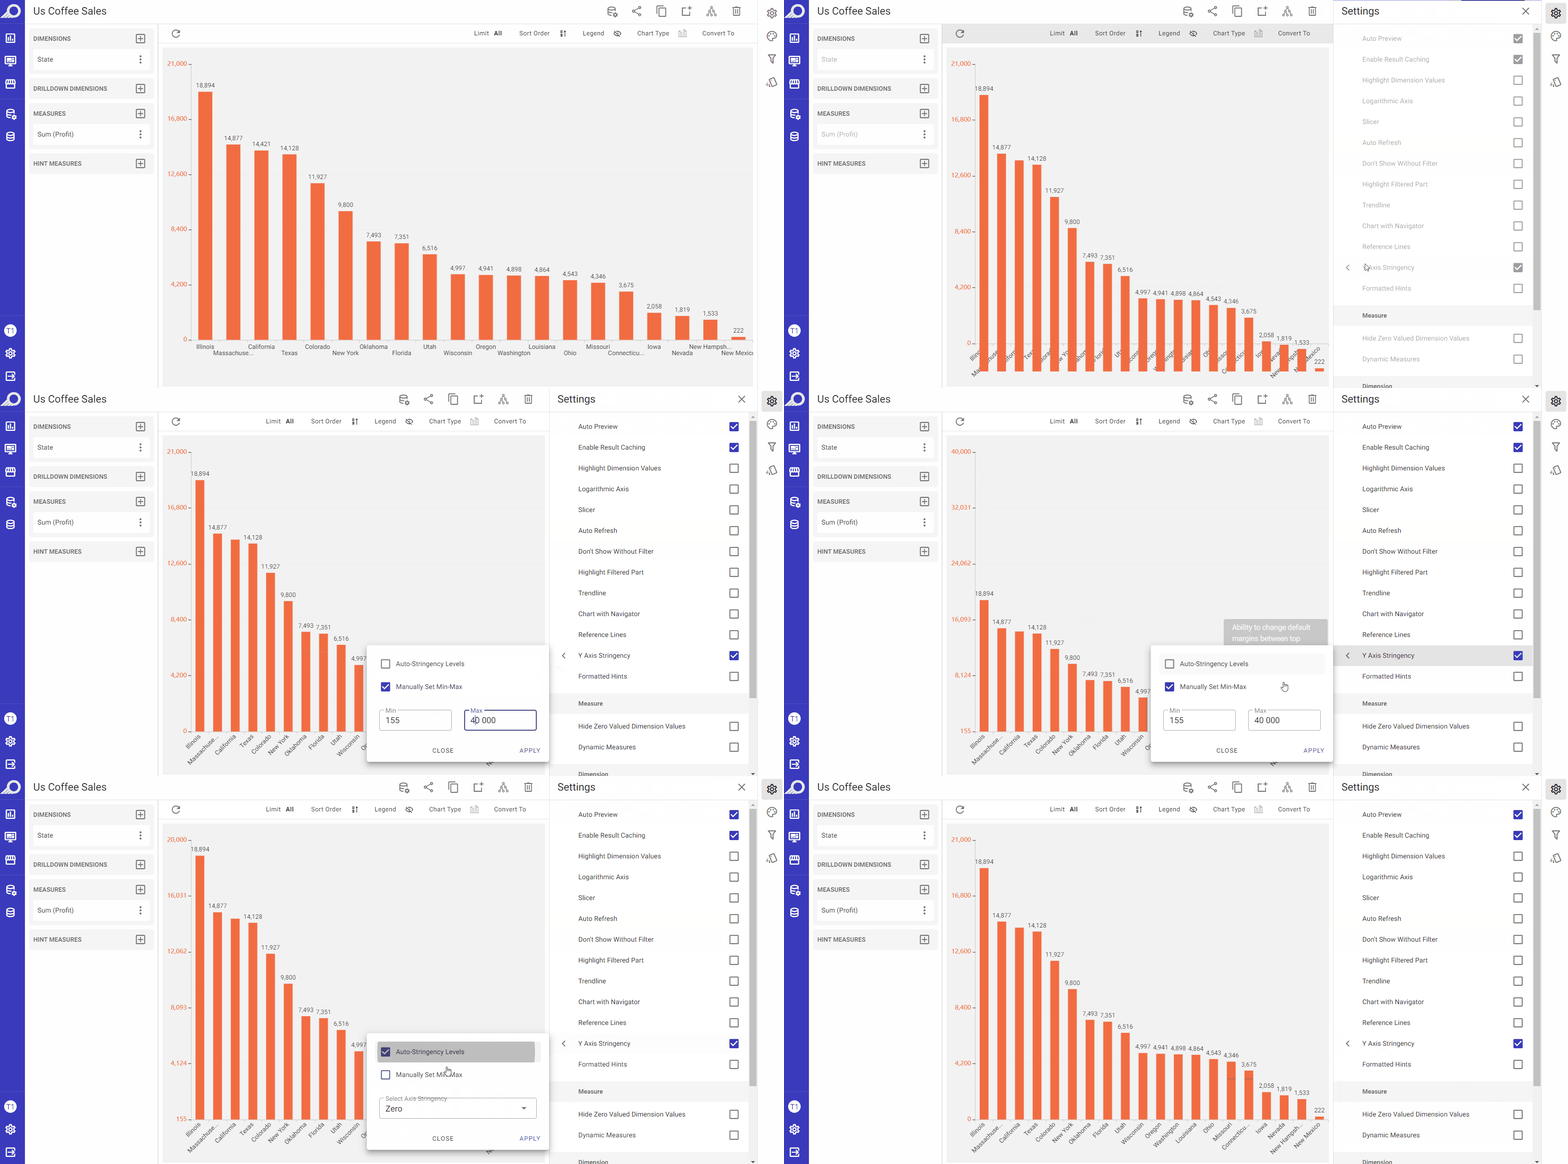
Y Axis Stringency
This feature is available for chart types where the values are plotted on axes only. When enabled by checking its check box, it allows changing the default vertical margin between the top positions of the bars or columns in a chart. The stringency levels are automatically determined in “Auto-Stingency Levels” and the user can “Manually Set Min-Max” levels. Additionally, Axis Stringency can be selected from “Zero, Stringent or Loose”. These options likely determine the degree of compression or expansion of the chart data along the vertical axis, as for example, “Loose” option can be used to accentuate minor differences as the vertical margins between the bars or columns will be expanded, resulting in a chart that appears less compressed, which can make it easier for viewers to distinguish between values that are close together and identify small differences between them.
Hide Zero Valued Dimension Values
When the “Hide Zero Valued Dimension Values” check box is checked, any values for the selected dimension in the dashlet that contain zero values will be eliminated.
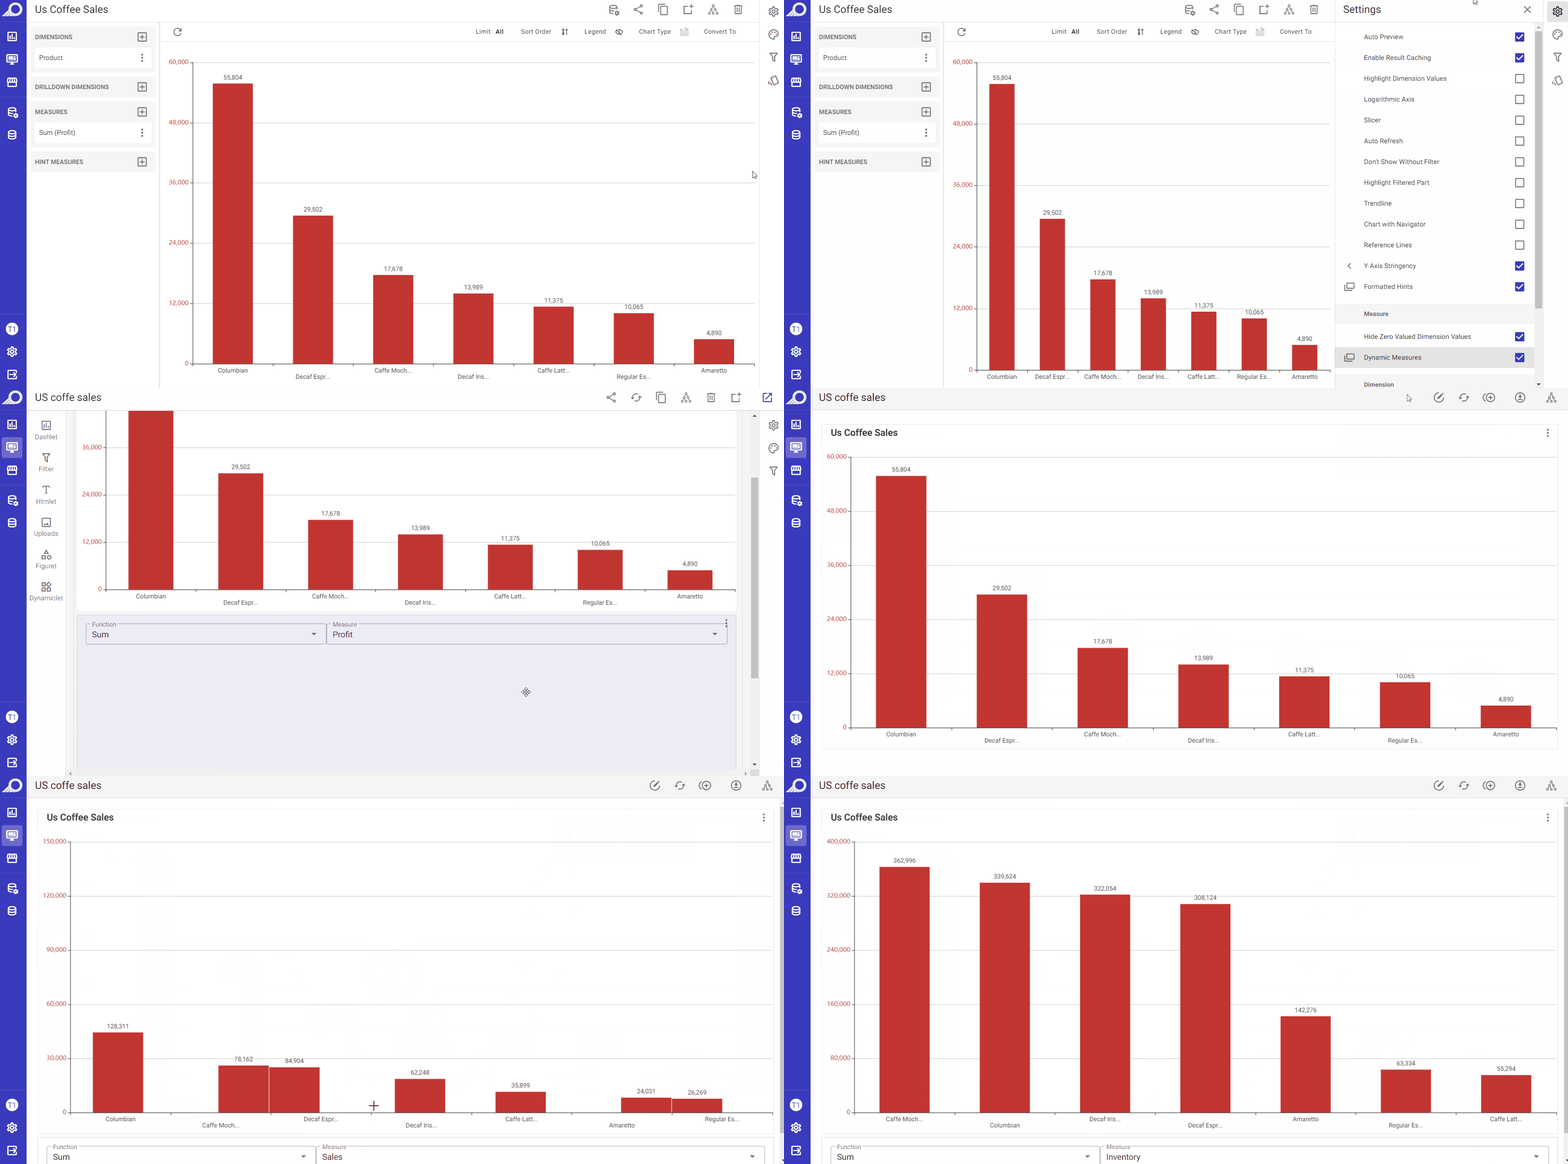
Dynamic Measures
When the “Dynamic Measures” check box is enabled, any measure can be assigned as a “Dynamic Measure” in the overlay window that opens. The effect of this feature is applied on the dashboard level. When the dashlet is added to a dashboard, those dynamic measures will be shown at the dashboard and the data displayed on the dashlets of that dashboard can be changed by selecting one of those added dynamic measures. This allows dashboard users to change the measures on the dashboard on the fly, without having to manually update the dashlet/s structure. It allows them to easily add and switch between different measures within a dashboard, providing greater flexibility and control over the displayed data.
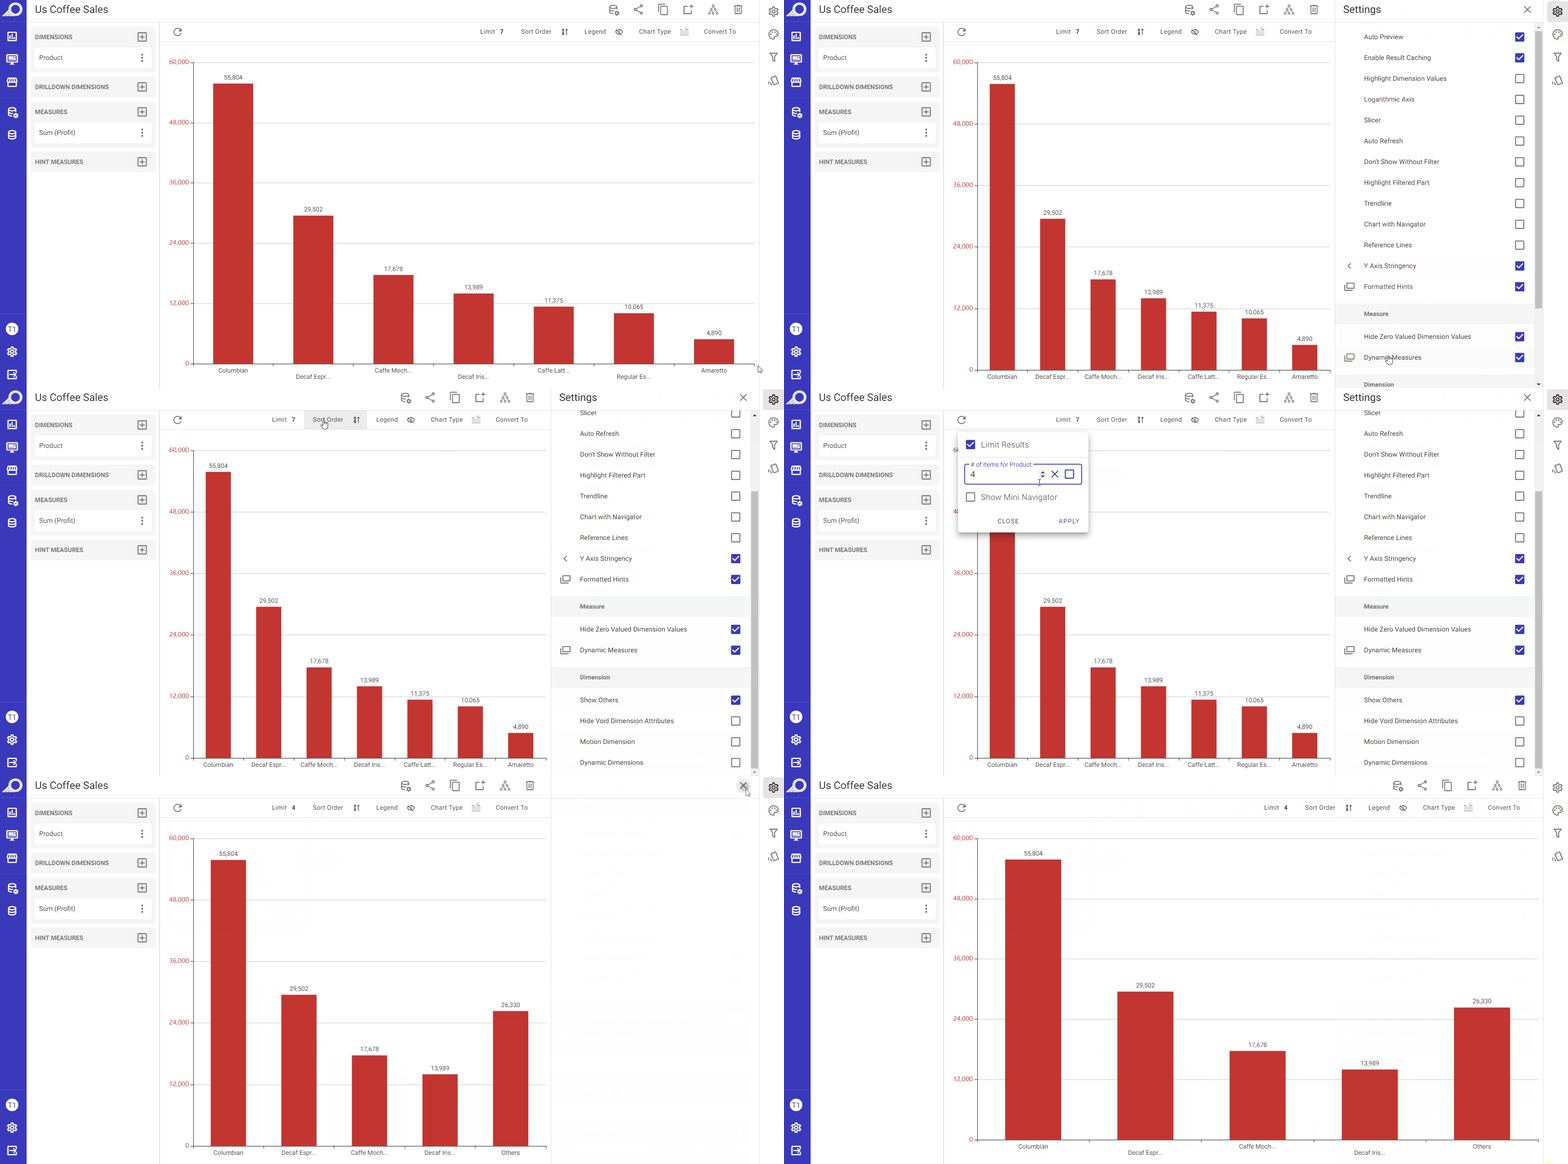
Show Others
When the “Show Others” check box is enabled, it will show the measure figure for the dimension attributes except those selected in Limit results section and the result will be grouped as one data point namely “Others”.
Hide Void Dimension Attributes
When the “Hide Void Dimension Attributes” check box is enabled, any data cells in the dashlet that have empty dimension values will not be shown.
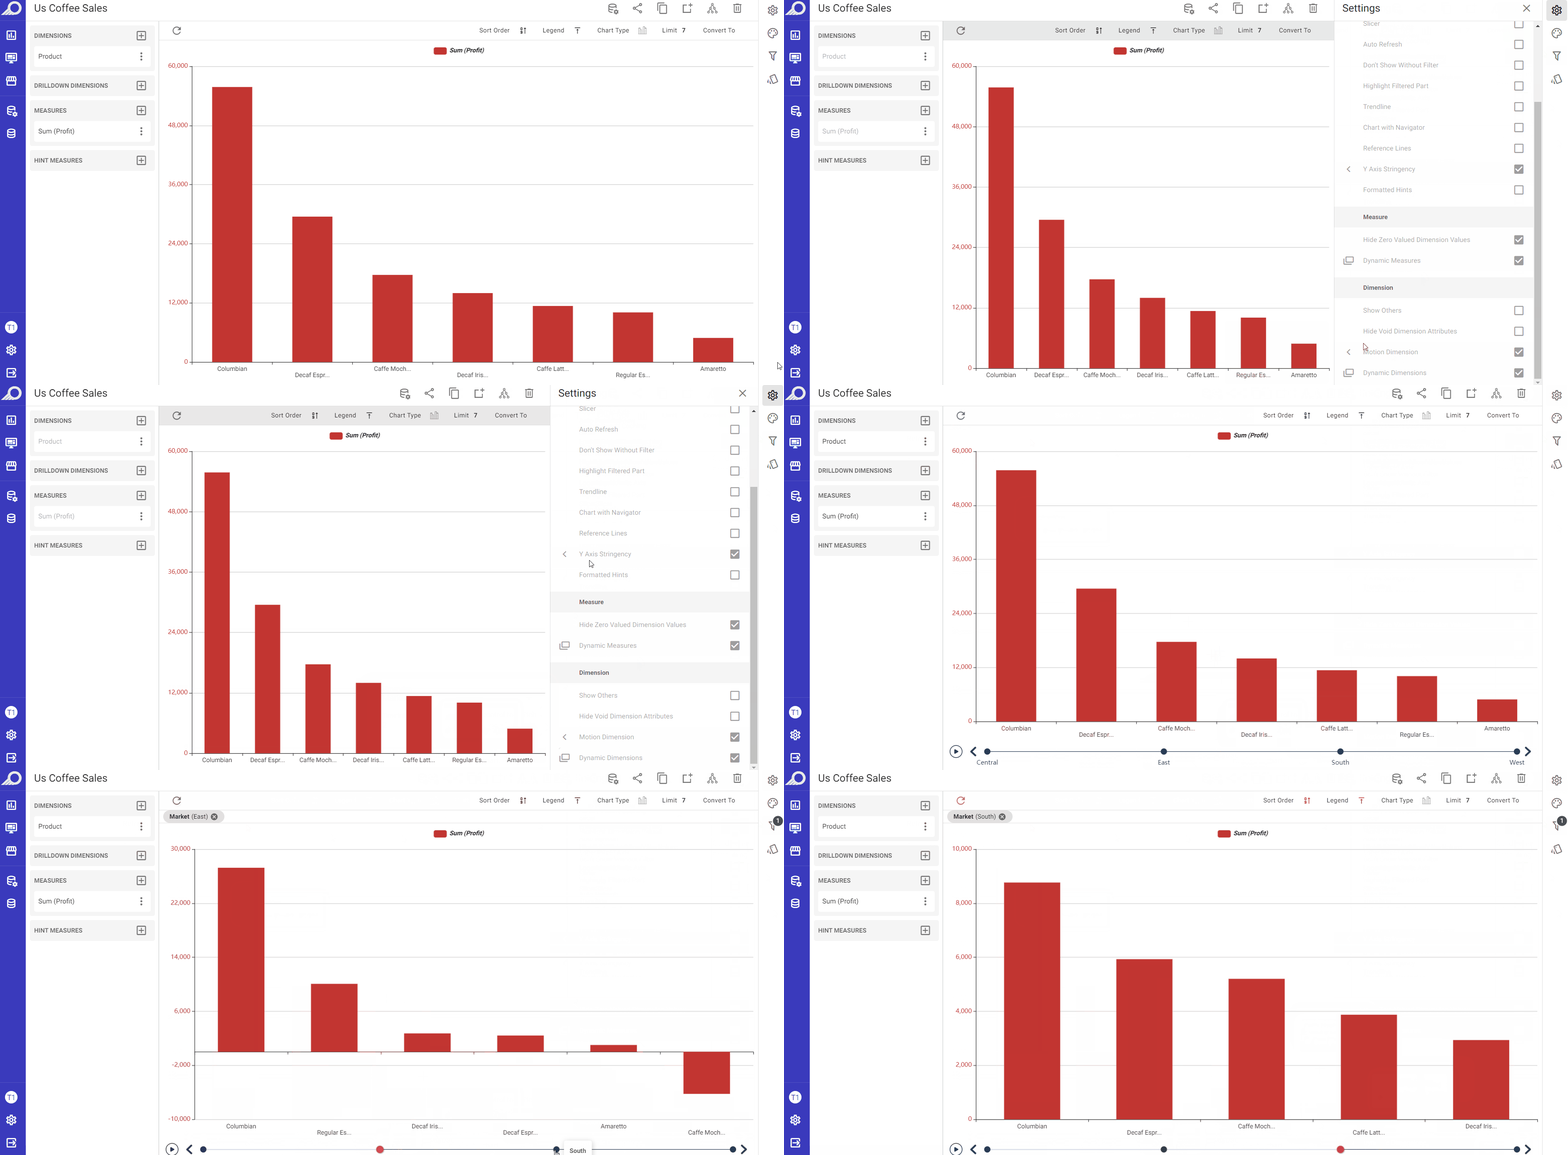
Motion Dimension
When the “Motion Dimension” check box is enabled, a control can be added to switch between dimension attributes. When the user clicks on the Play button in the control area, motion is added to the dashlet. This means that the dashlet will animate the changes in the dimension attribute over the selected attribute and according to the set “Time Interval”, allowing the user to see the data in a more dynamic and interactive way.
Dynamic Dimensions
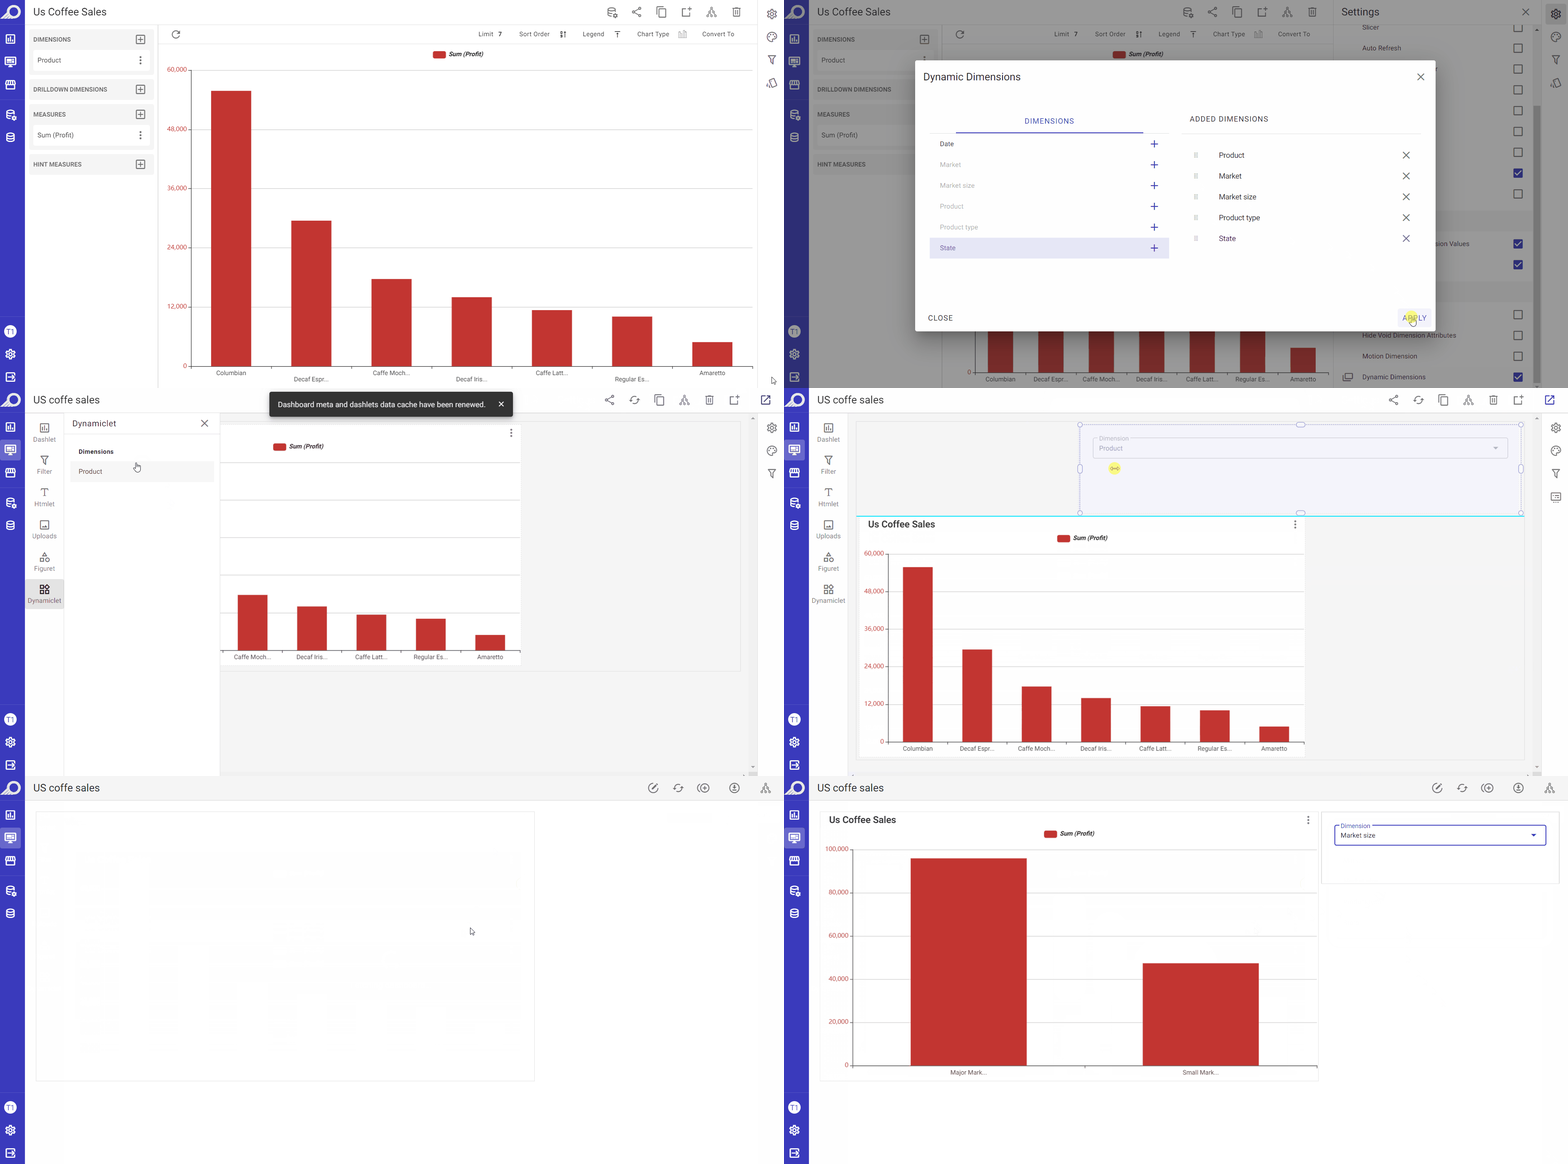
When the “Dynamic Dimensions” check box is enabled, any dimension can be assigned as a “Dynamic Dimension” in the overlay window that opens. The effect of this feature is applied on the dashboard level. When the dashlet is added to a dashboard, those dynamic dimensions will be shown at the dashboard and the data displayed on the dashlets of that dashboard can be changed by selecting one of those added dynamic dimensions. This allows dashboard users to change the dimensions on the dashboard on the fly, without having to manually update the dashlet/s structure. It allows them to easily add and switch between different dimensions within a dashboard, providing greater flexibility and control over the displayed data.
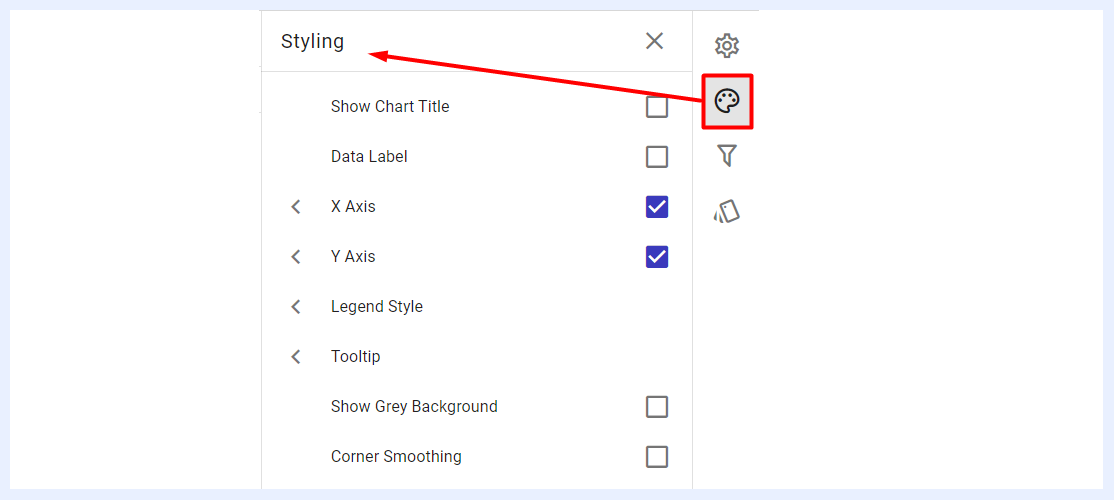
Styling Panel
The styling and appearance of chart dashlets can be customized to suit the preferences of the designer. By default, chart dashlets follow the styles and themes of TURBOARD, but users can modify them using the available options.
These customization settings can enhance the visual appeal, legibility, and accessibility of the chart, making it easier for users to comprehend and analyze the data presented. It can also highlight specific information or organize data in a way that facilitates comprehension. Custom colors and styles can also be utilized to reinforce brand identity and ensure that the dashboard has a consistent and professional appearance.
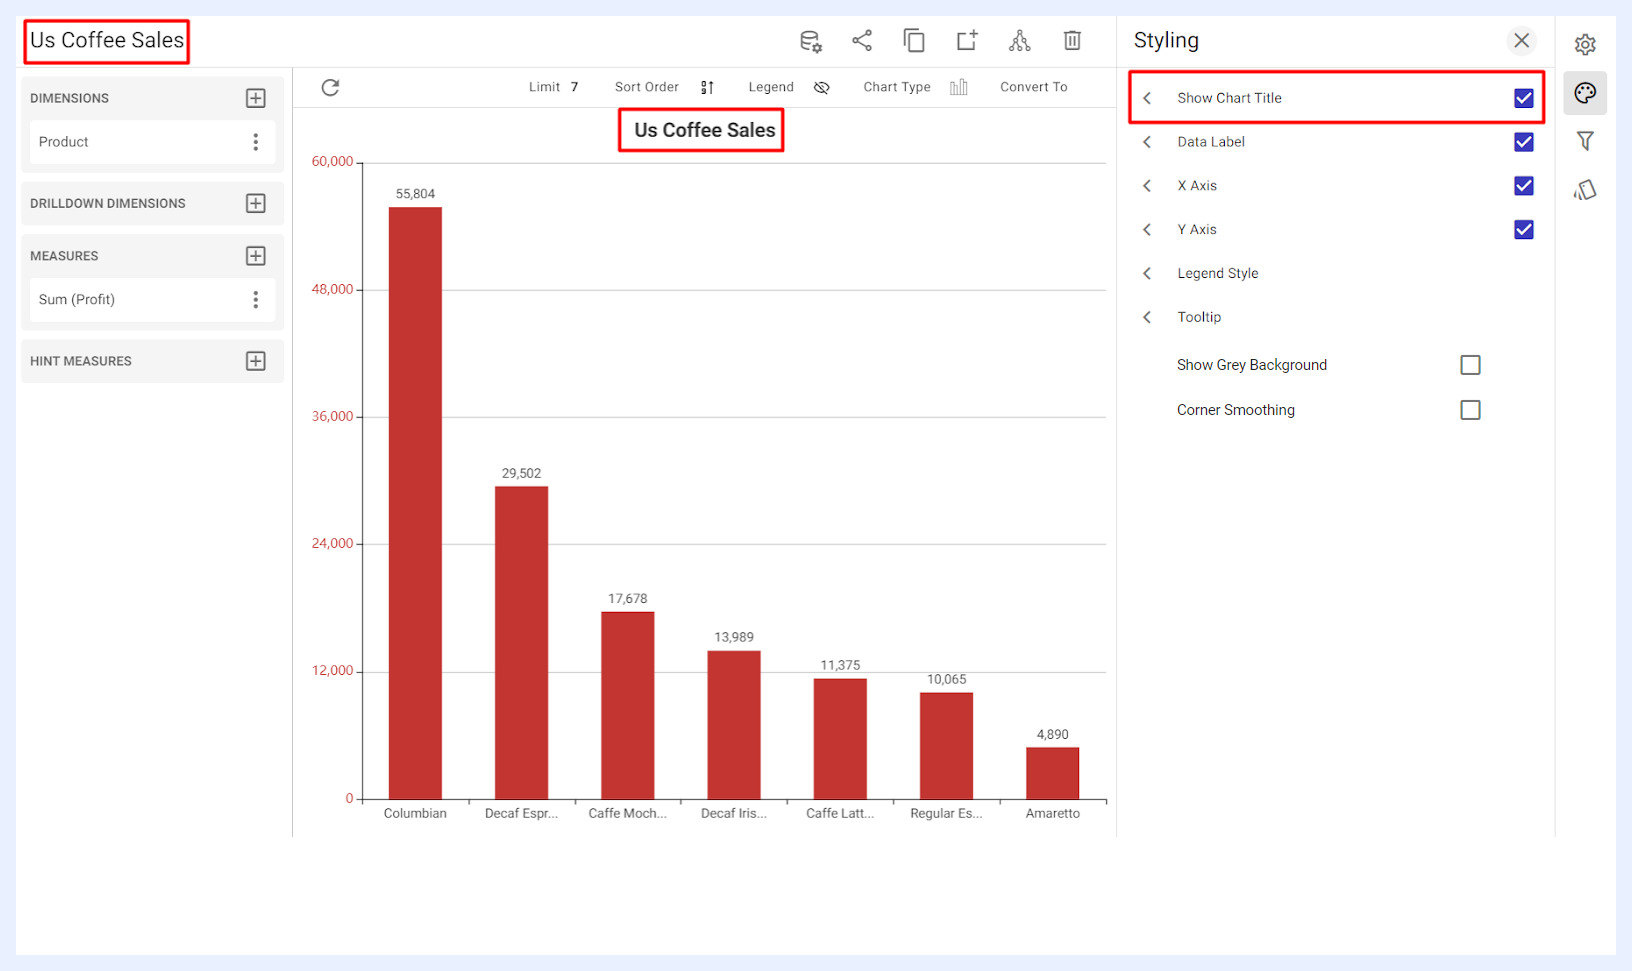
Show Chart Title: when enabled by checking its check box, the dashlet name will be displayed at the center-top of the chart in which the user can adjust its formatting and styling including the font type, size, style (bold and/or italic) and color as desired.
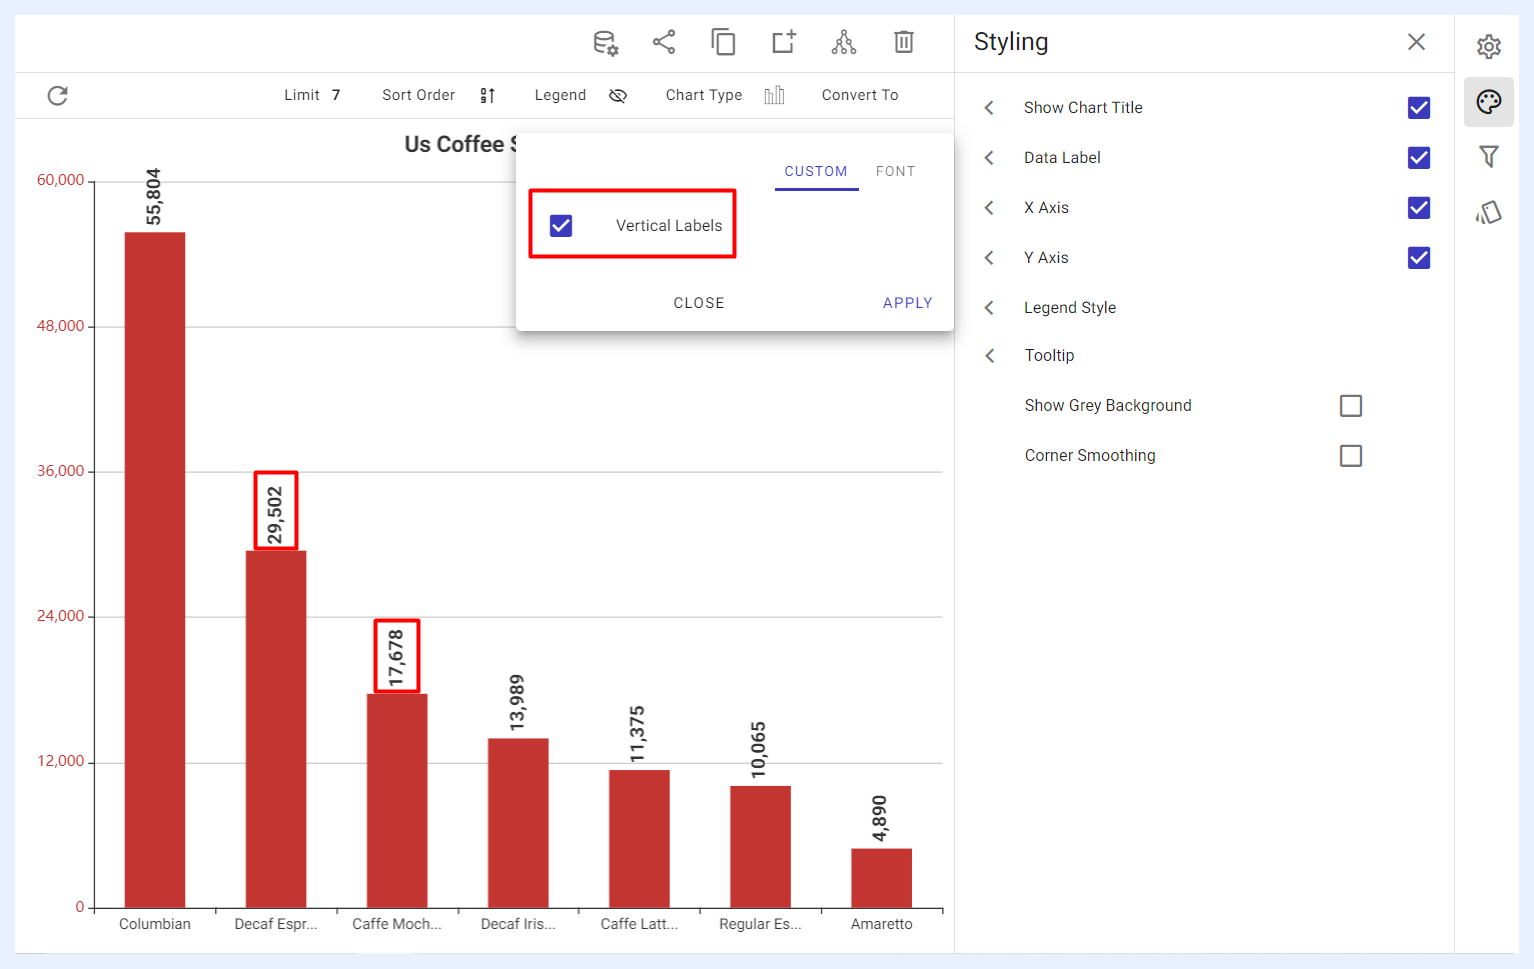
Data Label: when enabled by checking its check box, the user can adjust the labels on the chart in terms of their text alignment (horizontal or vertical), font type, size, style (bold and/or italic) and color.
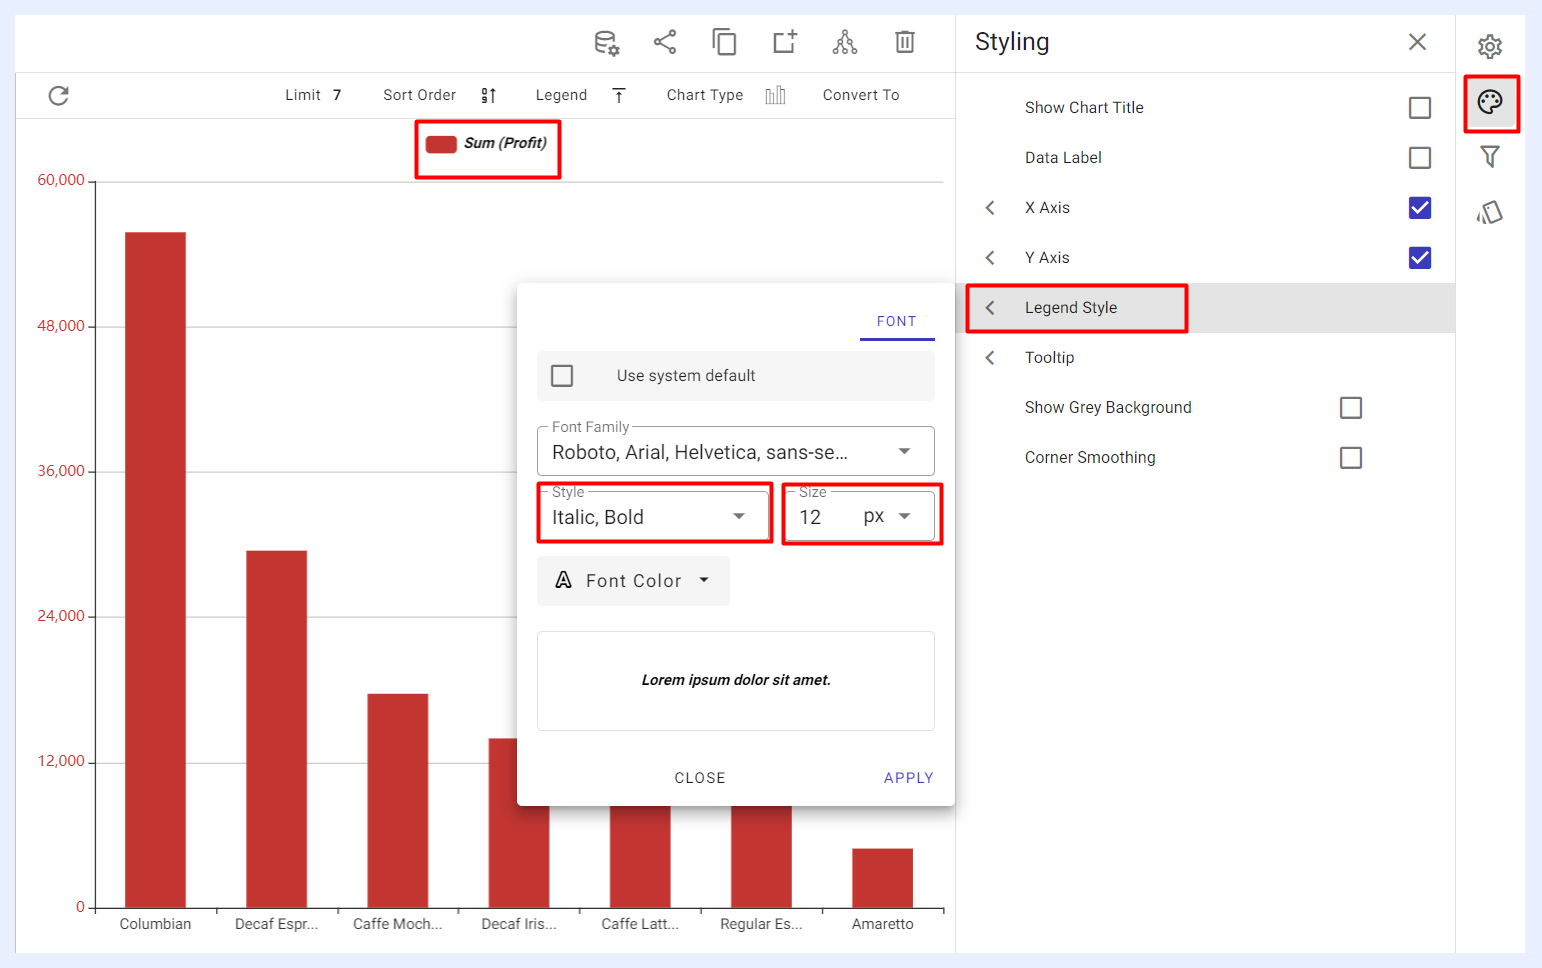
Legend Style: when enabled by checking its check box, it allows the user to customize the texts describing the legend if it was displayed on the chart. The user can adjust the font type, size, style (bold and/or italic) and color of the legend texts.
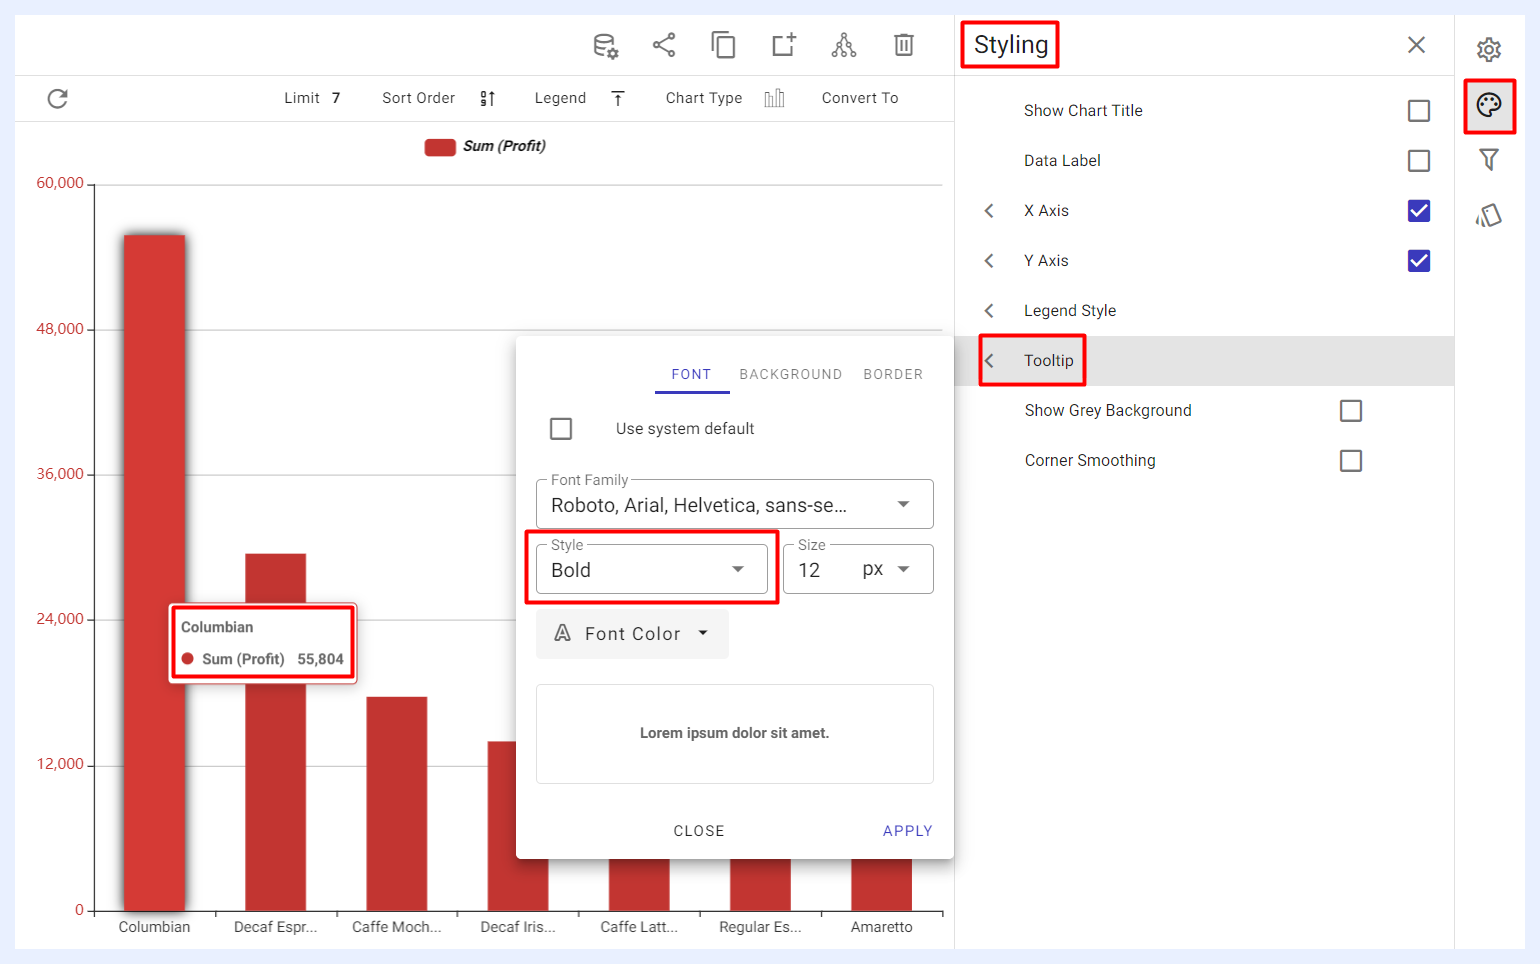
Tooltip: when enabled by checking its check box, it allows the user to customize the appearance of the tooltips that are displayed when hovering over the elements of the chart. The user can adjust the font, background, and border colors, as well as the overall style of the tooltips according to his/her preferences. For Bar, Column, and Area charts, a Cursor Line can also be enabled — a dynamic visual indicator that follows the cursor and connects hovered data points to their axes. The pointer type (Line, Shadow, or Cross) and styling controls (opacity, color, width, and line pattern) are configurable.
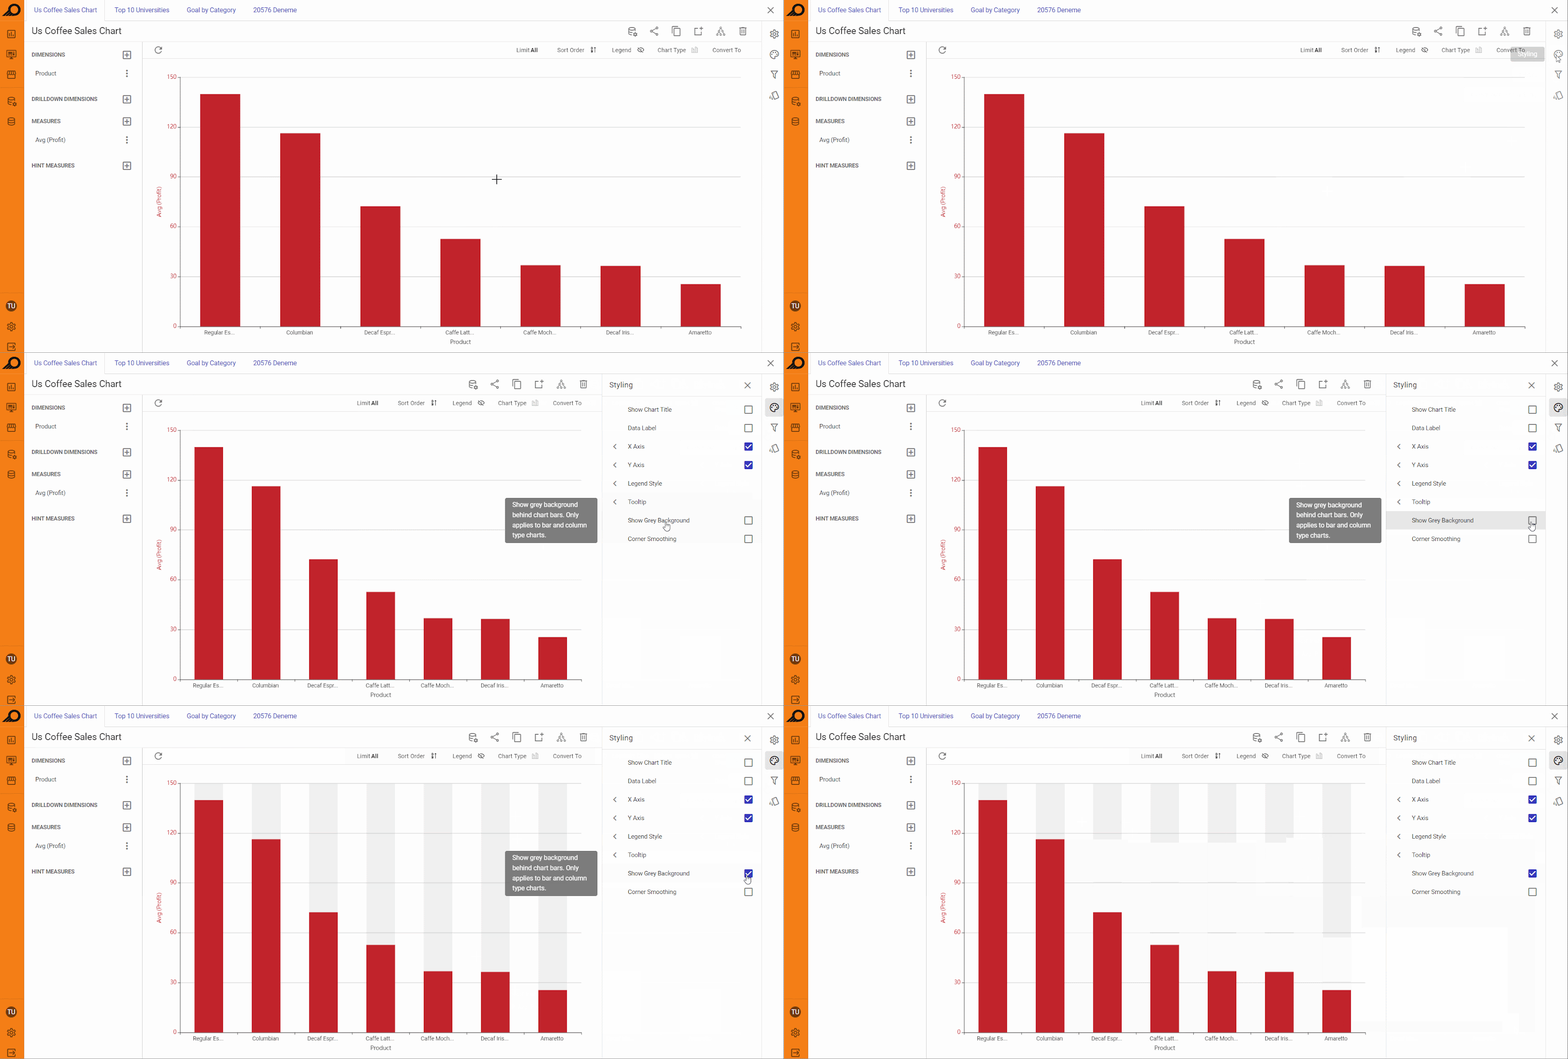
Show Grey Background: when enabled, this option adds a radiant grey background behind the bars or columns, enhancing the visual contrast for bar or column charts.
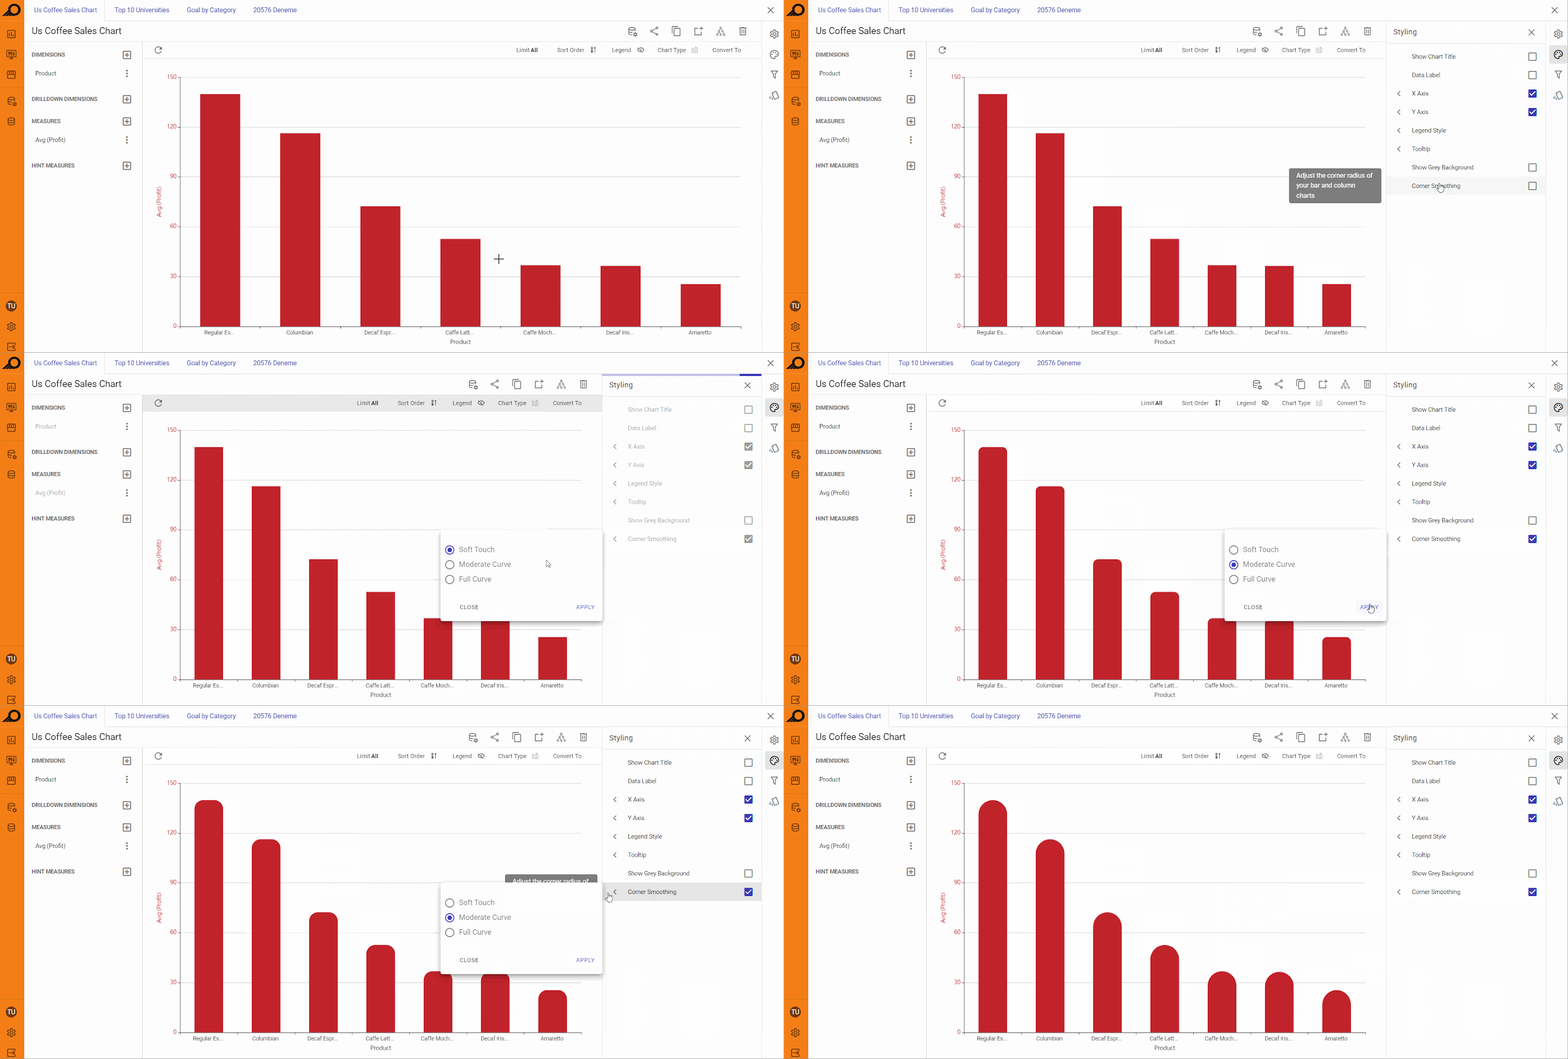
Corner Smoothing: when enabled, this option softens the corners of bars or columns in the chart. The designer can choose between three levels of smoothing (Soft Touch, Moderate Curve, or Full Curve) to control the roundedness of the corners.
Other Styling Options
The styling options available for a chart may vary depending on the type of chart and its visualization elements. For example, chart types that use axes (such as Bar, Column, Area, and Line charts) provide users with the ability to customize the aesthetics and styles of the X and Y axes by enabling corresponding feature check boxes. This includes options to show or hide the axis name, adjust font size, style and colors, and customize the appearance of axis labels.
In contrast, chart types such as Pie charts provide users with options to customize the aesthetics and styles of the pie area, rather than axes. Similarly, Polar charts or Multilayered Donut charts provide users with the ability to customize the polar axis, including options to adjust its styling and appearance.
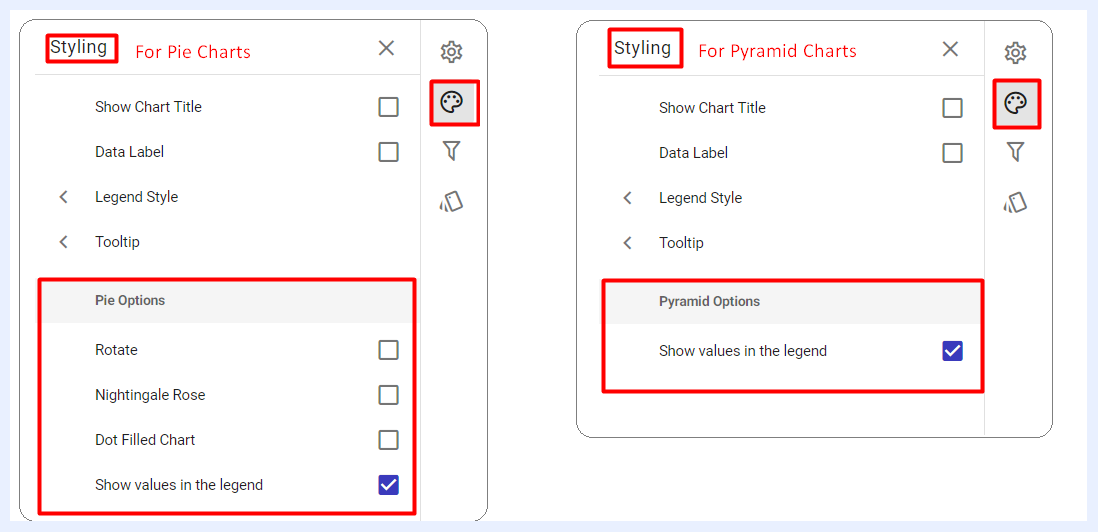
Samples of the Different Styling Options According to Chart Type
Filters Panel
“Filters” panel contains all the nodes that were assigned as filters in the related view. The user can configure the settings of any selected filter as in this link.
Conditional Formatting Settings
Conditional formatting is used to easily highlight certain values in the dashlet or make particular values easy to identify. End-users will easily notice the difference between the visualized values using this feature.
Color Scales: a gradient of up to three colors can be applied across chart values for instant visual analysis. Color scales work across Column, Bar, Pie, and Donut charts. An interactive legend allows users to highlight or filter by color band. Custom conditional formatting rules override the color scale when both are applied.
The user can either change the default formatting (font, color, icon) on a whole measure(s) level, or according to specific thresholds and intervals determined for a selected measure(s).
In the second case, the visual appearance of the measure (text colors, background colors, icons) changes automatically for the data cells that contain values which meet those thresholds.
Formatting Options
When adding conditional formatting, users can access several formatting tabs in the pop-up window, each corresponding to different customization areas: COLOR, ICON, and LABEL. By unticking the system default checkbox for any tab, additional options become available for customizing the formatting based on the minimum and maximum values set for the selected measure or dimension.
- COLOR Tab: adjust the colors of the measures or dimensions to visually highlight specific ranges.
- ICON Tab: select or upload an icon, decide its placement (e.g., at the top of a column or on the axis), choose if it should repeat, set its color, and clip it if it exceeds the space.
- LABEL Tab: opt to hide or display data labels for values that meet the defined conditions.
These tabs allow precise control over how data is presented based on the conditions applied, helping to visually emphasize key data points.
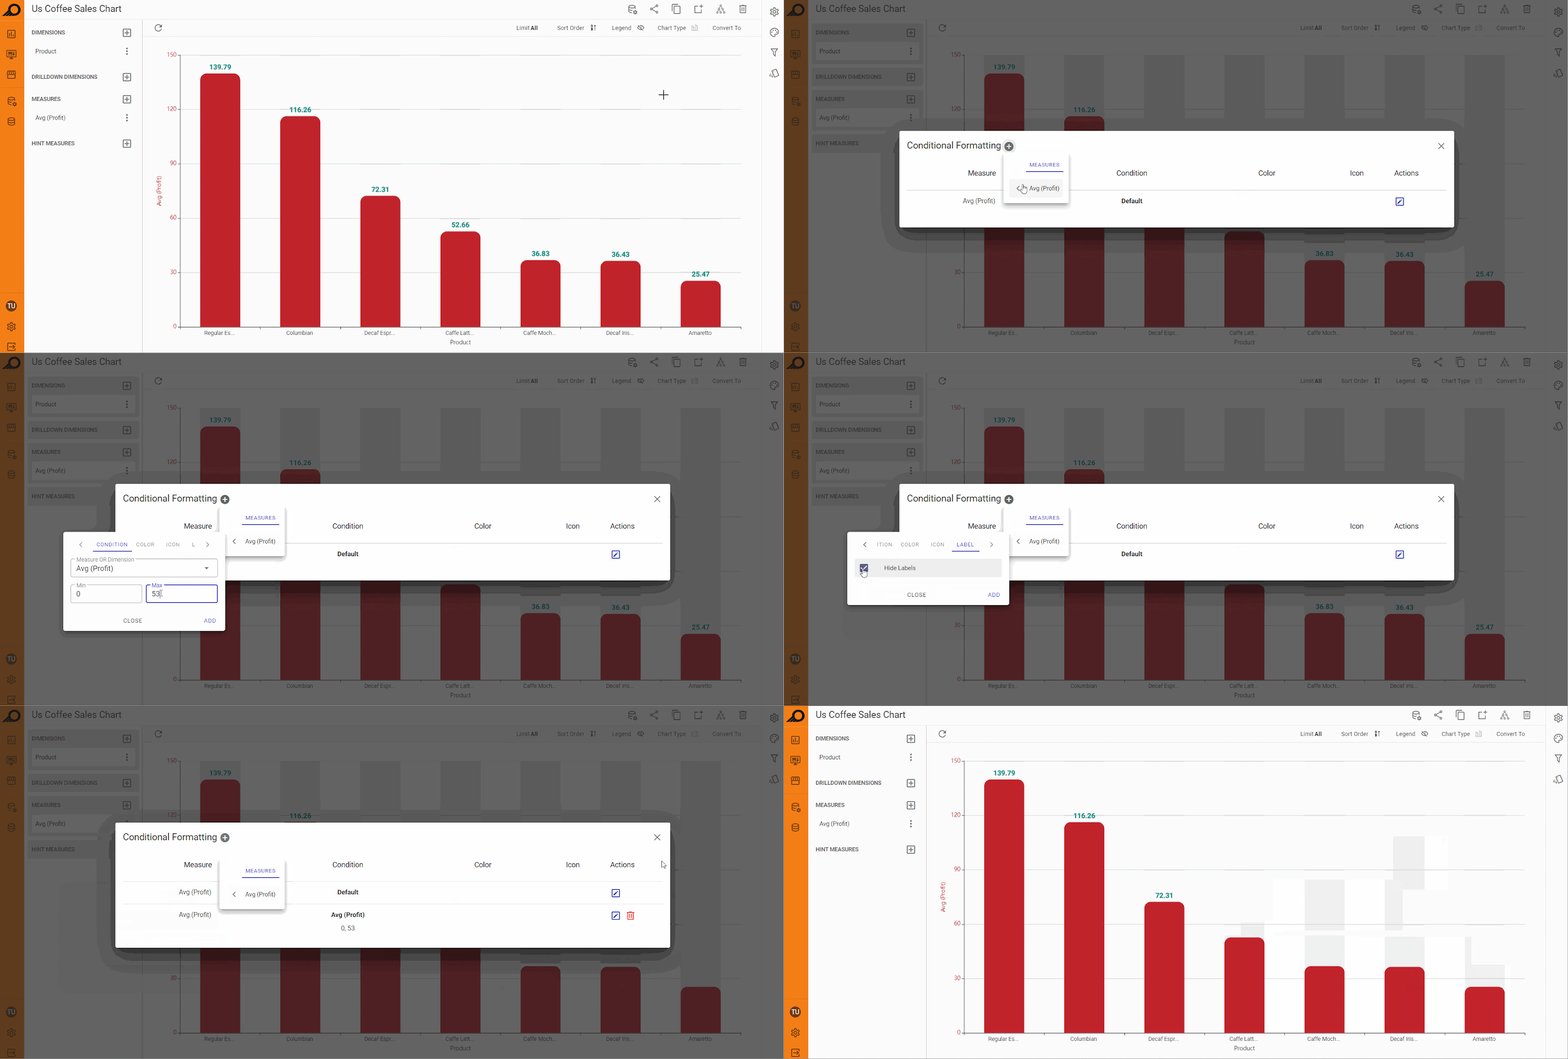
Applying Conditional Formatting on a Chart Dashlet
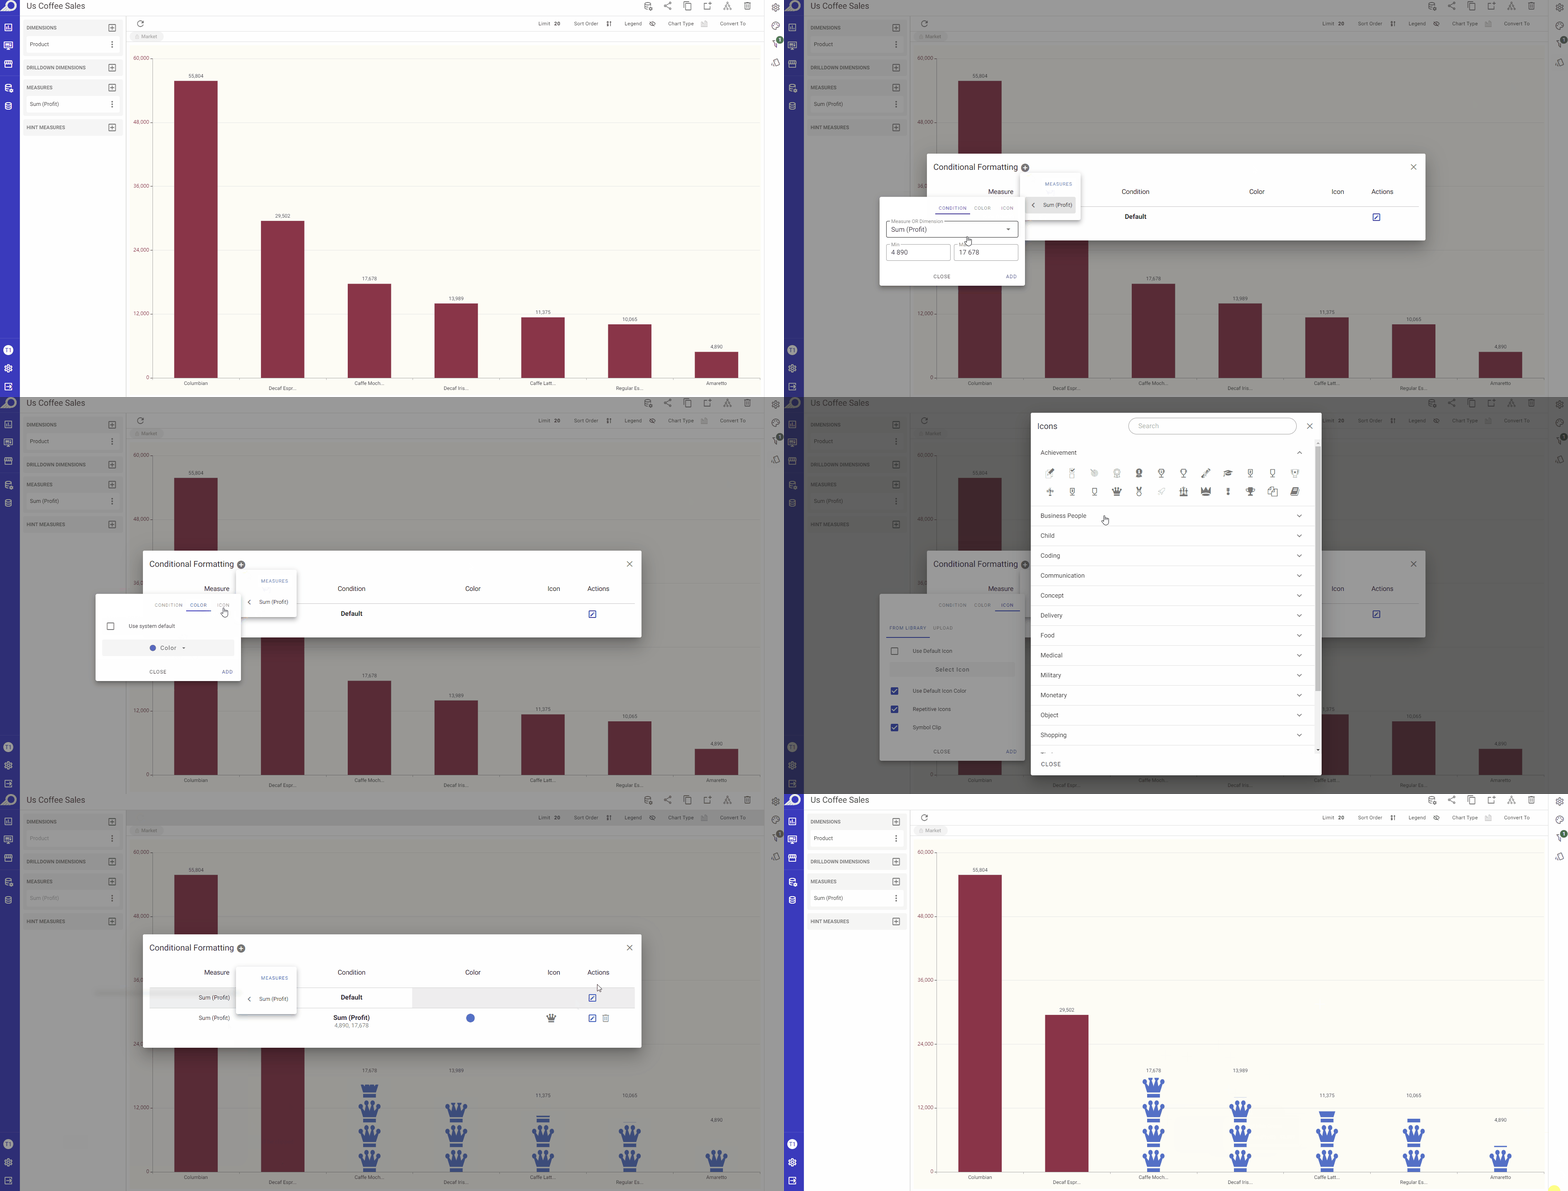
How to apply conditional formatting on a chart dashlet?
1 Click “Conditional Formatting” icon from the configuration panel at the right.
2 In the overlay window that appears, click + icon next to “Conditional Formatting” window title.
3 Select the required measure and determine its threshold (“Min” and “Max” value ranges), determine your preferred colors, icons and fonts.
4 Click ADD button.