System
System Status
This section is a performance monitor (also called a system monitor) for TURBOARD platform. It provides updated information on TURBOARD’s performance and resource utilization metrics for the system’s hardware and software.
The upper section of the window is a display-only where the information and the parameters it displays can be refreshed by clicking Reload Parameters icon at the right-top corner.
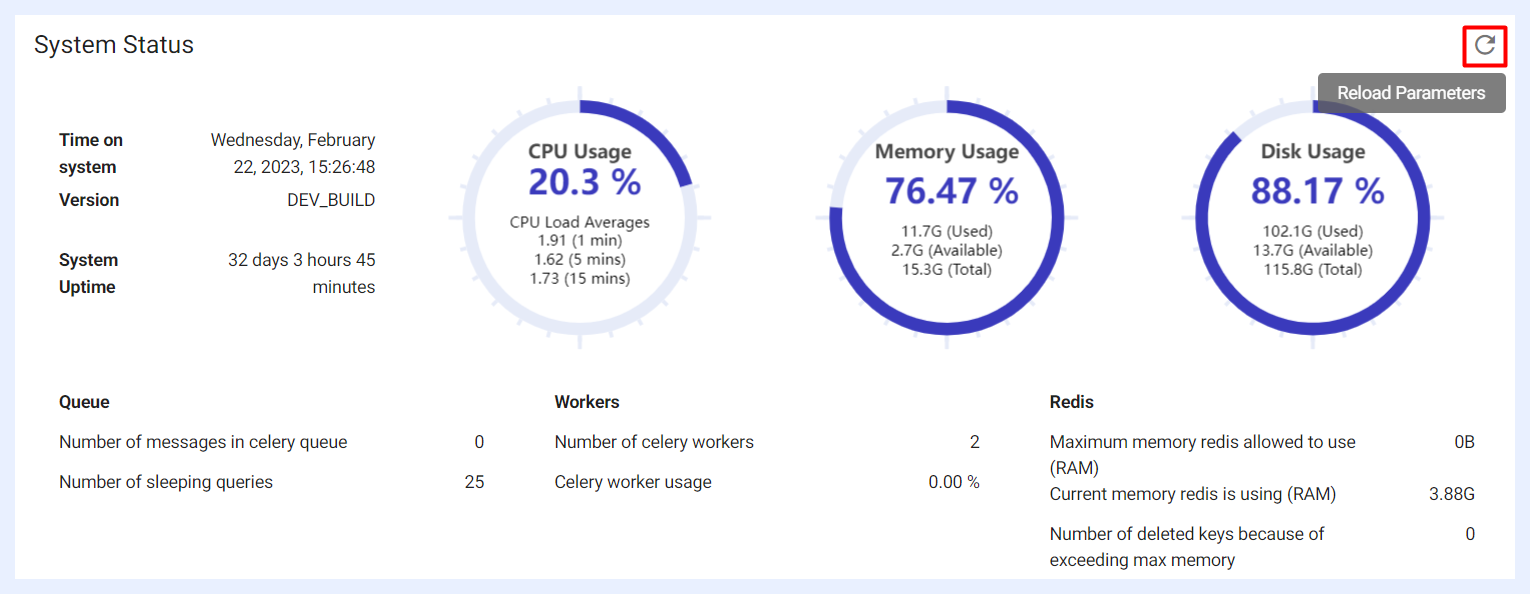
Time on system: shows the last time that the displayed information was refreshed and fetched from TURBOARD’s DB.
Version: TURBOARD’s release name/number.
System Uptime: displays the length of time that TURBOARD has been available and operational (continuously running without any interruptions) since it was last started or rebooted.
CPU Usage: indicates the amount of processing power being used by TURBOARD at the given “Time on System”.
Memory Usage: indicates the amount of system memory being used by TURBOARD and its processes at the given “Time on System”.
Disk Usage: indicates the amount of storage space being used on TURBOARD’s hard drive at the given “Time on System”.
Queue details: displays the total number of tasks that are waiting to be processed by the Celery workers, and the total number of database queries that are in a "sleeping" state at the given “Time on System”.
Celery Workers details: displays the number of the background processes that run and execute tasks and return the results back to TURBOARD at the given “Time on System”.
Redis details: displays the maximum amount of memory that Redis is allowed to use for caching data in RAM, the actual amount of memory that Redis is currently using for caching data in RAM, and the number of cache keys that have been deleted from the Redis cache due to exceeding the maximum memory limit.
Monitoring such metrics and parameters by the system administrator(s) is crucial for optimizing TURBOARD system performance, troubleshooting issues, planning for storage capacity and resources, and minimizing downtime and disruptions to its operations.
Terminal Commands Section
“System Screen” and “Run Command” sections at the lower part of the window provide access to the application's command line interface (CLI). It allows a direct connection to TURBAORD’s “Terminal Command Prompt” to enable performing/running useful commands as below.
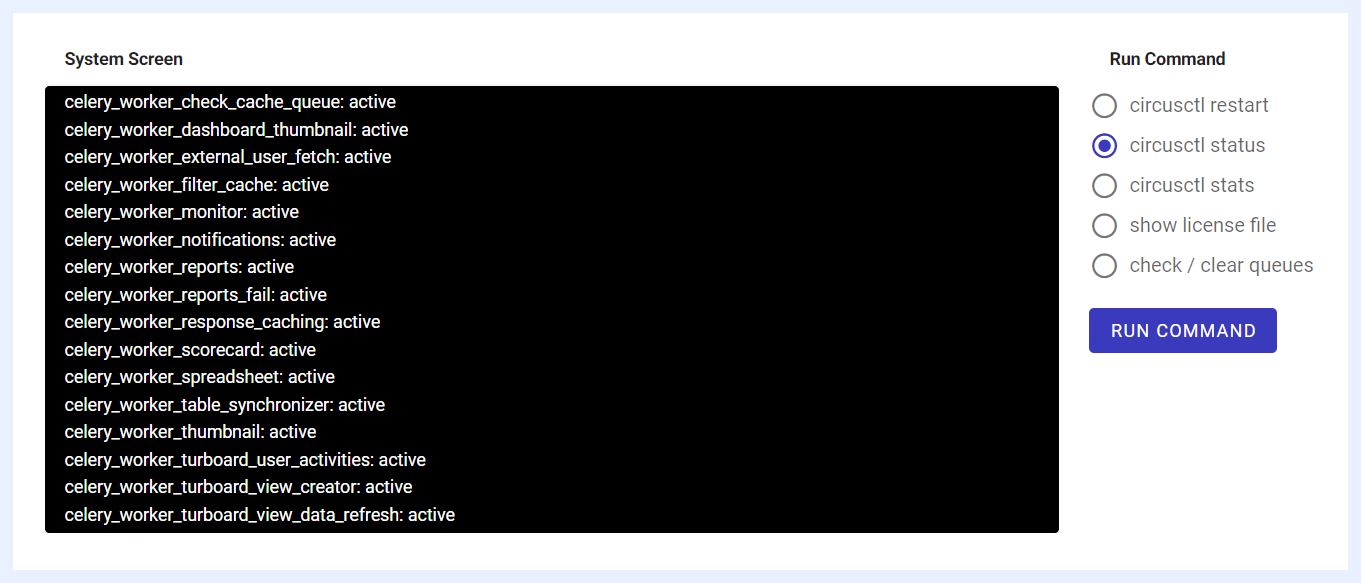
1 Select the command that you want to run in the Circus process manager through the CLI (Command Line Interface) from the available options (radio buttons):
circusctl restart: if run, it will stop all the managed processes, and then start them again. This can be useful when you need to make changes to the configuration of the managed processes or if they are experiencing issues that require a restart. However, this command shall be used with caution as restarting the processes may cause a few seconds’ temporary disruptions or downtime for TURBOARD users.
circusctl status: if run, it will return information about the current state of TURBOARD managed processes, the status of the Circus process manager itself, resource usage, and any log output that is being generated. This command can be useful for troubleshooting issues and to monitor the system performance.
circusctl stats: if run, it will display real-time statistics about the managed processes in Circus process manager that can be useful for monitoring the performance of TURBOARD processes and identifying potential issues.
show license file: if run, it will display the license file associated with your TURBOARD environment including the license agreement, contents, terms and conditions, validity period, users’ types and count, available features and configurations, etc. This command helps you review your license agreement and follow it up before its expiry for example.
check / clear queues: if selected and run, this command will first check for any tasks that are pending in the queue and not being processed. If there are tasks that have been stuck or pending for an extended period, this command will attempt to clear them from the queue to ensure smooth operation. This can help in resolving bottlenecks in task processing and preventing delays in system operations. Use this function to maintain optimal flow of tasks and to preemptively manage any queue-related issues that might affect TURBOARD's performance.
2 Click RUN COMMAND button.
3 The command will run automatically and will return results on the “System Screen” at the left side.
Licensing
This section is used to install your TURBOARD license. As a Super Admin user, you can upload the TURBOARD license file with “.lic” extension from your computer and perform the license installation process in a few steps.
The license file will be sent to you by our support team once the license is purchased so its features and functionalities will be unlocked and applied to your TURBOARD environment.
1 Go to Administration > System > Licensing.
2 Click the Upload option and upload the license file. Note that the file upload dialog box will allow uploading the correct file type, i.e. license files with “.lic” extension only.
3 Once the correct license file is selected (a turboard.lic file) and Open is clicked, TURBOARD will automatically detect the license file and APPLY button will be activated accordingly.

4 Click APPLY button. The content of the uploaded file and the details of your license will be displayed under “License Info”.
5 TURBOARD will restart automatically in the background so that the license functionalities and features will be applied shortly after.
Logs
A log is a record of events and activities that occur while working on TURBOARD. Log files are generated automatically by TURBOARD system, and they contain information and diagnostic data that are valuable to the system administrators, TURBOARD developers, and the support team.
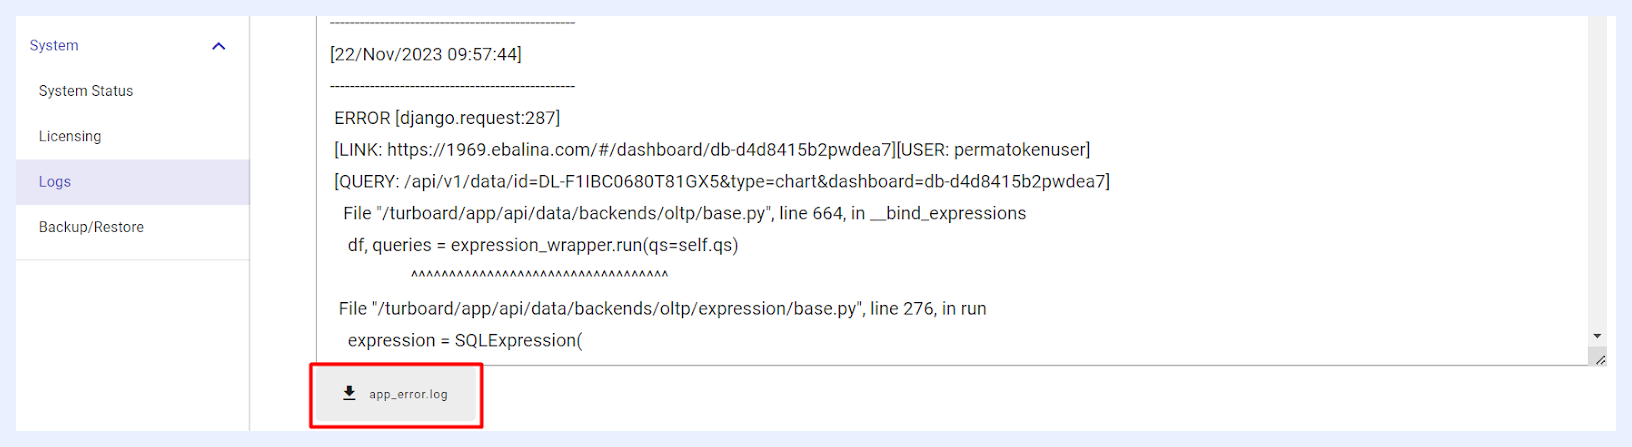
A dropdown list at the top of the window allows for the selection of different log types. By default, “app_error” is pre-selected and displayed upon opening the window.
Alongside each log type in the dropdown, the last updated date and time are shown, giving a quick reference to the freshness of the data.
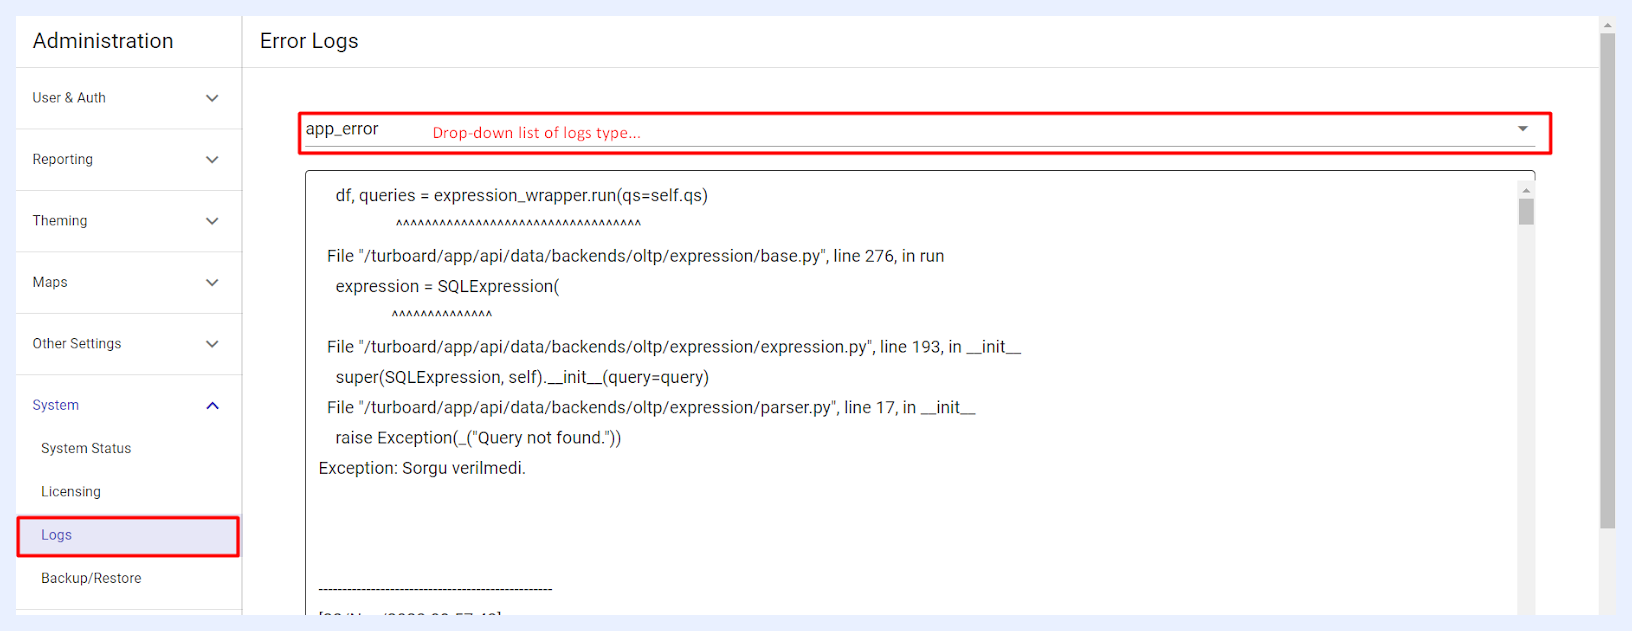
Each log type can be downloaded as a text file (.txt) using the corresponding download button labeled with the log type located at the bottom of the window. This facilitates offline analysis or sharing with TURBOARD support team when needed.
Log Types Explained
In the Logs section of TURBOARD, a variety of log types are meticulously recorded, serving as key instruments for system monitoring and troubleshooting. These logs capture a wide range of operations from backend automated query executions and administrative tasks such as data backups to user-centric activities including notifications, report generation, and the automated creation of spreadsheets from visualizations.
Below, some of these log types are further explained, detailing their specific functions and importance.
Error Logs
-
app_error: This log type records application errors, providing stack traces and code references to help identify and diagnose issues swiftly. It includes timestamps, user information, and specific error messages like “Redis is loading the dataset in memory”, which are crucial for quick and effective problem resolution within TURBOARD.
-
slow_query: This log captures queries that exceed a predefined execution time threshold, highlighting potential inefficiencies. By reviewing these logs, administrators and developers can identify slow-running queries and optimize them for better performance, ultimately enhancing TURBOARD's overall speed and efficiency.
-
interface_server_error: The log reflects a series of warnings and errors related to database operations, file handling, and authorization issues in the web application.
-
turboard_user_activities_error: This log type chronicles the scheduled indexing tasks of user activities on TURBOARD, marking the beginning and conclusion of bulk data processing. With precise timestamps, it provides a regular, hourly record of indexing, crucial for maintaining an organized and searchable system of user interactions. These logs serve as a confirmation of the system's diligent refresh of user activity data.
-
celery_beat_error: This log type captures errors encountered within the task scheduling component of TURBOARD, specifically within its use of Celery Beat. The logs include issues such as database integrity errors where certain expected values are null, and connectivity problems with Redis, a key-value store used for task queuing. The entries indicate attempts to reconnect to Redis, with retry counts and intervals specified, highlighting the resilience mechanisms in place to handle such disruptions. These logs are vital for identifying and resolving backend scheduling and data consistency issues.
-
response_cache_renew_error: This log captures various warnings and errors related to the response caching mechanism within TURBOARD, indicating issues such as significant time drifts between services suggesting possible clock synchronization problems, and multiple connectivity issues with Redis—a key-value database that supports caching operations. There are also warnings against using DEBUG settings in production due to memory leaks and notices of failed attempts to load invalid JSON from the database. These logs are critical for maintaining operational integrity and performance of backend services and for ensuring data consistency.
-
external_user_fetch_error: This log type details the process and potential issues encountered during the retrieval and management of user data from external sources into TURBOARD. It includes timestamped warnings about the completion of data fetching, user processing, insertion of restrictions, and the clearing and adding of users to groups. It also records the time taken for each step, highlighting any errors such as old restrictions removal and total time for the fetch process, which is critical for diagnosing issues in data synchronization and integration workflows.
-
view_data_refresh_error: This log type captures errors associated with attempts to refresh view data within TURBOARD. The entries contain error notifications at various timestamps, indicating that specific “View” or “ViewDataRefreshTask” objects are not found in the database. These errors point to issues with the existence of certain records expected during the data refresh tasks. The logs detail the traceback of the errors, showing the function calls leading to the exceptions, which can be instrumental in tracing and resolving the underlying issues related to data retrieval or integrity in the system's operational flow.
Informative & Monitoring Logs
-
response_cache_renew_info: This log tracks the performance of the caching system within TURBOARD, documenting each attempt to cache data and whether any changes occurred. It shows the precise times when caching processes start and complete, and if there were any updates or no changes to the cached data. Regular entries with “No changes” indicate stable data, while entries with “Caching started” and “Caching finished” reflect active updates. This log is useful for monitoring the efficiency of the caching system and ensuring data freshness.
-
turboard_user_activities_info: This log type chronicles bulk operations involving user activities on TURBOARD servers. It logs successful HTTP POST requests to a server endpoint, indicated by a 200 status code, and notes the response time for each operation. These logs are essential for tracking the efficiency and speed of bulk data transactions related to user activities within TURBOARD.
-
celery_worker_filter_cache_info: These logs detail the caching activities performed by TURBOARD's background workers, specifically related to filter restrictions. Each log entry marks the commencement and completion of the caching process for different filter identifiers. The logs ensure that filters are being cached correctly for efficient retrieval, which is crucial for performance optimization when applying these filters to data queries or user access controls. These entries are a testament to the system's ongoing operations to maintain up-to-date and accessible data filtering mechanisms.
Backup/Restore
The Backup/Restore page provides system administrators with the essential tools to create, manage, and restore system snapshots. This ensures that your TURBOARD configurations, internal databases, and custom file assets are safely archived and can be instantly recovered in the event of system migration or data recovery.
Taking a New Backup
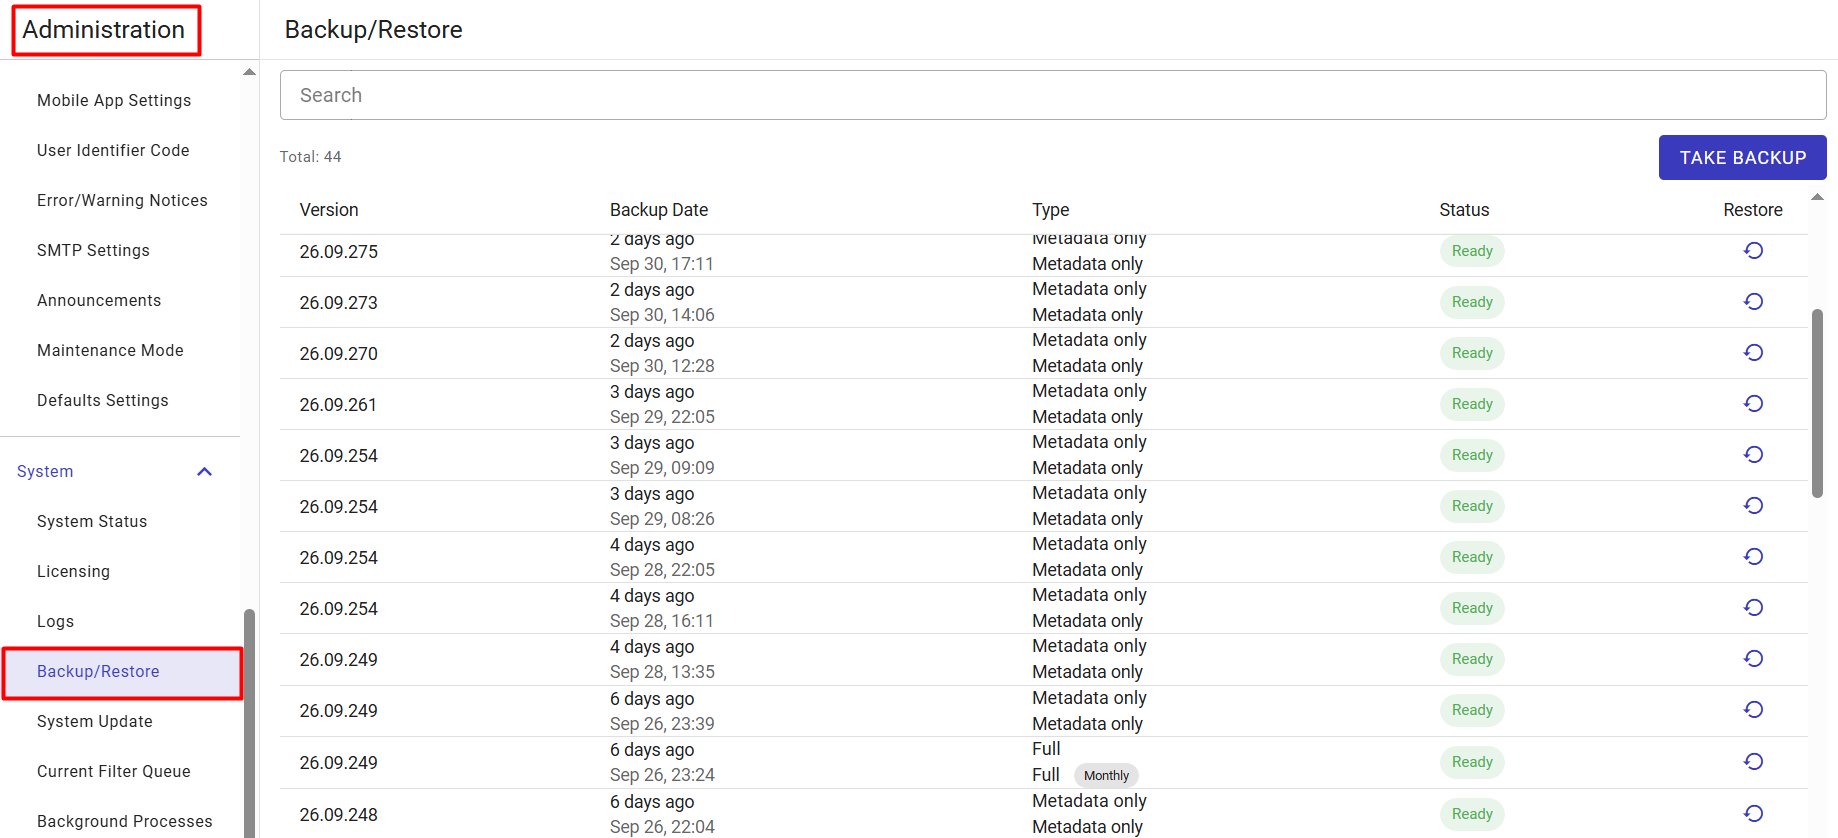
1 Go to Administration > System > Backup/Restore.
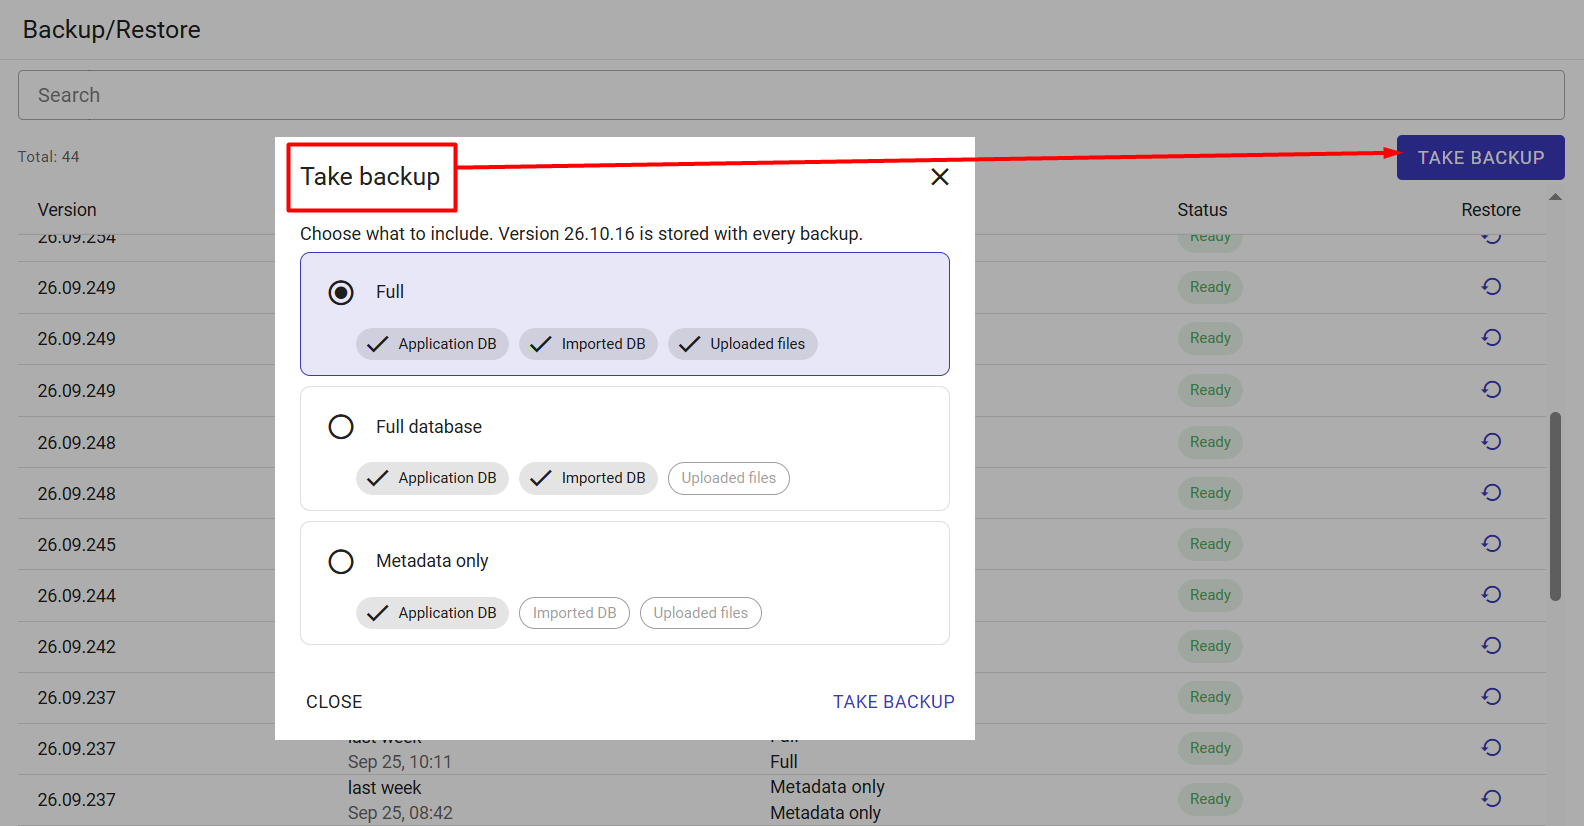
2 Click the TAKE BACKUP button located at the top right of the screen.
3 In the Take backup modal window, choose the specific data scope to include in your backup archive. The current TURBOARD platform version (e.g., 26.10.16) is automatically stamped and stored with every backup. Select one of the following backup types:
- Full: Creates a complete system archive. Includes the Application DB (system metadata, user settings, permissions, dashboard layouts), the Imported DB (any data tables imported directly into TURBOARD's internal storage), and all Uploaded files (custom logos, SVG maps, images, and HTML assets).
- Full database: Backs up only the internal databases (Application DB and Imported DB). Uploaded file assets are intentionally excluded to keep the backup size manageable.
- Metadata only: Creates a highly compressed, lightweight backup containing only the Application DB. This captures your platform's structural design (views, queries, dashlet configurations, users) without saving the actual imported data or uploaded files.
4 Click the TAKE BACKUP button at the bottom right of the modal to initiate the background archiving process.
5 The modal will close, and the new backup will appear at the top of the inventory grid. The Status column will display a spinning Backing up badge. Because backups run asynchronously, you can safely navigate away from this page. Once completed, the status will update to Ready.
Where are backups stored?
TURBOARD stores these snapshots securely on the server itself. You do not need to download or manage external database files on your local computer. When you need to roll back, the archives are immediately available for a one-click restore directly from this grid.
Restoring a System Backup
1 Review the list of available backups in the main inventory grid. The table displays the TURBOARD Version running when the backup was taken, the exact Backup Date, the data Type (e.g., Metadata only, Full), and its current Status (e.g., Ready).
2 Use the Search input bar at the top to quickly filter the archive list by version number or date string.
3 To restore the platform to a previous state, locate the desired historical backup row and click the circular arrow icon in the Restore column on the far right.
4 Confirm the execution when prompted. The system will overwrite current configurations with the archived data and restore your TURBOARD environment to that exact operational state.
System Update
The System Update page allows administrators to seamlessly check for, apply, and audit TURBOARD platform version upgrades directly from the web interface.
Checking and Applying Updates
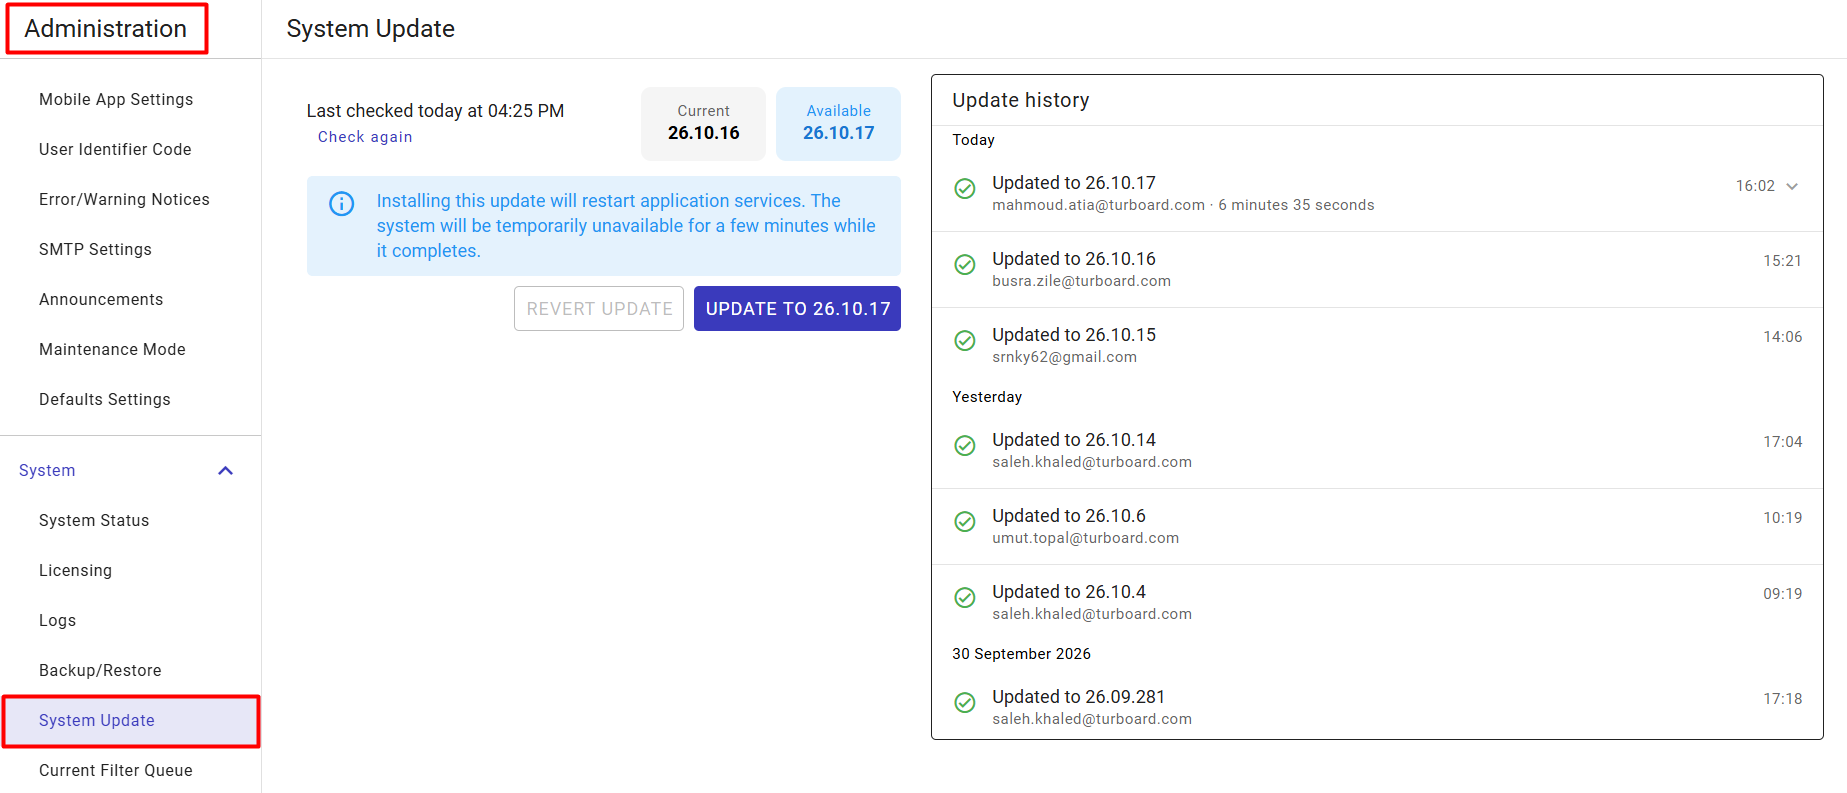
1 Go to Administration > System > System Update.
2 Review the status panel on the left. The system displays the Last checked timestamp alongside two version badges:
-
Current: The TURBOARD version currently running on your server (e.g.,
26.10.16). -
Available: The latest stable release available for installation (e.g.,
26.10.17).
3 If you want to force the system to ping the release server for a newer version, click the blue Check again link.
4 To initiate an upgrade, click the solid blue UPDATE TO [Version] button.
Important
Installing a system update will automatically restart the application services in the background. TURBOARD will be temporarily unavailable to all users for a few minutes while the upgrade compiles and completes.
Reverting an Update
If an unexpected issue occurs following an upgrade, administrators can roll the system back to the previous version.
- If a rollback is available, the
REVERT UPDATEbutton will become active. Clicking it will restore the system binaries to the immediately preceding version.
Auditing the Update History
The right side of the screen features an Update history log, which provides a chronological audit trail of all platform updates.
-
It tracks the exact version installed, the date and time of completion, the email address of the administrator who triggered the update, and the duration of the installation process (e.g.,
6 minutes 35 seconds). -
You can click the dropdown arrow (
v) next to a recent update to view expanded diagnostic logs for that specific installation.
Current Filter Queue
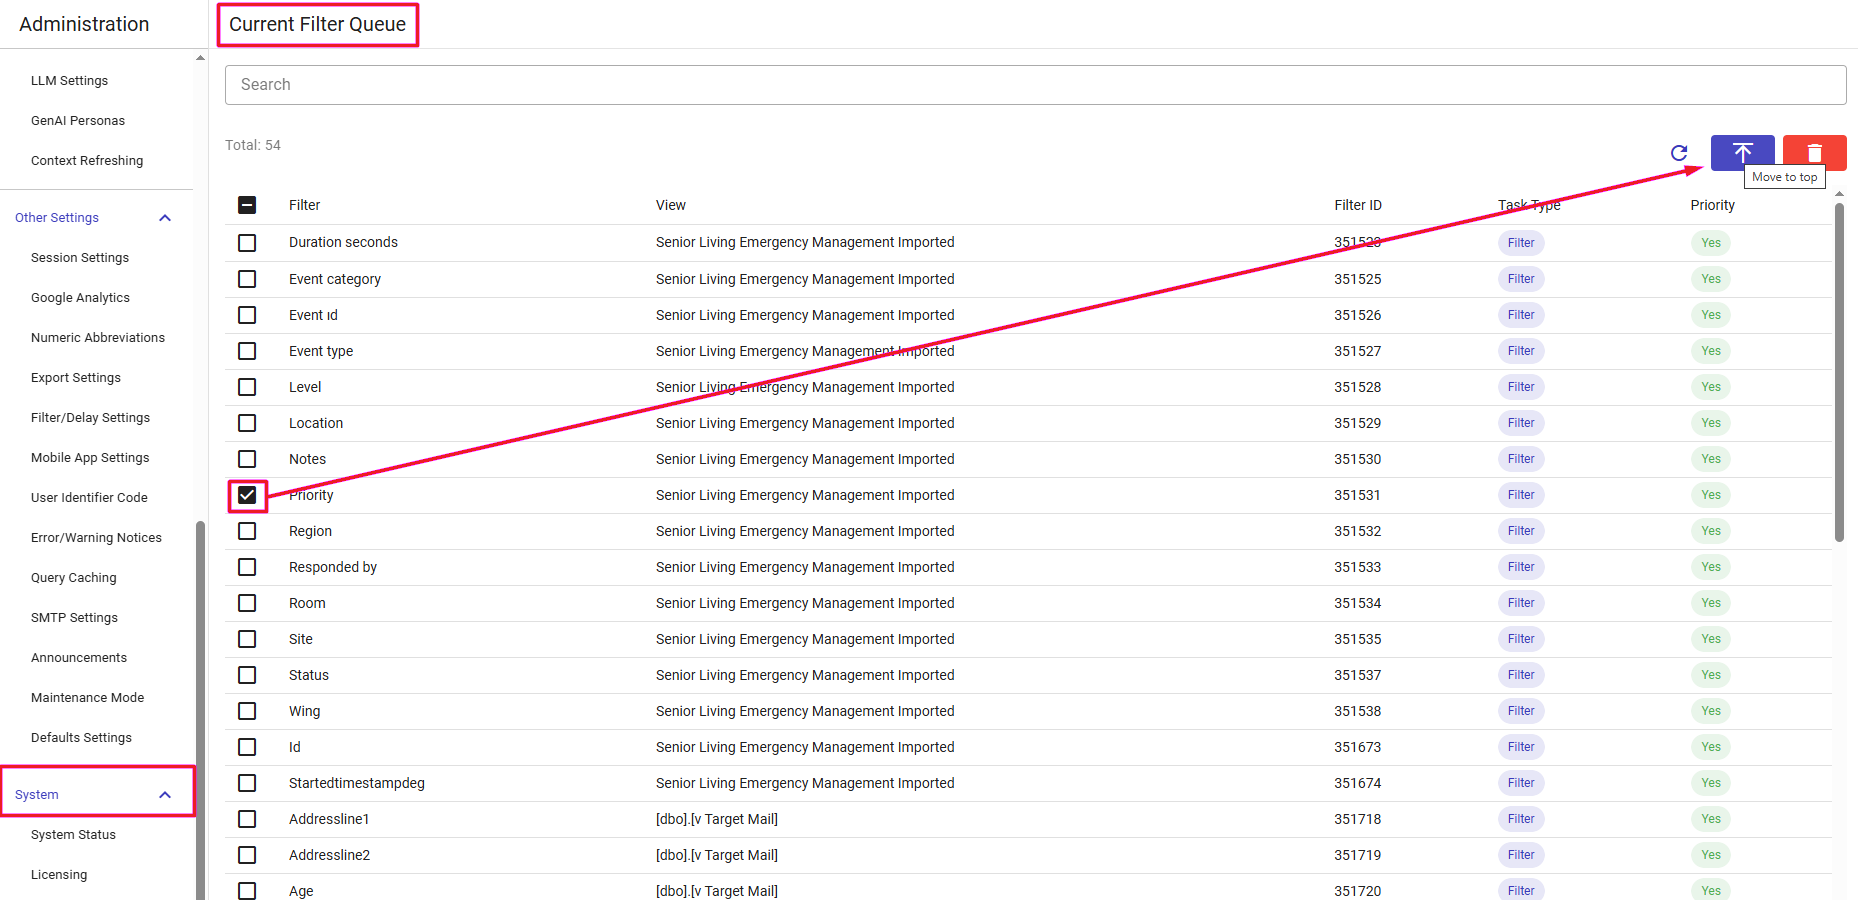
The Current Filter Queue page provides administrators with granular visibility and operational control over pending filter cache tasks. Instead of clearing entire cache structures when processing delays occur, administrators can inspect individual filter caching jobs in real time, monitor execution priorities, remove bottlenecks, and manually prioritize urgent tasks.
Understanding the Filter Queue Grid
1 Go to Administration > System > Current Filter Queue.
2 Review the list of queued filter tasks. The counter above the table displays the total number of pending items (e.g., Total: 54). The table contains the following columns:
- Filter: The name of the specific dimension or filter node currently being cached (e.g.,
Duration seconds,Event category,Priority,Location). - View: The underlying data view that owns the filter (e.g.,
Senior Living Emergency Management Imported,[dbo].[v Target Mail]). - Filter ID: The unique internal system identifier assigned to the filter task.
- Task Type: Identifies the nature of the queued operation (e.g.,
Filter). - Priority: Indicates whether the caching job has high-priority status (
Yes).
Intelligent Prioritization
The system applies automated priority routing. When a designer or administrator manually clicks Refresh Cache within a View's filter settings, that task is automatically assigned high priority (Yes), allowing human-requested updates to instantly bypass routine automated background caching jobs.
3 Use the Search input bar above the table to quickly filter pending jobs by filter name, view name, or ID.
4 Click the circular reload icon at the top right to refresh the queue list and retrieve the latest task counts.
Prioritizing Queued Tasks (Move to Top)
When a specific dashboard or view filter requires immediate caching, administrators can bump its task directly to the front of the execution queue.
1 Locate the target filter job in the table.
2 Select the checkbox on the left side of the row (or select multiple checkboxes to prioritize in bulk). Selecting at least one item activates the queue action toolbar at the top right.
3 Click the Move to top button (upward arrow icon ⭱) at the top right.
4 The selected tasks are immediately moved to the head of the queue and will be processed next by the cache workers.
Deleting Filter Cache Tasks
If an invalid task, redundant refresh, or severe bottleneck is obstructing the queue, administrators can selectively delete specific items without affecting other queued filters.
1 Select the checkbox next to the filter task(s) you wish to cancel. To select all visible tasks on the page, check the master box in the table header.
2 Click the red Delete button (trash can icon) located in the action toolbar at the top right.
3 Confirm the action. The selected caching jobs are removed from the queue immediately.
Background Processes
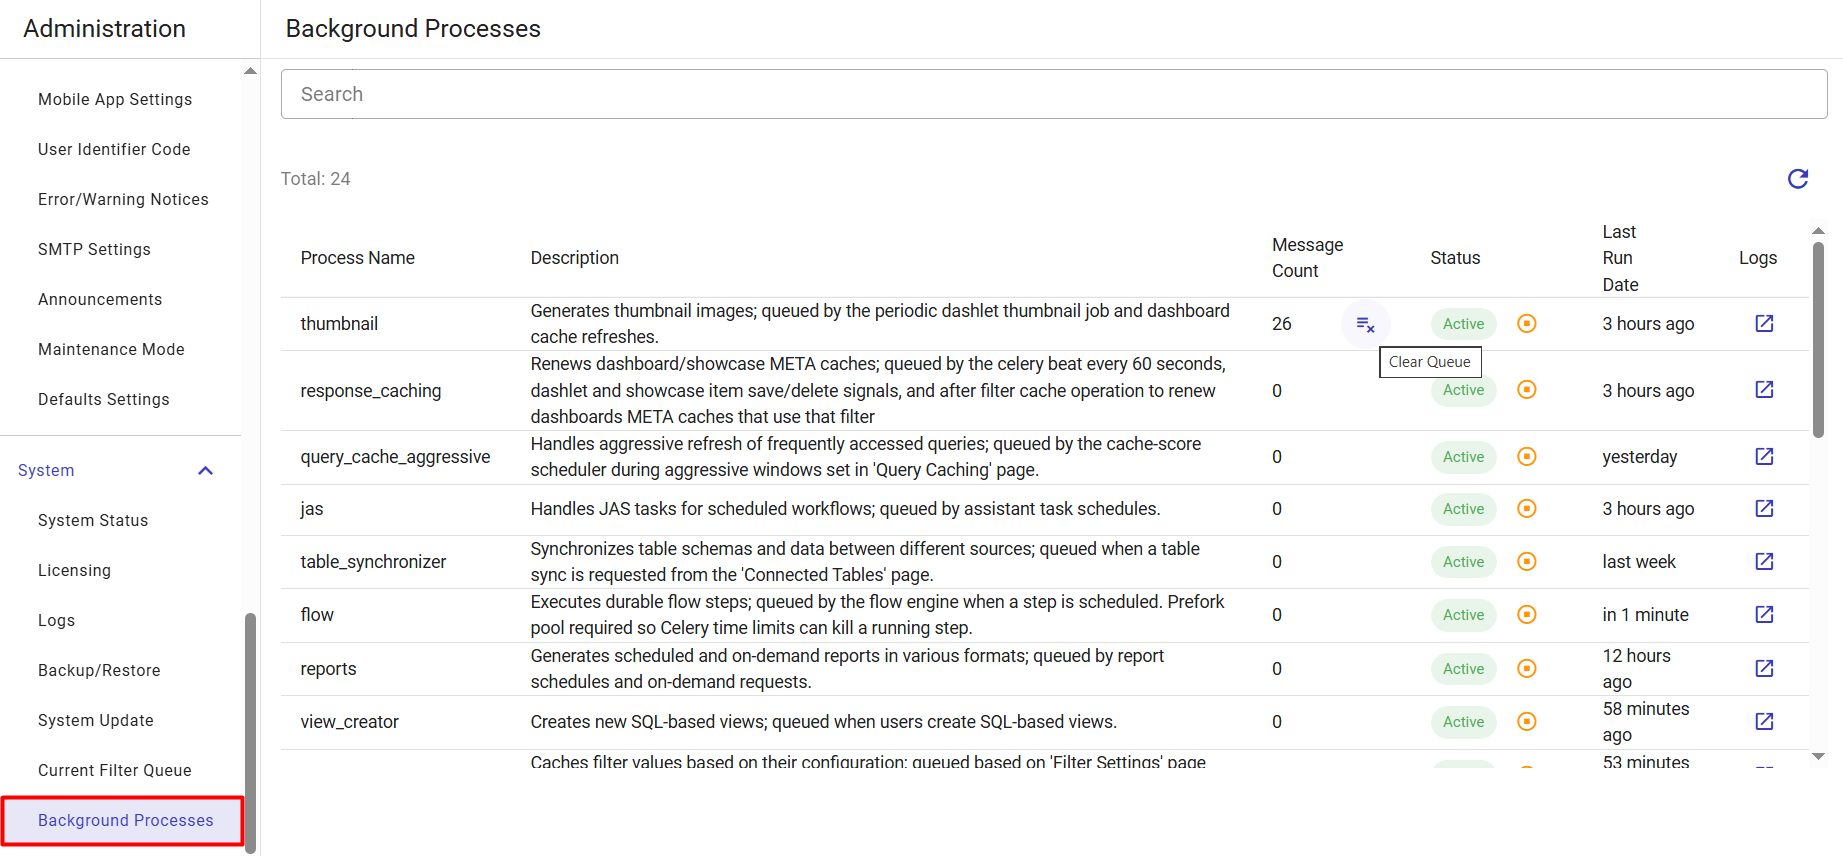
The Background Processes page acts as a centralized monitoring and operational control interface for automated background tasks and Celery message queues. It provides administrators with full real-time visibility into the health of TURBOARD's asynchronous workers, automatically sorting the busiest queues to the top of the list so bottlenecks are immediately visible.
Monitoring Background Tasks
1 Go to Administration > System > Background Processes.
2 Review the list of background queues. The list shows the total count of processes (e.g., Total: 24) and displays the following columns:
-
Process Name: The internal system identifier for the worker task (e.g.,
thumbnail,query_cache_aggressive,response_caching,jas,table_synchronizer,flow,reports,view_creator). -
Description: Details what the process does and what triggers it (e.g., periodic celery beat jobs, save/delete signals, user-initiated requests).
-
Message Count: The number of tasks currently queued in the message broker waiting for execution.
-
Status: Shows whether the process worker is
Active(green) orInactive(red/pink). -
Last Run Date: Timestamp of the most recent execution (e.g.,
in 1 minute,3 hours ago,yesterday, or-). -
Logs: Provides a direct shortcut link to inspect the execution records for that specific task.
3 Use the Search bar at the top to quickly filter processes by name or description.
4 Click the circular refresh icon on the top right to reload the queue counts and execution timestamps.
Pausing and Resuming a Process
Administrators can safely pause execution for specific workers to prioritize system resources or halt unintended task loops.
1 Locate the target process in the list.
2 To stop a running task, click the circular stop icon in the Status column. The badge switches to Inactive.
Note
Stopping a process does not drop or delete messages. Incoming tasks will safely accumulate in the queue while the process is inactive, waiting to be consumed when the worker is restarted.
3 To resume task execution, click the circular play icon (Activate). The worker resumes and begins consuming the pending messages.
Clearing a Backlogged Queue
If a queue becomes unexpectedly overloaded or tasks are stalled, you can forcefully purge the pending messages.
1 Locate the backlogged process row containing the pending messages.
2 Click the Clear Queue icon button (≡x) located right next to the Message Count value.
3 Confirm the action to instantly remove all pending messages from that queue.
Important
Purging a queue deletes pending background tasks permanently (such as pending thumbnail generations or cache refresh jobs). Use this action primarily when clearing massive bottlenecks or invalid task accumulations.
Inspecting Process Logs
1 In the row of the process you want to investigate, click the external link icon in the Logs column at the far right.
2 TURBOARD navigates directly to Administration > System > Logs, automatically filtering the view to show diagnostic entries associated with that specific worker to drastically reduce troubleshooting time.