Settings & Configurations Menu
Settings and Configurations Menu Options
Dashlet Settings and Configurations are located as a panel at the right-side of the dashlet PG, a menu panel is available for all dashlet types to allow managing the dashlet’s advanced settings, changing its styling, design, and aesthetics, adding/editing filters and applying conditional formatting. Some of these settings and preferences may differ according to the dashlet type.
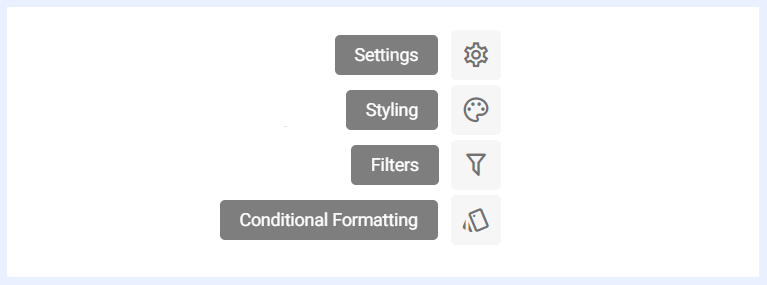
Settings Panel General Definition
“Settings” panel offers a set of configurable options available for each dashlet type within TURBOARD. These settings provide users with the ability to personalize and fine-tune the behavior and appearance of their dashlets according to their specific needs and preferences.
Each dashlet type comes with its unique set of settings, allowing users to control features such as auto-refresh behavior, highlighting specific data elements, applying logarithmic scales, and more. You can explore these settings in detail by referring to the explanations in the corresponding section dedicated to dashlet type settings.
Don't Show Without Filter: when enabled, the dashlet remains hidden until the required filter(s) are applied. An additional option, Show if Any Selected Filter is Applied, makes the dashlet visible as soon as at least one of the required filters is applied, rather than requiring all of them. This gives end-users more flexibility when querying dashlets with multiple required filters.
Styling Panel General Definition
TURBOARD offers flexibility and customization options available for chart dashlets' styling and appearance. By default, all dashlets adhere to TURBOARD's styles and themes, ensuring a consistent look and feel throughout the platform. However, designers may have unique preferences, and we empower users to personalize their dashlets using the various customization options provided for each specific dashlet type.
To learn more about these options and how to leverage them effectively, refer to the detailed explanations in the corresponding section dedicated to dashlet type styling.
The font library available in dashlet styling includes many options organized into four categories — sans-serif, serif, monospace, and fantasy — with the most popular fonts listed first in each group for quick access. A safe fallback font is automatically applied if the primary font fails to load in the user's browser.
Filters Panel Definition & Settings
“Filter” panel contains all the nodes that were assigned as filters in the related view. The user can configure the settings of any selected filter as below.
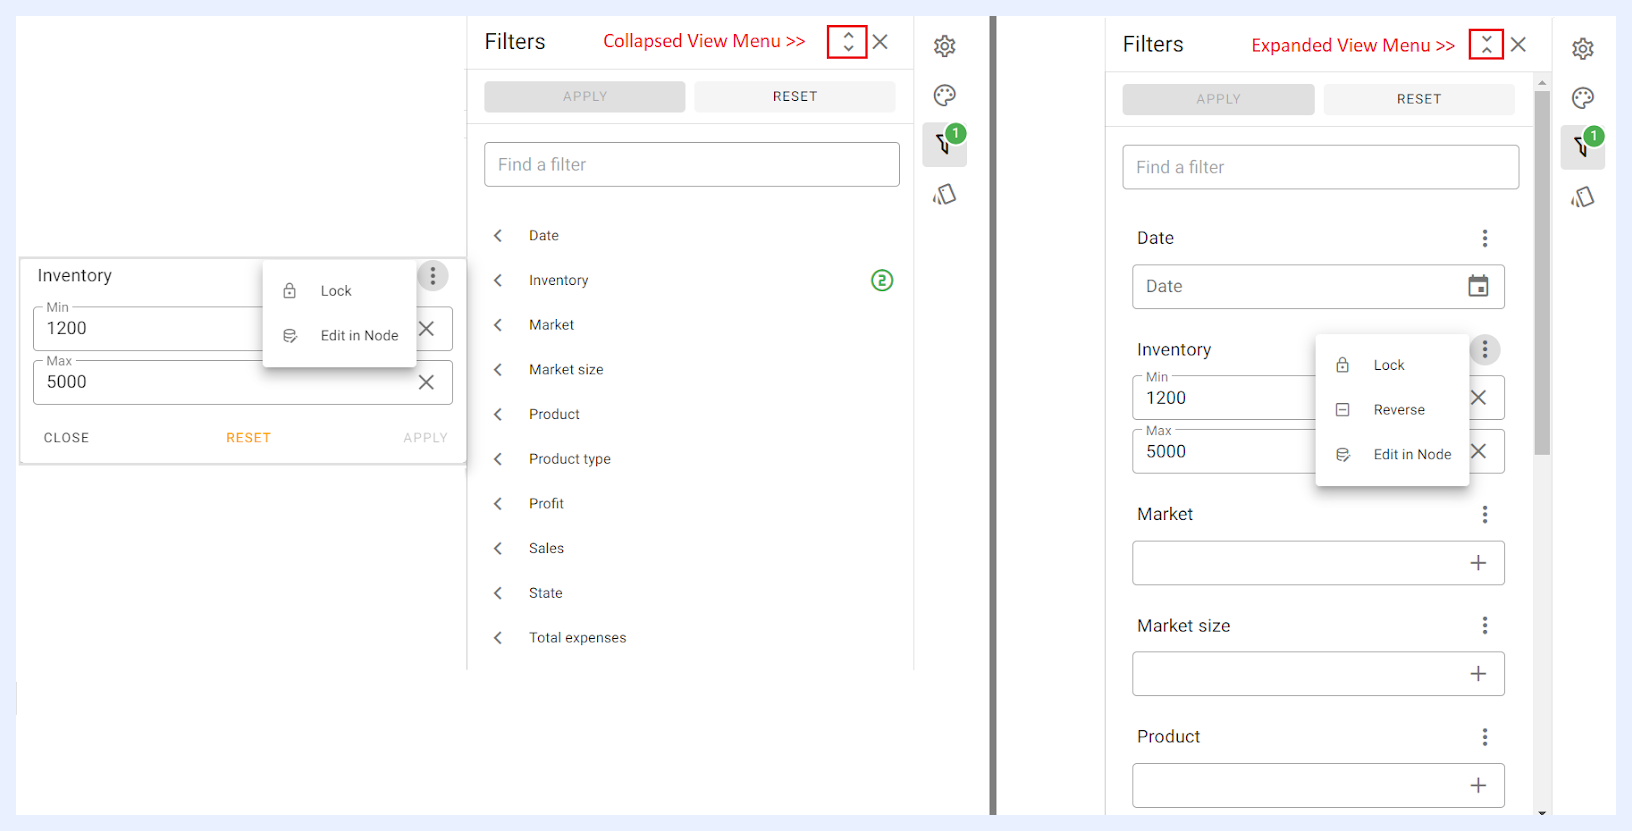
Lock: unless the selected filter is locked, filtering does not affect the dashlet at the end-user side. Locking a filter will result in displaying the dashlet with that filter applied wherever it appears in the related dashboard(s) and/or showcase(s).
Reverse: once a value is selected and entered for the related filter, it can be reversed through “Reverse” option from the filter’s ellipsis menu. When “Reverse” is applied, filters in the resulting dashlet will be reversed, meaning they will be excluded from the displayed data instead of being used to filter the data. These reversed filters will be highlighted in red with a cross icon.
Edit in Node: if selected, it will open the “Edit” window for the node in its related view to allow the user to edit or change the settings of the filter if needed.
Filter value dropdowns use lazy loading (infinite scroll). As users scroll to the bottom of a filter list, the next page of values loads automatically, so values beyond the initial page limit can be reached without typing in the search bar.
Note
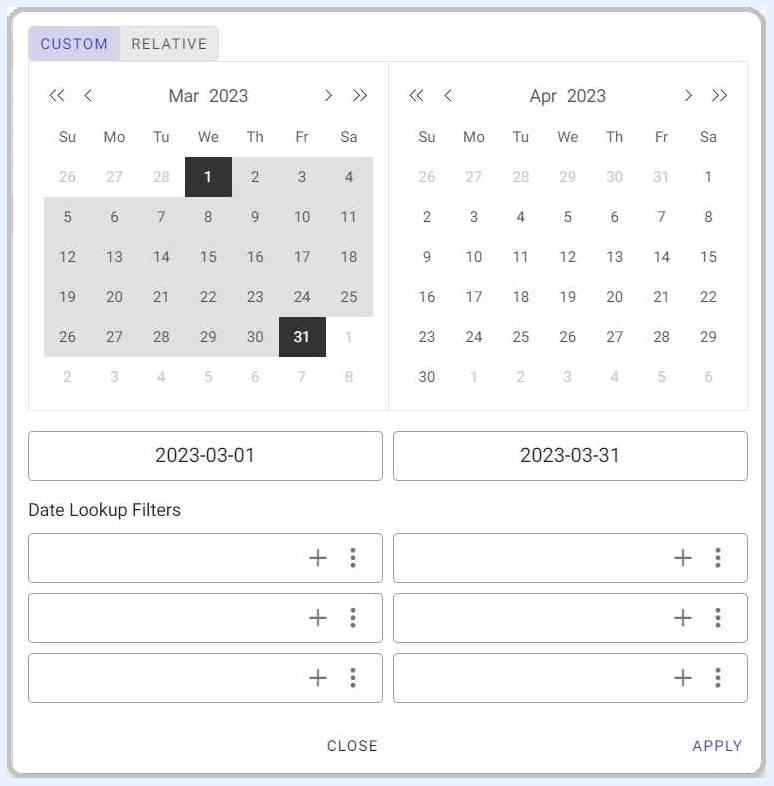
date filters can be configured with distinct filter inputs for different date and time units that will appear for the user to choose from in “CUSTOM” tab. In addition to predefined date shortcuts, users can customize date selection through the options available in “RELATIVE” tab as it allows the user to configure the date range (Start and End). See image below.
Conditional Formatting Panel General Definition
Conditional formatting is used to easily highlight certain values in the dashlet or make particular values easy to identify. End-users will easily notice the difference between the visualized values using this feature.
To learn more about how to configure the conditional formatting, refer to the detailed explanations in the corresponding section dedicated to each dashlet type.