Scheduled Jobs
Data Flows
The Data Flows page serves as the centralized orchestration and monitoring interface for automated data pipelines, inter-database synchronization tasks, data lineage workflows, and scheduled view data refreshes. Operating under the Scheduled Jobs infrastructure, it allows administrators to track automated data movement across heterogeneous databases (including MySQL, PostgreSQL, ClickHouse, Oracle, and TimescaleDB), verify execution intervals, trigger ad-hoc manual syncs, and diagnose step-by-step pipeline execution logs.
Monitoring Data Flow Schedules
1 Go to Administration > Scheduled Jobs > Data Flows.
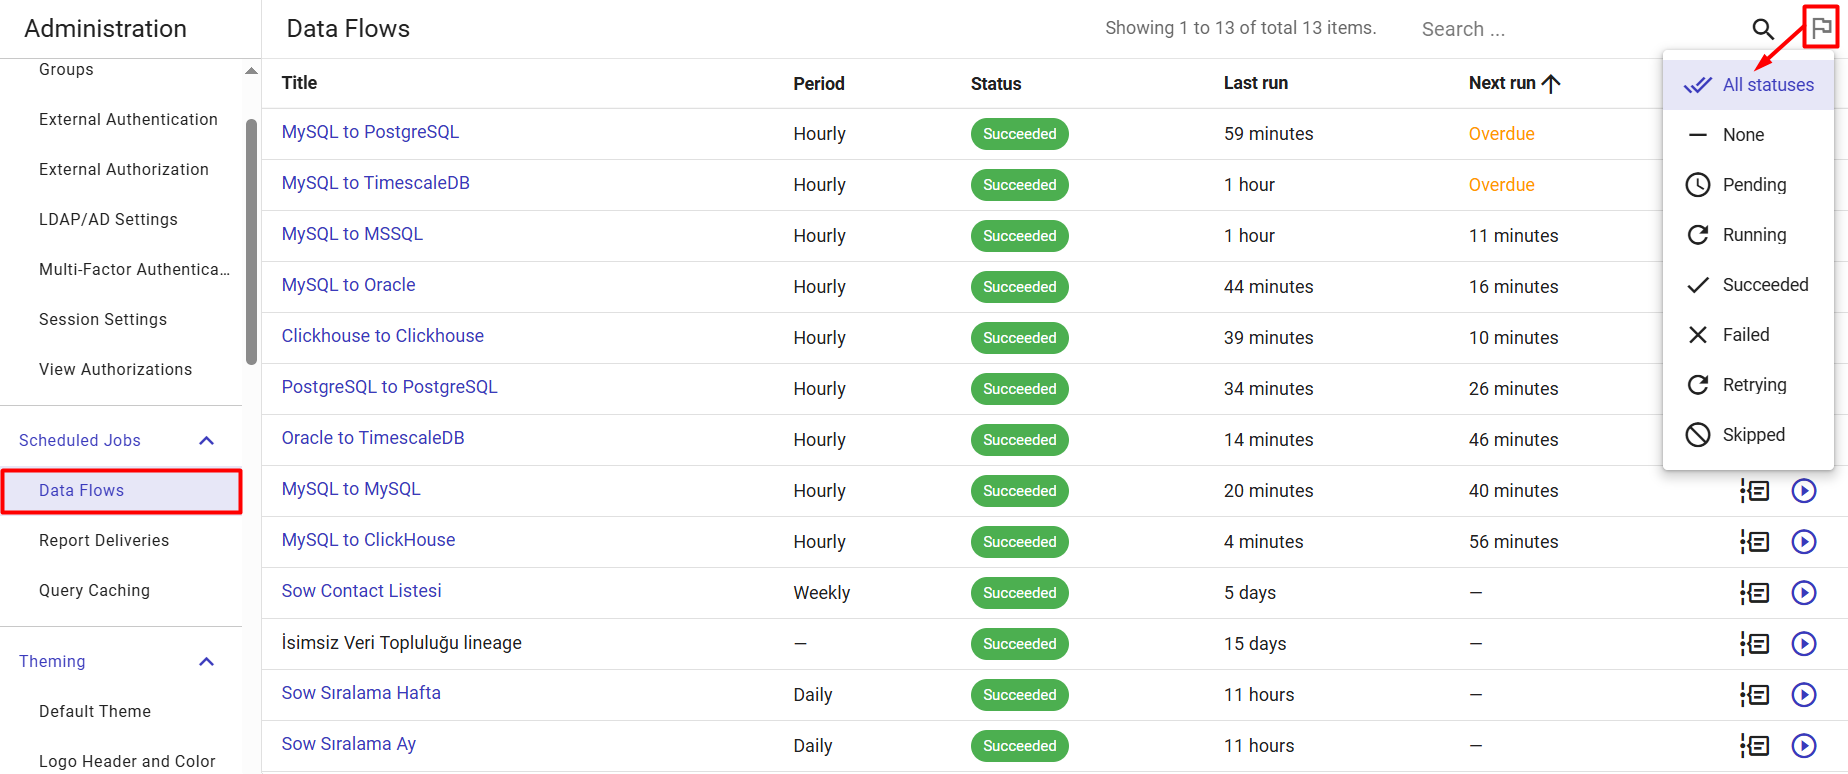
2 Review the central data flows inventory grid. The total record count is indicated above the table (e.g., Showing 1 to 13 of total 13 items). The grid provides the following columns:
- Title: The identifying name of the data pipeline or lineage sync (e.g.,
MySQL to PostgreSQL,Clickhouse to Clickhouse,MySQL to TimescaleDB,Oracle to TimescaleDB). - Period: The configured automation frequency defining how often the pipeline executes (e.g.,
Hourly,Daily,Weekly, or-for manual/event-driven flows). - Status: The health status badge of the most recent execution (e.g.,
Succeededin green,Failedin red, orRunningin blue). - Last run: Relative timestamp indicating when the pipeline last executed (e.g.,
4 minutes,49 minutes,11 hours,5 days). - Next run: The dynamic countdown timer displaying when the flow is scheduled to trigger next (e.g.,
43 seconds,11 minutes,51 minutes,Overdue, or-for non-scheduled flows). Click the sort arrow on the Next run header to sort jobs chronologically by upcoming execution.
3 Use the top-right toolbar to filter the inventory:
-
Search (Magnifying Glass): Filter data flows by typing the pipeline's title.
-
Filter by last run status (Flag Icon): Click this icon to open a drop-down menu to filter the grid by specific execution states. You can instantly isolate stalled or failing pipelines by selecting one or more statuses from the list: All statuses, None, Pending, Running, Succeeded, Failed, Retrying, or Skipped.
Triggering an Immediate Data Flow Execution (Run Now)
Administrators can bypass scheduled intervals and trigger an ad-hoc pipeline execution directly from the grid:
1 Locate the data flow you want to execute immediately.
2 In the far-right action column of the row, click the Run now button (circular play icon ▶).
3 The task is immediately dispatched to the background flow processing queue. The Status column updates to reflect the active execution, and the data target or view is refreshed with the latest source records.
Inspecting Diagnostics and Flow History
To audit execution durations, verify load types, and inspect row-level transfer counts for each step of a pipeline:
1 Locate the target flow in the grid.
2 Click the Flow History icon button (flow node diagram icon) in the far-right column.
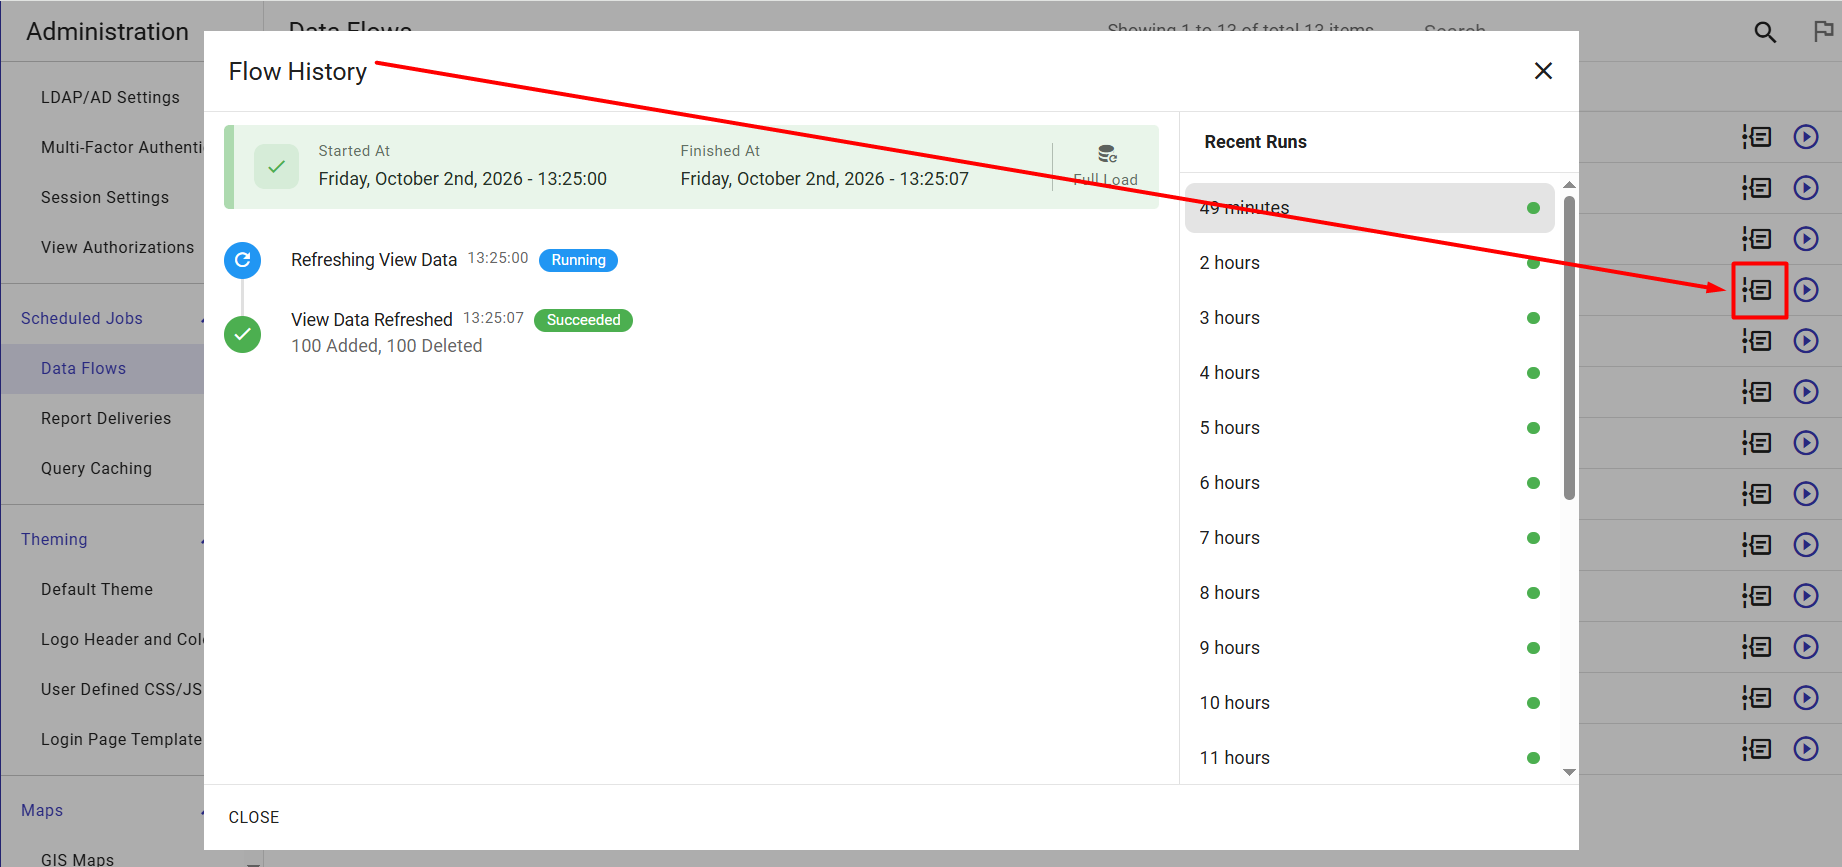
3 The Flow History modal window opens, structured into two operational panes:
- Recent Runs (Right-Hand Pane): A chronological history of recent execution runs (e.g.,
49 minutes,2 hours,3 hours). Each run displays a status indicator dot (green for success, red for failure). Click any historical entry to view its specific execution log. - Run Overview & Metrics (Top Summary Card): Displays high-level execution metadata for the selected run:
- Started At: The exact date and start time down to the second.
- Finished At: The exact completion timestamp.
- Load Type: Indicates whether the run was an incremental sync or a
Full Load.
- Step Execution Timeline (Left-Hand Stepper): A vertical pipeline trace that breaks down each discrete operation within the flow:
- Stage Title & Timestamps: Shows individual tasks (such as
Refreshing View DataandView Data Refreshed) along with the exact second of transition. - Stage Badges: Displays real-time operational badges (
Runningin blue,Succeededin green). - Row Count Telemetry: Reports record-level mutation statistics upon completion (e.g.,
100 Added, 100 Deleted).
- Stage Title & Timestamps: Shows individual tasks (such as
4 Click CLOSE or the ✕ close button in the top-right corner to exit the modal.
Report Deliveries
Under this section, Super Admin users can send any required dashboard as an ad hoc report to be sent to TURBOARD users via their e-mails as an attached PDF file, and/or can configure auto-sent and/or custom reports to be sent similarly on a periodic basis.
How to set periodic reports in TURBOARD?
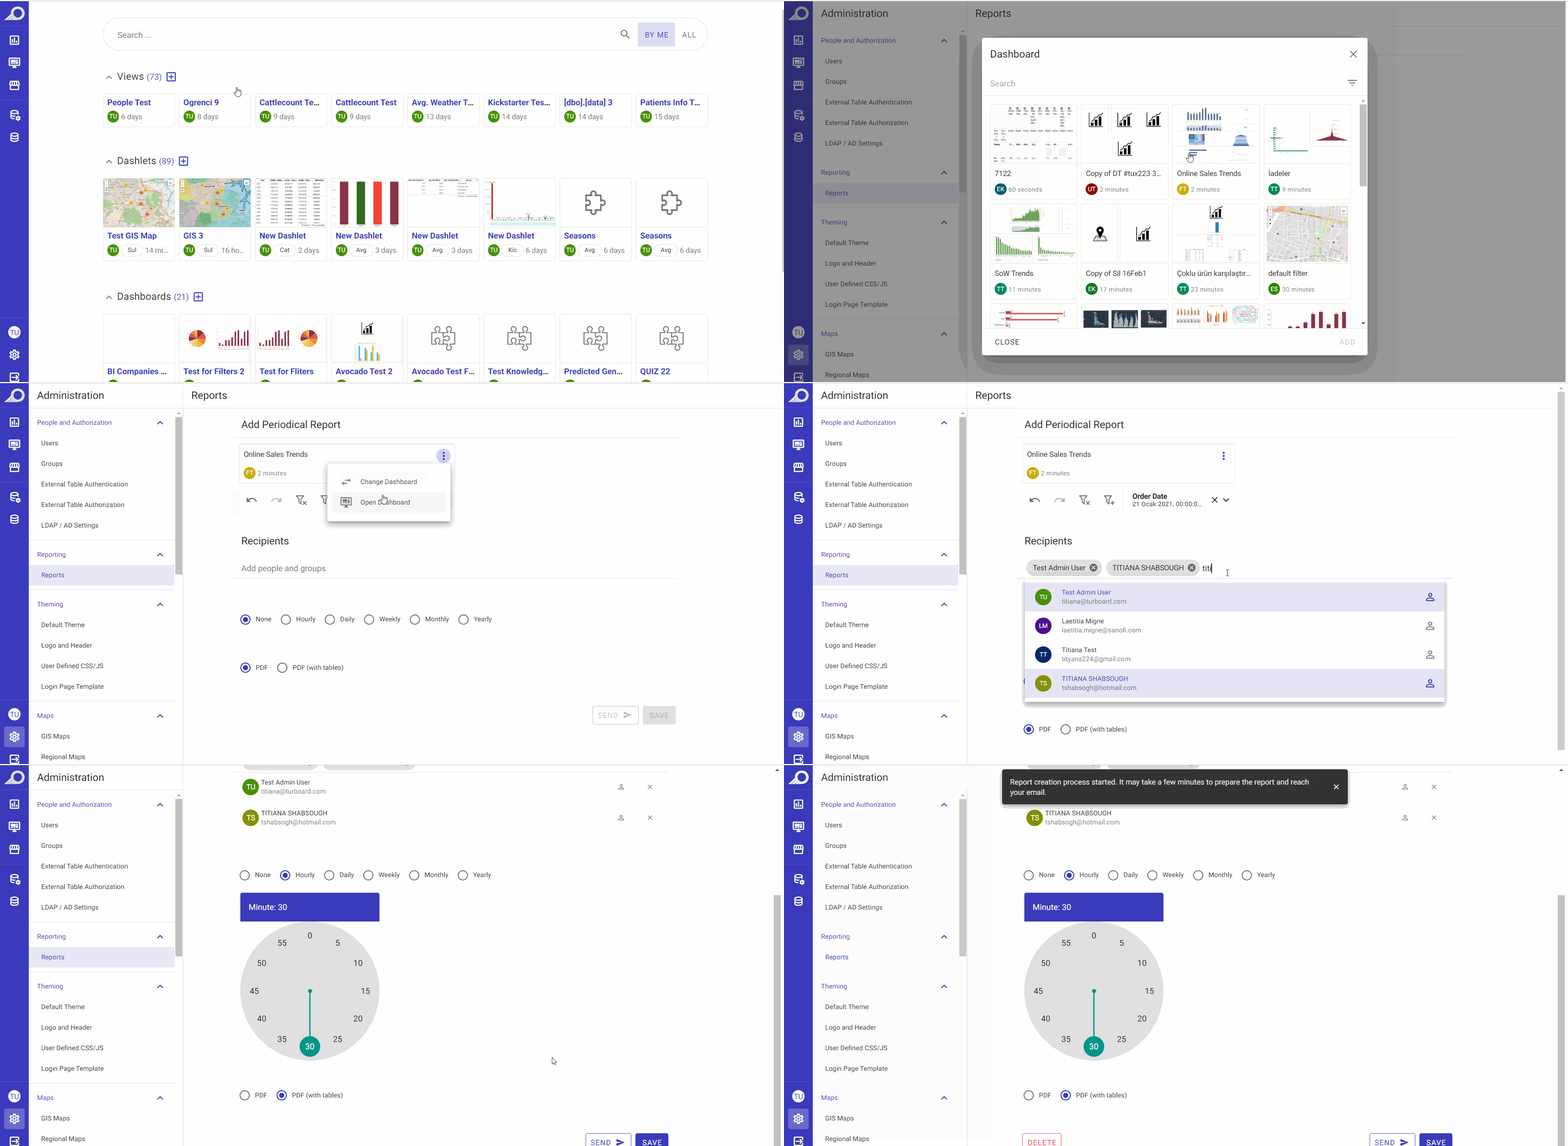
1 Go to Administration > Reporting > Reports > Click + Add a new report icon.
2 Click SELECT A DASHBOARD button and choose the dashboard that the report will be generated according to, then click ADD button. The dashboard will be automatically added as a periodic report. You can change the dashboard and/or open it at any time from the ellipsis.

3 If the selected dashboard has filters, you may select the filters and restrict the values in which the report will be sent according to their fetched data only from the related dashboard.
4 Add the recipients of the report by selecting the required users and/or group and clicking on them to be added automatically.
5 If the selected dashboard has Pivot table/s or detailed table/s, they will be added as tables in the attached PDF upon selecting “PDF (with tables)” radio button.
6 Click SEND button if this report is ad-hoc and you wish to send it immediately to the selected recipients.
7 OR click SAVE button and your report will be automatically added to the list of reports in their general view window.
At any time, you can click on the Edit icon for the required report from the Reports list to open its “Edit” window so you can:
Change the report details, including setting its automatic sending frequency. Click SAVE button when done.
Send the report immediately to all its active recipients (regardless of the report’s automatic “Sending Frequency”).
View the report log and its events’ records.
Delete the report by clicking the REMOVE button.
Query Caching
Under this section, Admin users can set a schedule for the system cache and queries to be automatically renewed/refreshed from the data sources that TURBOARD is connected to. The queries that are actively used in TURBOARD will be checked and the cache will be refreshed according to the set date and time.
How to set a scheduled caching for TURBOARD?
1 Go to Administration > System > Caching.
2 Click + Add a new schedule icon, and fill the fields in the “Add” window that opens:
-
“All day” check box: if checked, the automatic refresh of the queries will take place on the whole day period for the selected day/s.
-
“Start hour/End hour” fields: 00:00 time format fields to determine the caching start and end times during the selected day/s.
-
“Days” field: a drop-down multi-select field to select the day/s on which the caching will be applied.
-
“Mode” radio buttons: select caching mode whether normal or aggressive. In “Aggressive” mode, the system will run 5 queries concurrently, while in “Normal” mode, it will run queries one after another. If the aggressive mode overlaps the normal one, the system will enable the aggressive mode.
3 Click SAVE button.
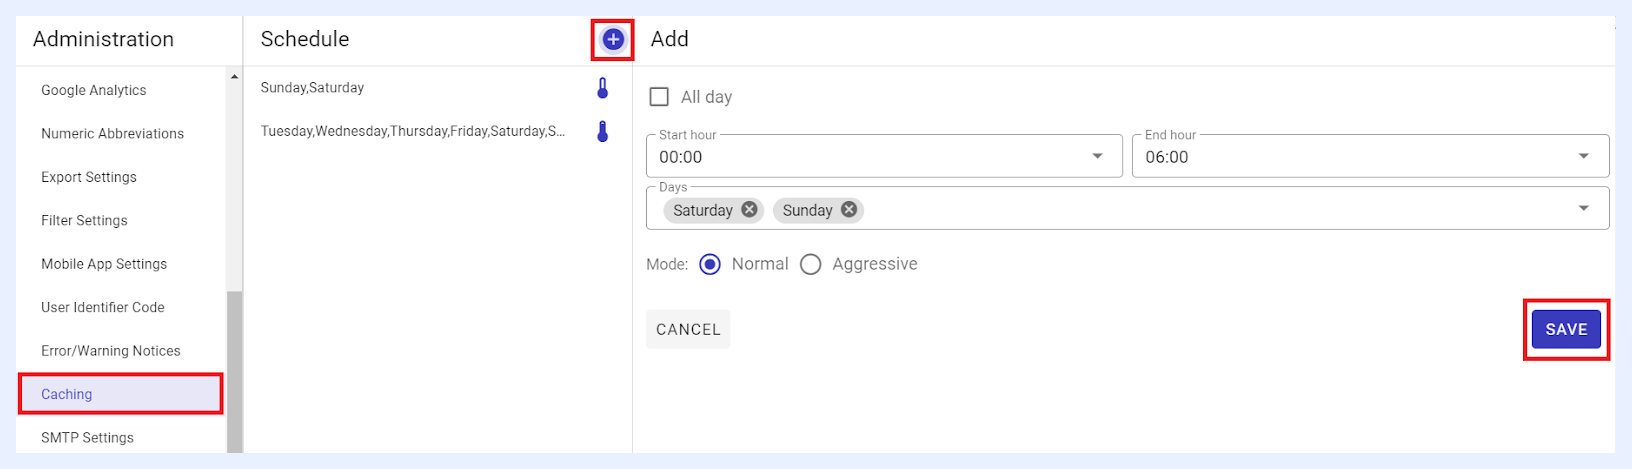
The caching schedule will be listed under “Schedule” list in which you may select and click it any time to edit its details and/or remove it as required.