Nodes in Views
Nodes Settings
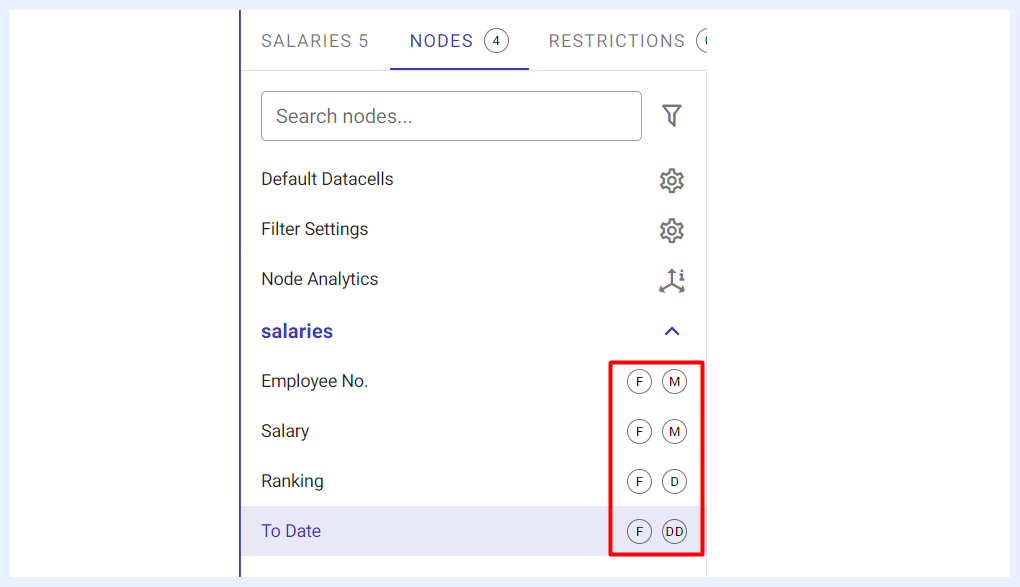
All nodes of the selected view are listed under this tab. Their types and settings are automatically detected and marked next to each node name accordingly.
| Node Type Icons Explained | |
|---|---|
F: |
indicates that this node is set as a “Filter”. |
M: |
indicates that this node’s type is a “Measure”. |
D: |
indicates that this node’s type is a “Dimension”. |
DD: |
indicates that this node’s type is a “Date Dimension”. |
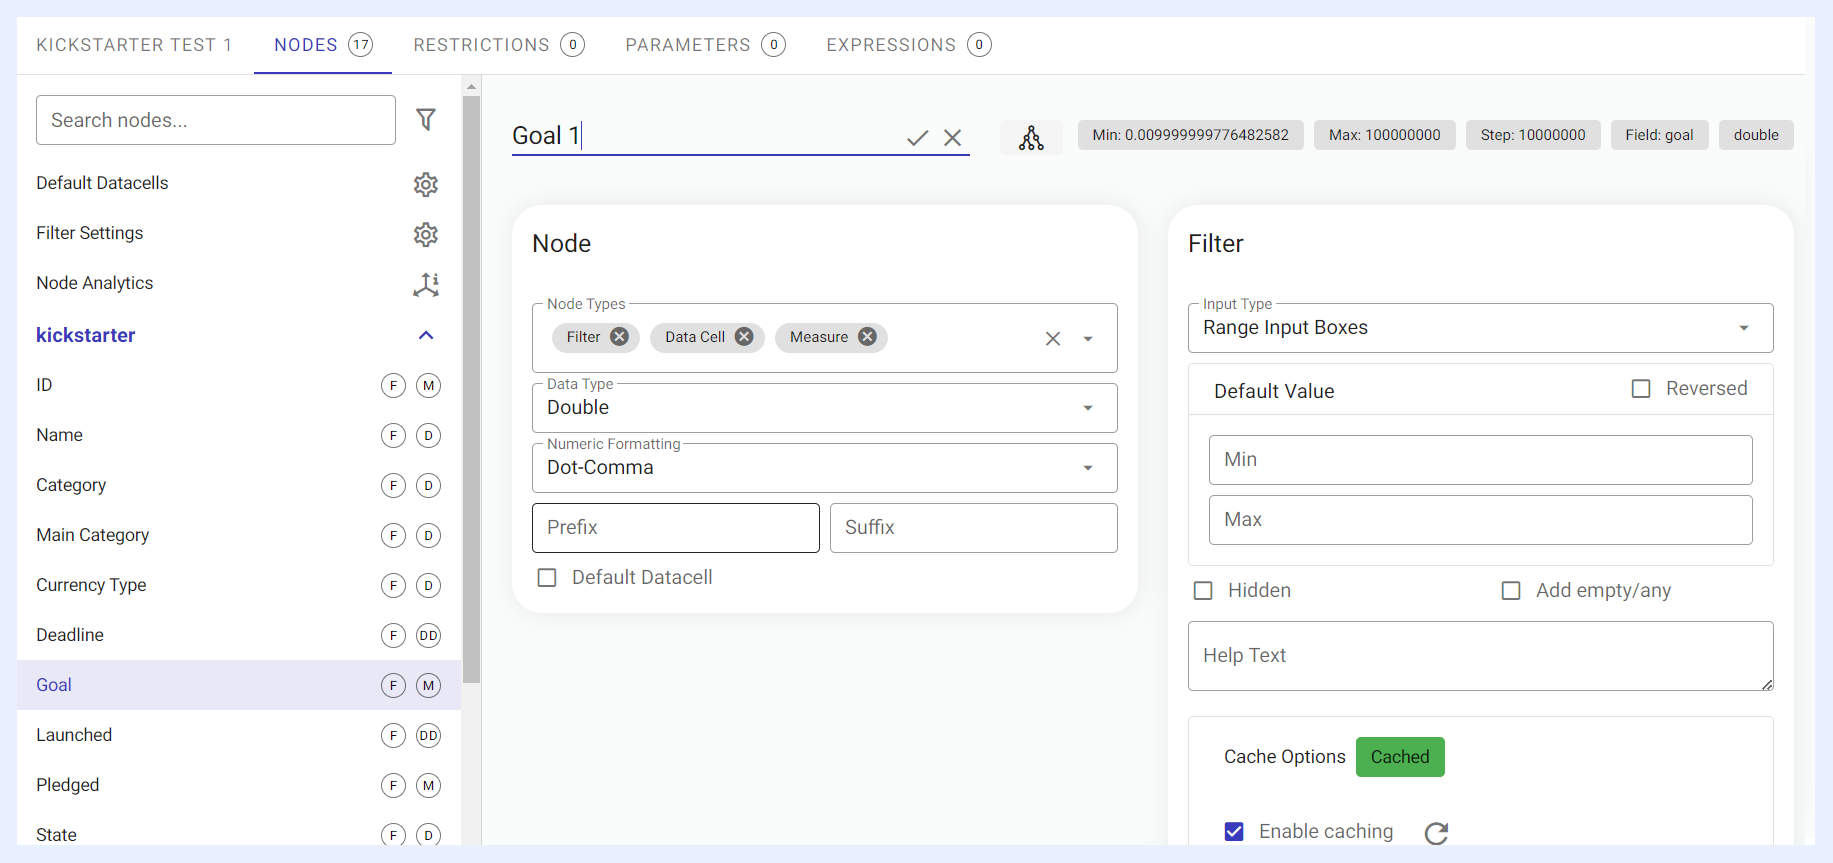
However, nodes’ settings can be changed/managed. As you select a node from the node’s list at the left-side of the “Nodes” tab window, its edit mode opens at the right as below:
Node Alias/Name
Field names are converted to human-understood format by default (Camel case or underscores are replaced by spaces for example), but further changes can be applied.
It is important to give a convenient alias to the node as the users will see the alias in the resulting visualization. Although the alias may still be changed when preparing a dashlet (at Dashlet given alias level), the alias at view settings will be the default.
To change the alias/name of a node, select it from nodes’ list > click on the node’s name at the top of its edit window > change the name > click ✓ icon > click SAVE button.
Node Descriptions
Each node can carry a description that clarifies its business meaning. Descriptions can be written manually, and TURBOARD can also generate them automatically using RAG (Retrieval-Augmented Generation) technology, analyzing each node shortly after creation and populating its description field. A clear description (for example, “Net revenue after discounts, excluding returns”) helps JAS respond with more precise, business-aware answers when it works with the view.
Node Types
Nodes correspond to fields in the database. Each node has a type depending on the data type of the database field it is connected to.
Node types are assigned according to the data type by default. But in case the semantic meaning and the data type does not match, it may be changed in this field. For example, if the gender is saved as integer (1, 2, 3, ...) rather than the string values (male, female, unknown, ...), then it should be set as a dimension instead of a measure since no aggregation would be applied for such a field.
Other examples include: - If the data view will be used in regional maps, “Territory” can be added or removed from the assigned “Node Types”. - To convert a node that was detected as “Date&Time” to “Date” only or “Time” only depending on the data analysis needs. - When a node containing only two values (positive and negative) is detected by TURBOARD as “Varchar”, it can be converted to the “Boolean” type if desired. - To disable the filter feature for the nodes that will not be used as filters. This will reduce cache times of the filters and will ensure higher performance for your dashboards and visualizations.
Node Types Options
Filter
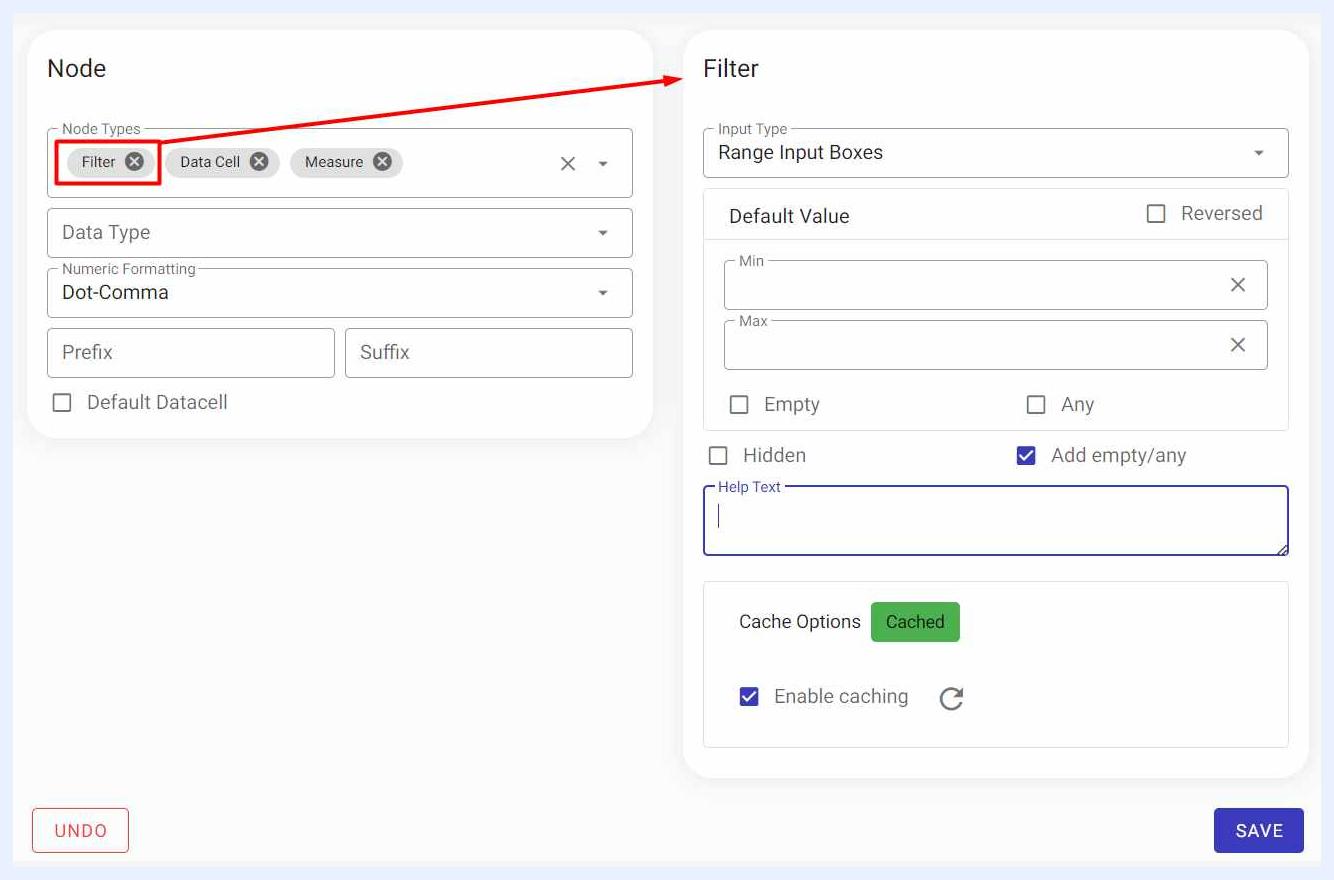
All the nodes (fields) of the created view are set as filters by default (marked with F icon), but it is sometimes needed to remove/disable the filter option for the fields that are not convenient for filtering or the granularity exceeds to billions in which caching all the distinct values will make no sense. Designer and admin users can change/edit the configurations of any node that is set as a filter in “Filter” section that automatically appears at the right side of the node’s “Edit” window.
Dimension
Dimension fields are mostly of type “Varchar” and can be grouped. Note that in some database management systems, “Varchar” and “String” are used interchangeably for variable-length strings of characters, and in TURBOARD syntax, they are both referred to as “Varchar”. A dimension is the categorical representation of the data such as customers, products, and time. Therefore, dates are always set as a dimension by default and are marked as DD.
Measure A measure is a node type that depends on the area where the measurable values are located (for example data type). The node of an “Integer” or “Double” field is marked when importing the data source as a criterion. The user does not need to select it. However, re-marking can be done in some cases. For example, an “Integer” field containing only year data is marked as a measure in the system, the user has to re-mark this field as a dimension. Measures’ Settings and Preferences are set when creating the related dashlet.
Latitude & Longitude These nodes are connected to the areas that contain latitude and longitude data. They must be selected by the user.
Territory It is the size used in SVG maps and is determined by the user, not automatically. This field contains the territory names, such as city, province/state or country names. A different SVG map is needed for each territory type and they are configured by an admin user in Administration > Maps > Regional Maps.
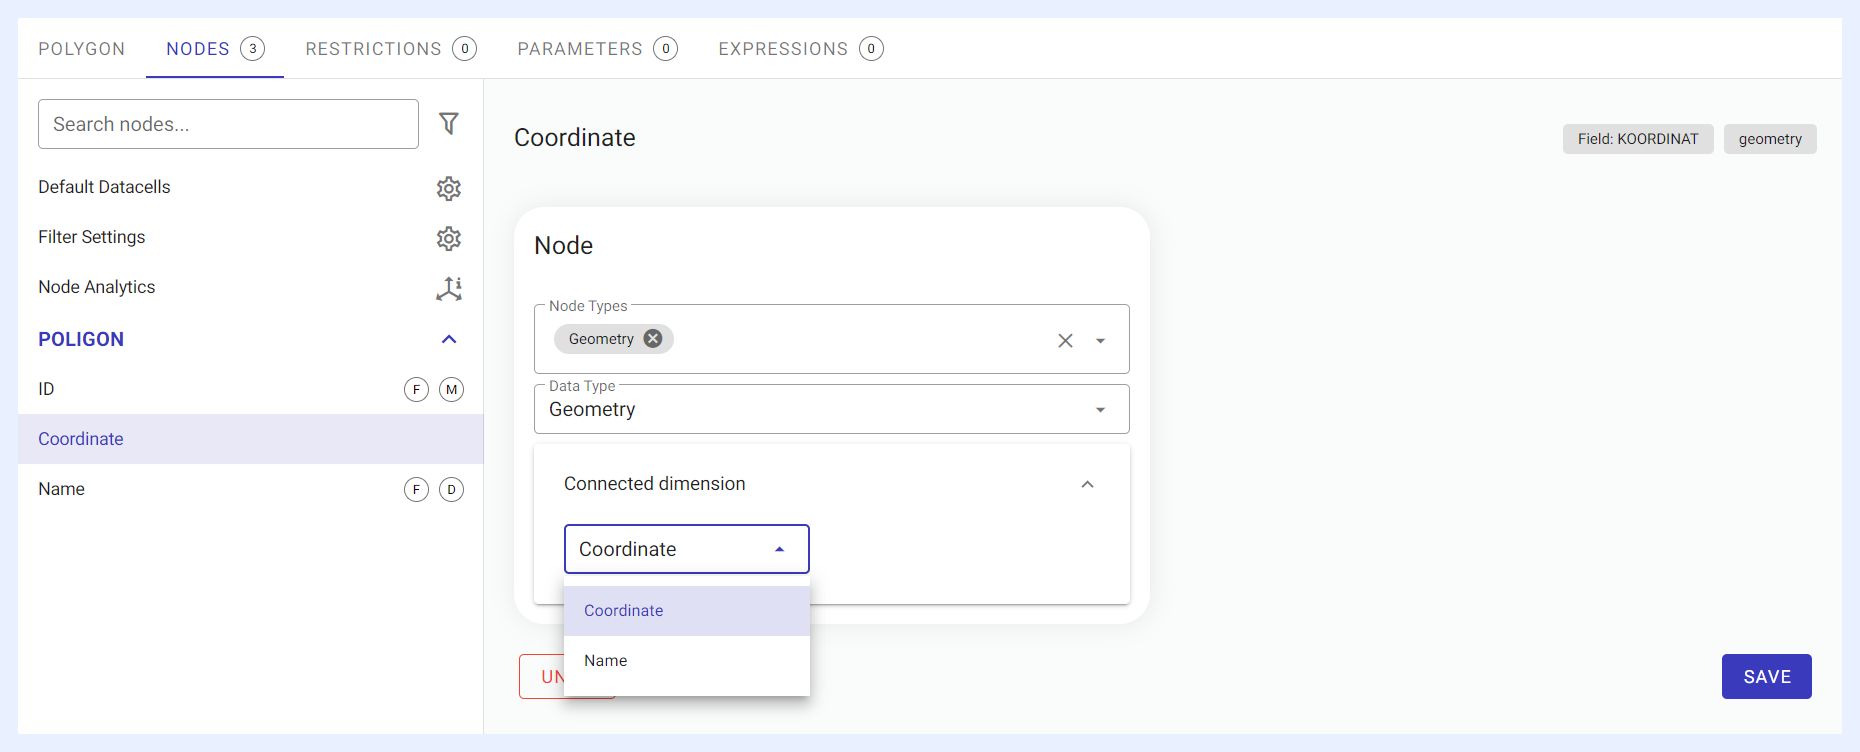
Geometry This node is connected to the area where the location information is stored. It is marked automatically. It does not need to be specified by the user. The only important setting here is to choose the dimension to which the geometry field is attached in “Connected dimension” field. If this size is not selected, the Dashlet will not work.
Data Type Options
Data Type: for the same example in “Node Types”, if the gender is saved as “Integer” (1, 2, 3, ...) rather than the string values (male, female, unknown), it would be better to change its data type to “Varchar” so that the corresponding filter component may be changed to combobox, radio, check box and so on. Type conversion results in a cast or convert function at the database level.
Numeric Formatting (for Measures)
Numeric Formatting: for numeric fields, the default formatting is set here. Choices are:
- No formatting: when selected, the resulting value of this numeric field in the related dashlet is displayed as-is.
- Abbreviation: when selected, the resulting value of this numeric field in the related dashlet is converted to thousands, billions, millions abbreviated forms.
- Dot-comma: when selected, the resulting value of this numeric field in the related dashlet is converted to 2 digits after the decimal comma.
- Custom: when this option is selected, a pop-up window opens with other different formatting options. The user can select the desired formatting option then click
APPLYbutton to apply the changes.
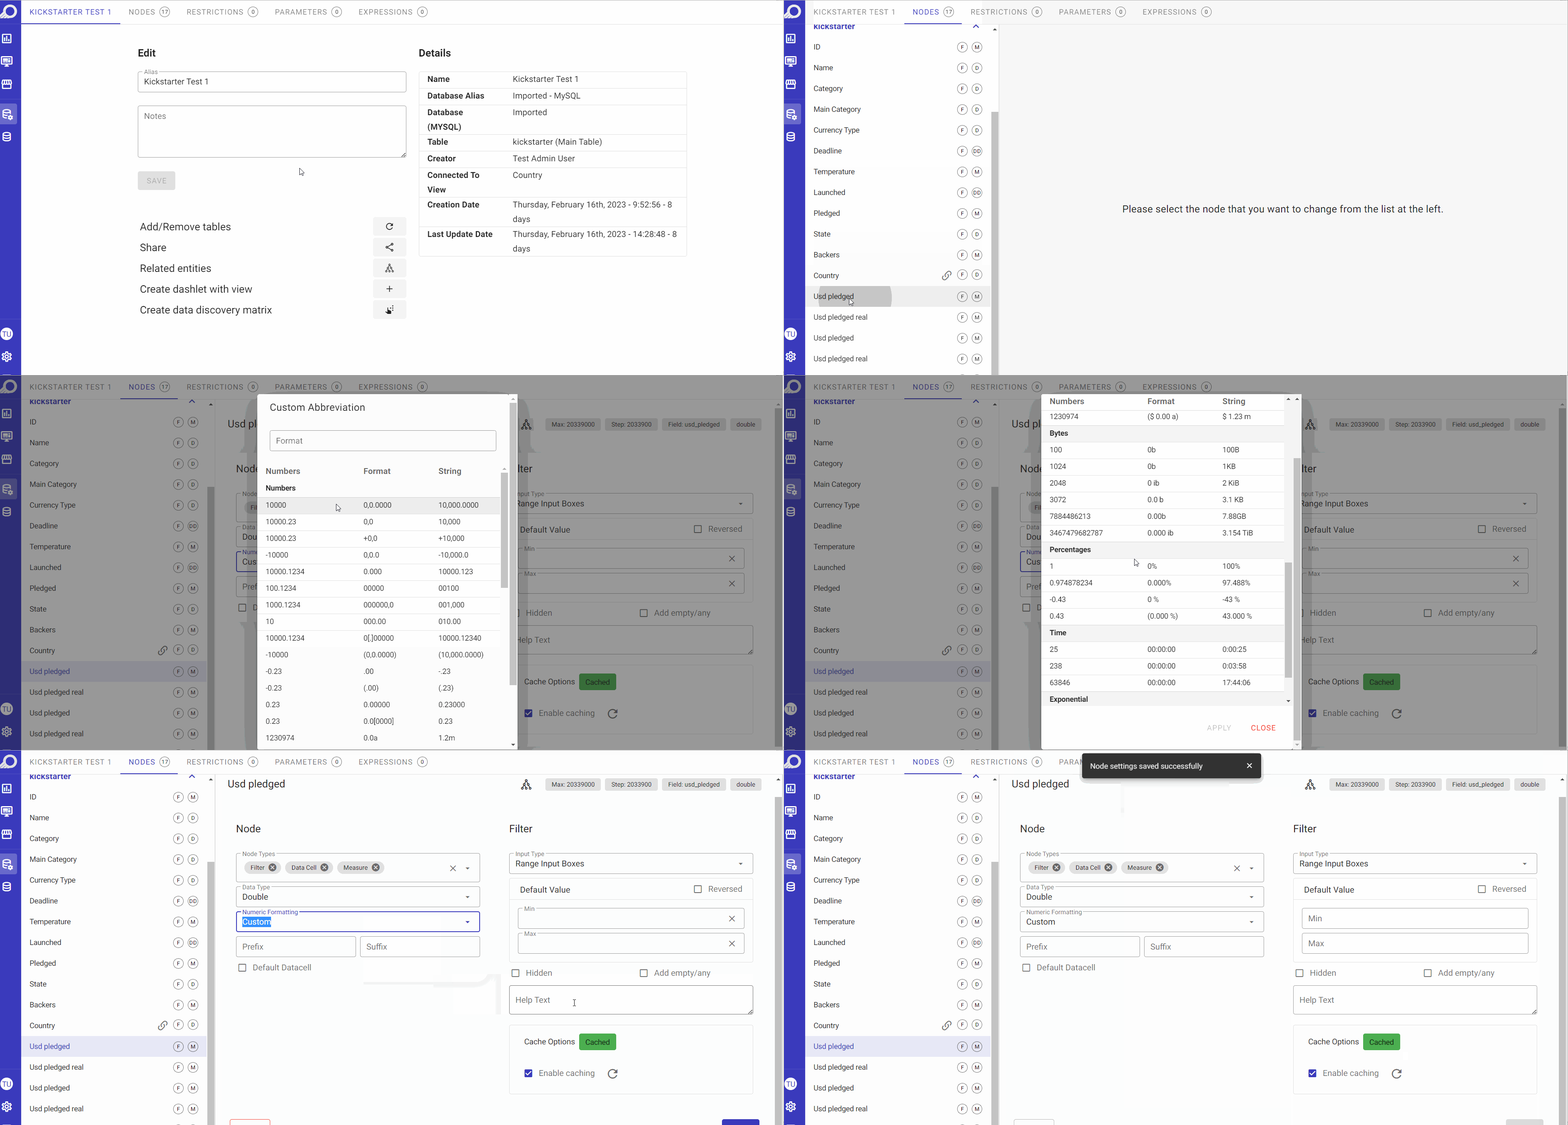 Custom Numeric Formatting
Determining Default Datacells
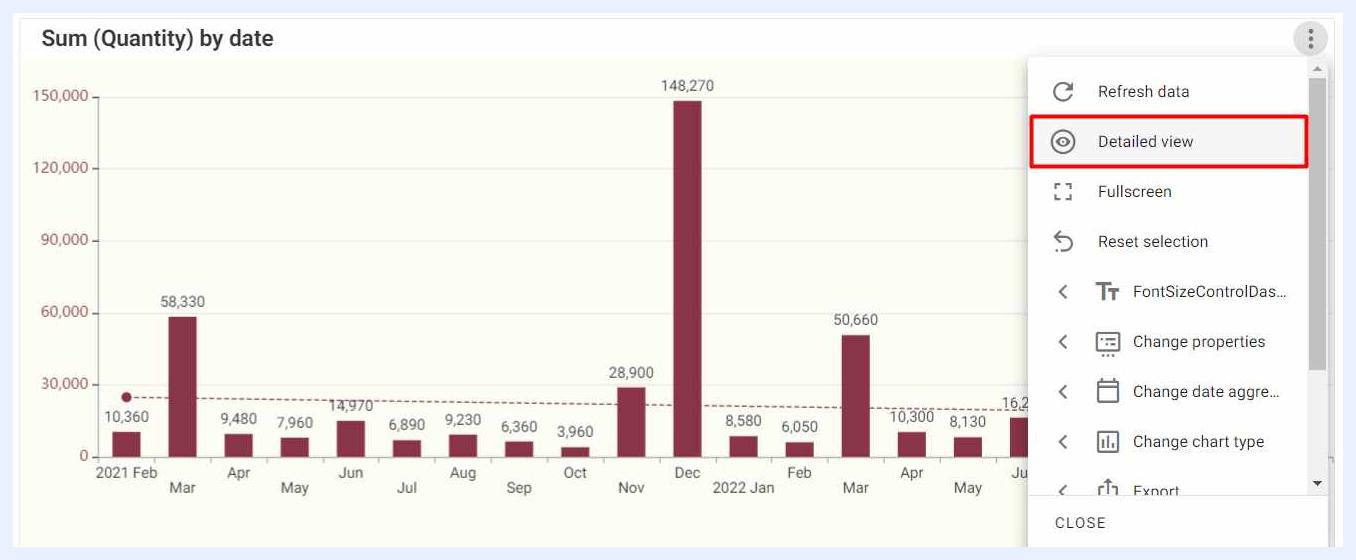
Except for the infocell and gauge, distinct rows in the result set of any dashlet is accessible via the “Detailed view” eye icon available at the dashlet menu (at the dashboard “View” mode).

The admin user can give access to the dashlet details page which contains:
- The dashlet from which the details (eye) icon is clicked.
- Dashlet's pivot version – if the original dashlet is not a pivot table.
- The unpivoted table with all the rows in the result set of that dashlet.
Unpivoted table is the default dashlet which is auto-created in all views. Nodes with “Default Datacell” check box checked as “Yes” will appear by default at that unpivoted table.
Prefix and Suffix (for Measures)
For nodes/fields of type “Measure”, Prefix and Suffix options will appear automatically in order for the user to assign a prefix or a suffix to it, as sometimes suffixes and/or prefixes add more meaning to the measure and makes it more insightful. These options are mostly used for currencies or percentages (if the unit is known).
For example, if a temperature data is used as a measure, a Suffix can be added to indicate to the user that this data is displayed in °C.
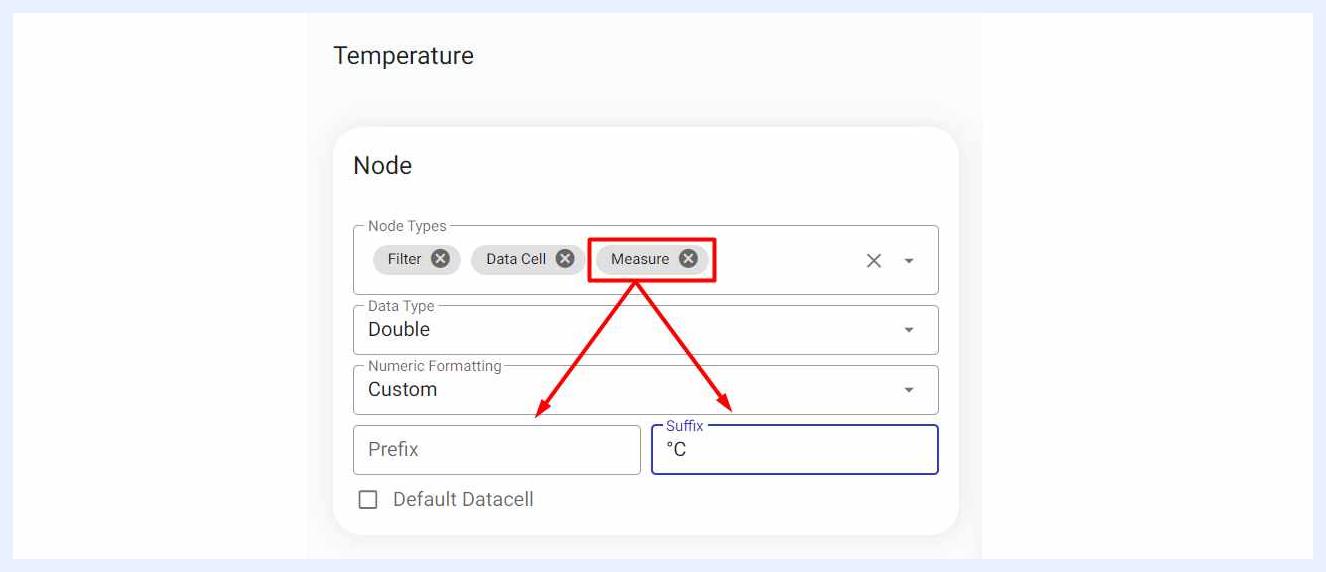
Sort Options (for Dimensions)
For nodes/fields of type “Dimension”, sorting options are available either in “Ascending” or “Descending” order. Value, alphabetical and custom sorting are the available choices.
The user shall be careful about using “Custom Sorting”. If “Custom Sorting” is selected, and not all the values are ordered, then the values that are not taken to the list won't appear in the created dashlets with that dimension.
Connected Dimensions (for Dimensions)
Most of the time, business needs and questions are not restricted to the same datasets. Through this option, TURBOARD users can drive fast analytics on ad-hoc requests by connecting different datasets from different databases to do cross dataset analytics as an advanced feature.
The user can select the other view to connect it to the current one, along with its node from the related drop-down lists. There is no limit on the connection count, it is possible to add as many connections as desired, either to the same field or to other fields.
Once the connection is added, the other view will have the same connection automatically. Both dimensions under their related view will be marked with a Link icon. All related measures and of both connected dimensions will automatically be listed together and can be used to create dashlets.
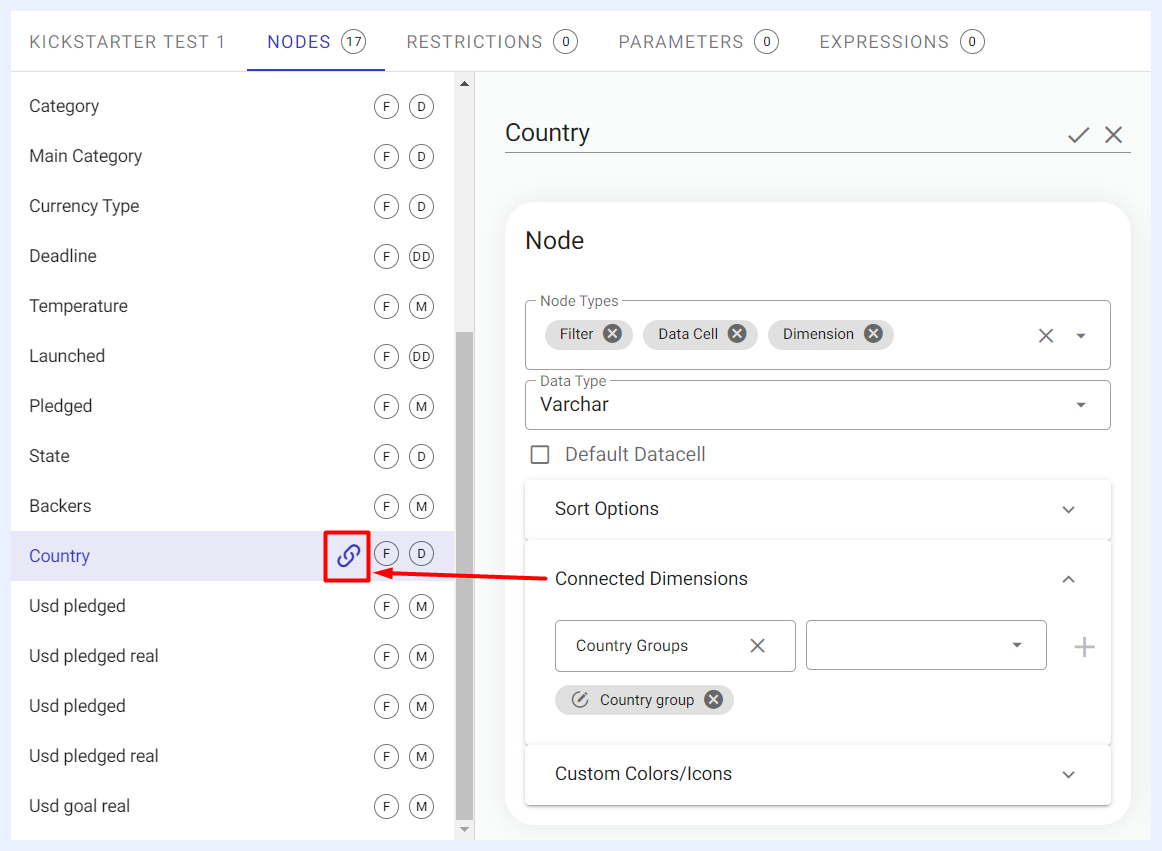
Customizing Colors/Icons for Dimensions on the View Level
For nodes/fields of type “Dimension”, the “Custom Colors/Icons” check box will appear automatically in order for the user to assign the required colors or icons that can be associated with the dimension values.
Triage values are red, yellow and green, so it is better to visualize those with their value colors.
If the same colors are to be used within multiple nodes, the color file can be exported and imported (in .json file format). You have the option to associate an image (by uploading it from your computer) instead of selecting an icon from the available ones in TURBOARD.
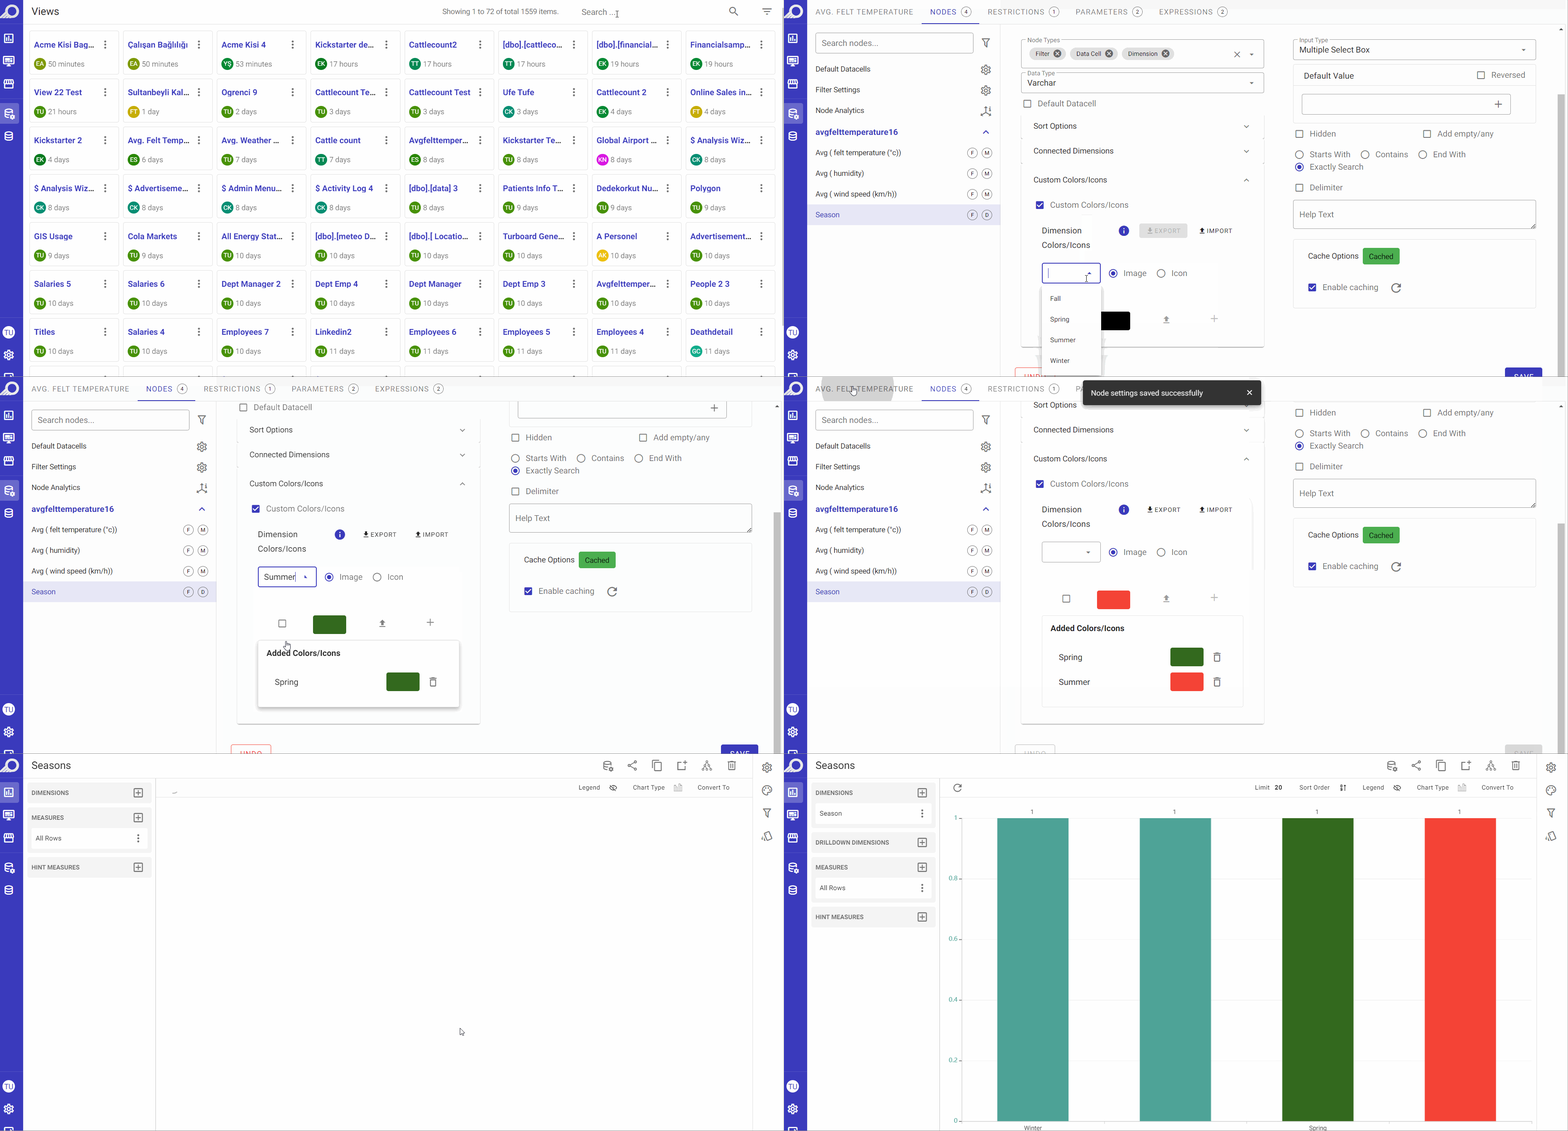 Custom Colors, Icons and Images
Filter Settings for Nodes
As all the nodes (fields) of the created view are set as filters by default, and unless the user did not disable/remove the filter from “Node Types” fields, the filter settings can be managed in the right-side panel named “Filter”. The panel auto-opens for any selected node that is marked as a “Filter” only.
- Input Type: a drop-down menu listing the HTML components that can be used for the selected filter. It determines how the filter will look like on the visualization it is used in like a “Radio Button” or a “Check Box” or a “Multiple Select Box” and so on. According to the node type, its data type and count, TURBOARD will activate the options that are appropriate to be applied on the filter from which the user can select from.
Note
The “Input Type” field will appear for cached filters as the HTML component type can be detected and displayed after the process of storing the results of the filter and evaluating its components is completed. So it may not appear immediately on creating the view.
- Default Value: if the default value (Min. and Max.) is set at the view page, it will be valid for all objects created from that view. In case of having different default values or no default at all, it should be customized at the dashboard's filter settings.
- Reversed: if checked, it will exclude the selected default values instead of filtering them in the used visualization.
- Hidden Filter: this option is used when, in some business cases, the filter is added but needs to be hidden from end-users.
- Add empty/any: to allow searching for any or empty items instead of a value. This option can be considered an alternative of the null and not-null in an SQL.
- Help Text: the text inserted in this field will appear with an “i” icon next to the related filter name at the resulting dashboard and will be displayed as a hint/tooltip.
- Enable caching: filter choices are the results of the min. and max. or group by/distinct queries. Since filter options are not changing very frequently, they are cached. “Cache Options” provides the configuration of caching.
Other Settings for Nodes Tab
Default Datacells PT Settings
By clicking “Default Datacells” option, a window will open listing all the datacell values in a non-pivoted table.
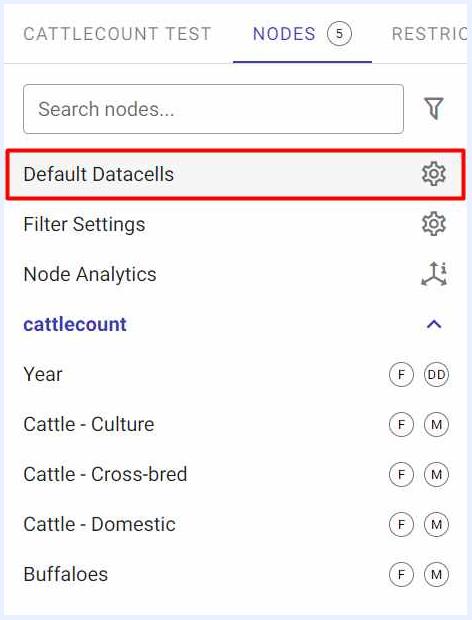
Through this option, you can set the default datacells and the pivoted table that will be created by default when a dashlet of type “Pivot Table” is added from this view. In other words, the table that you prepare and design in this section will be the default PT dashlet when created. Still, a Designer user can change those settings on the PT dashlet level.
Furthermore, the table that you prepare in this section will also be the default “Detail Table” when a dashlet is viewed in “Detail View” mode. i.e. from Detailed View option that is available for some dashlet types in dashboards “View” mode.
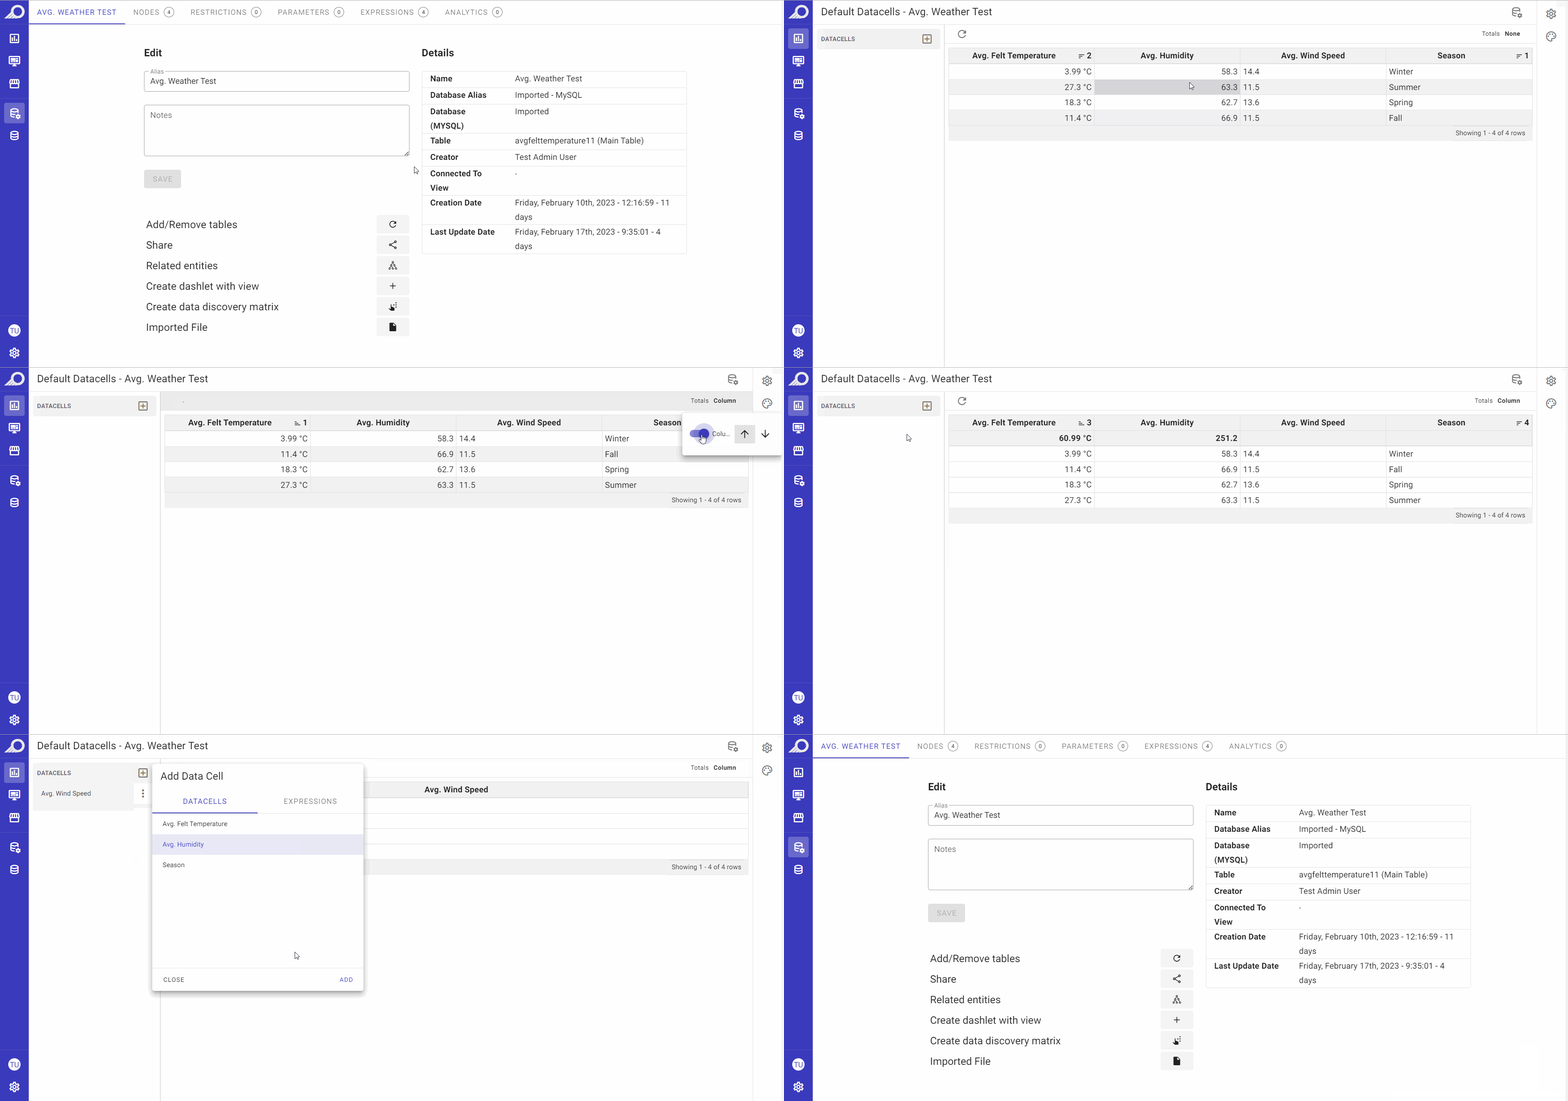
Also note that you may change the settings in this section any time needed. The latest changes will be automatically saved and displayed any time you click “Default Datacells” button again.
Additionally, while preparing your View (dataset), it is beneficial to be able to take a look at the data itself. This allows you to examine the data, identify missing values or outliers, spot errors or inconsistencies, and gain an understanding of the data distribution. By doing so, you can improve the accuracy, reliability, and suitability of the data for analysis, making it easier to draw meaningful insights from your analysis.
You can view and prepare the default table for new PT dashlets and/or detailed table views for other dashlets as below:
- Rows can be sorted descending or ascending.
- Totals of numeric data can be added to the top or the bottom of their related column/s using “Totals Column” button.
- The data can be filtered and ordered as desired.
- Other “Settings” and “Styling” options are available at the right-side pane. More details on how to use them can be found under Dashlets > Pivot Tables section.
Filters Settings
From Nodes tab > Filters Settings option, you may manage the general settings for all filters as below.
- “Filter Caching” refresh icon: used to refresh cache of all filters in the relevant view.
- “Auto Refresh” check box: if auto-refresh is needed/preferred for filter caching, its schedule is set on daily, weekly, monthly or yearly basis and the required date and time is determined as well.
- “Default Filter Min-Max Dates” check box: the date field changes by its nature. If the data is live, having min. and max. dates enables playing with live data in the filter.
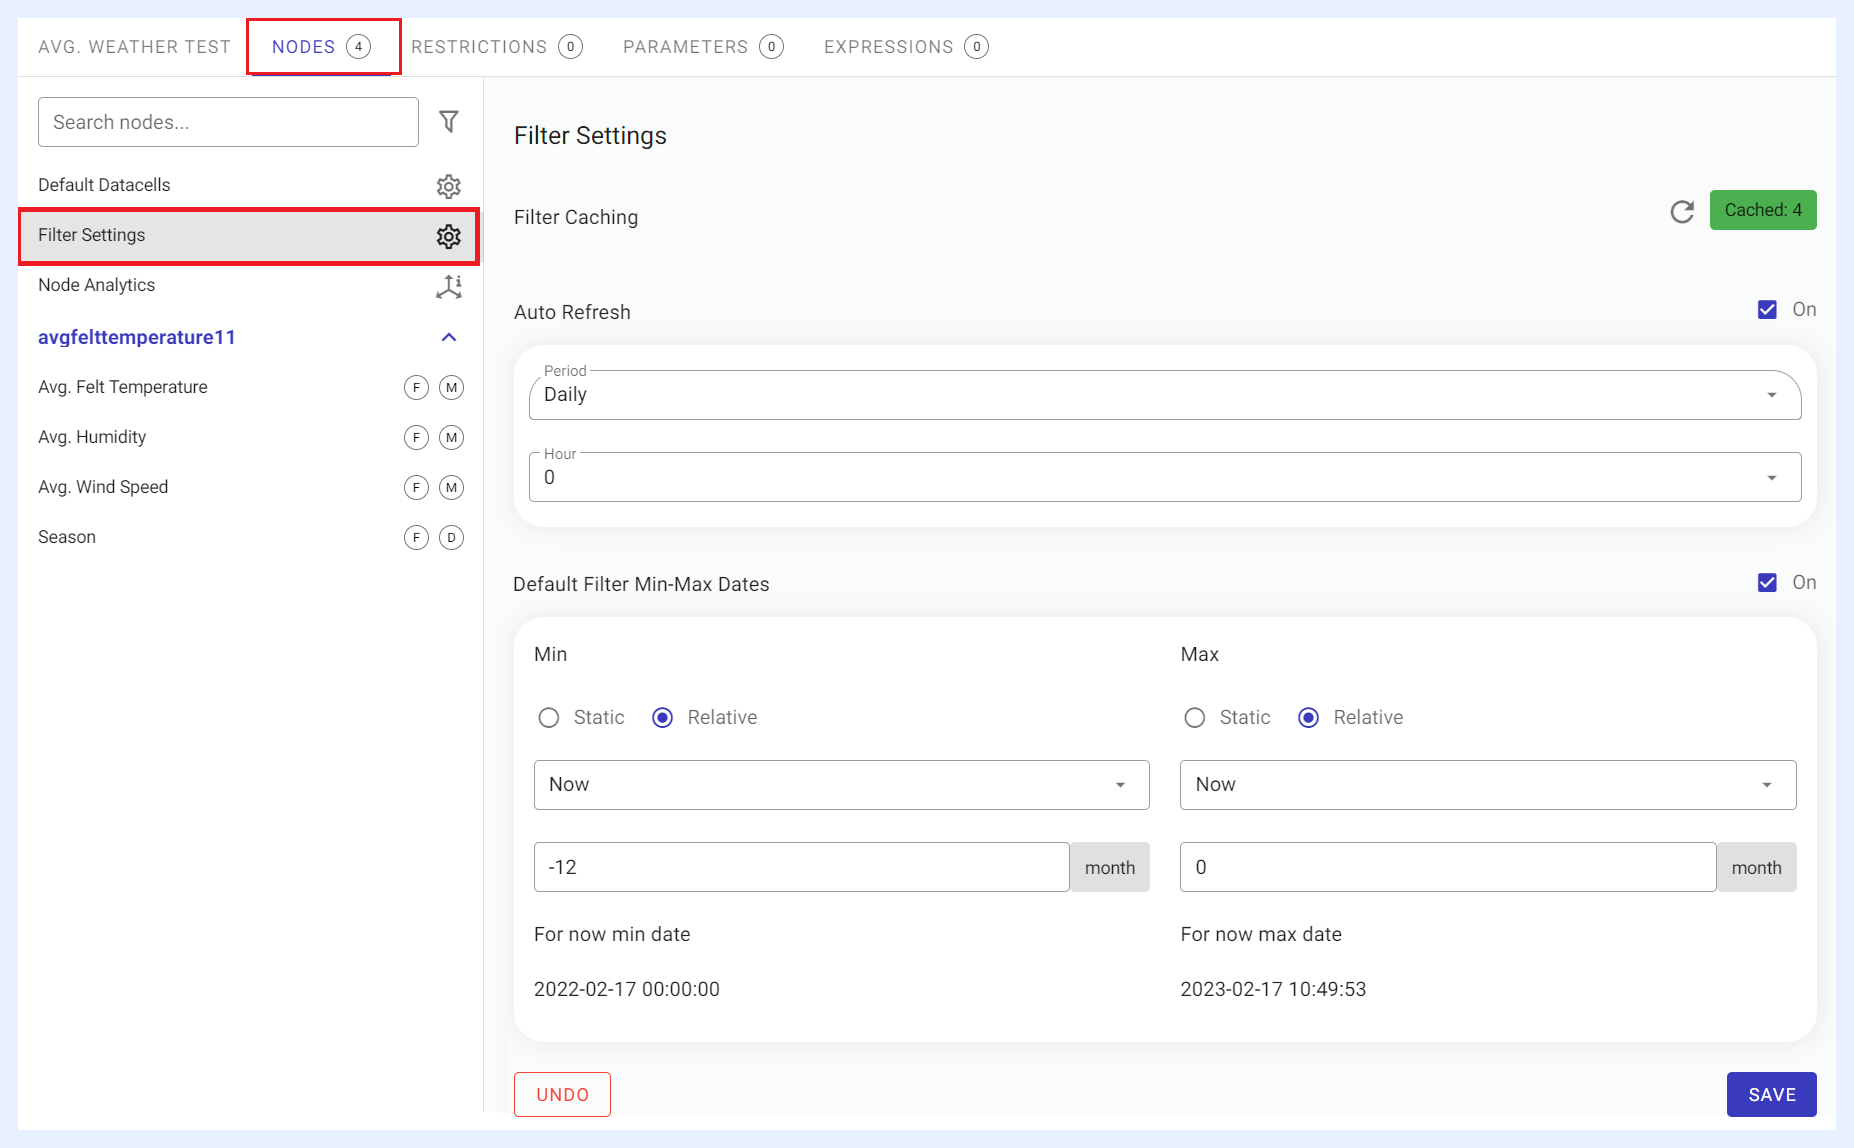 Filters General Settings
Node Analytics
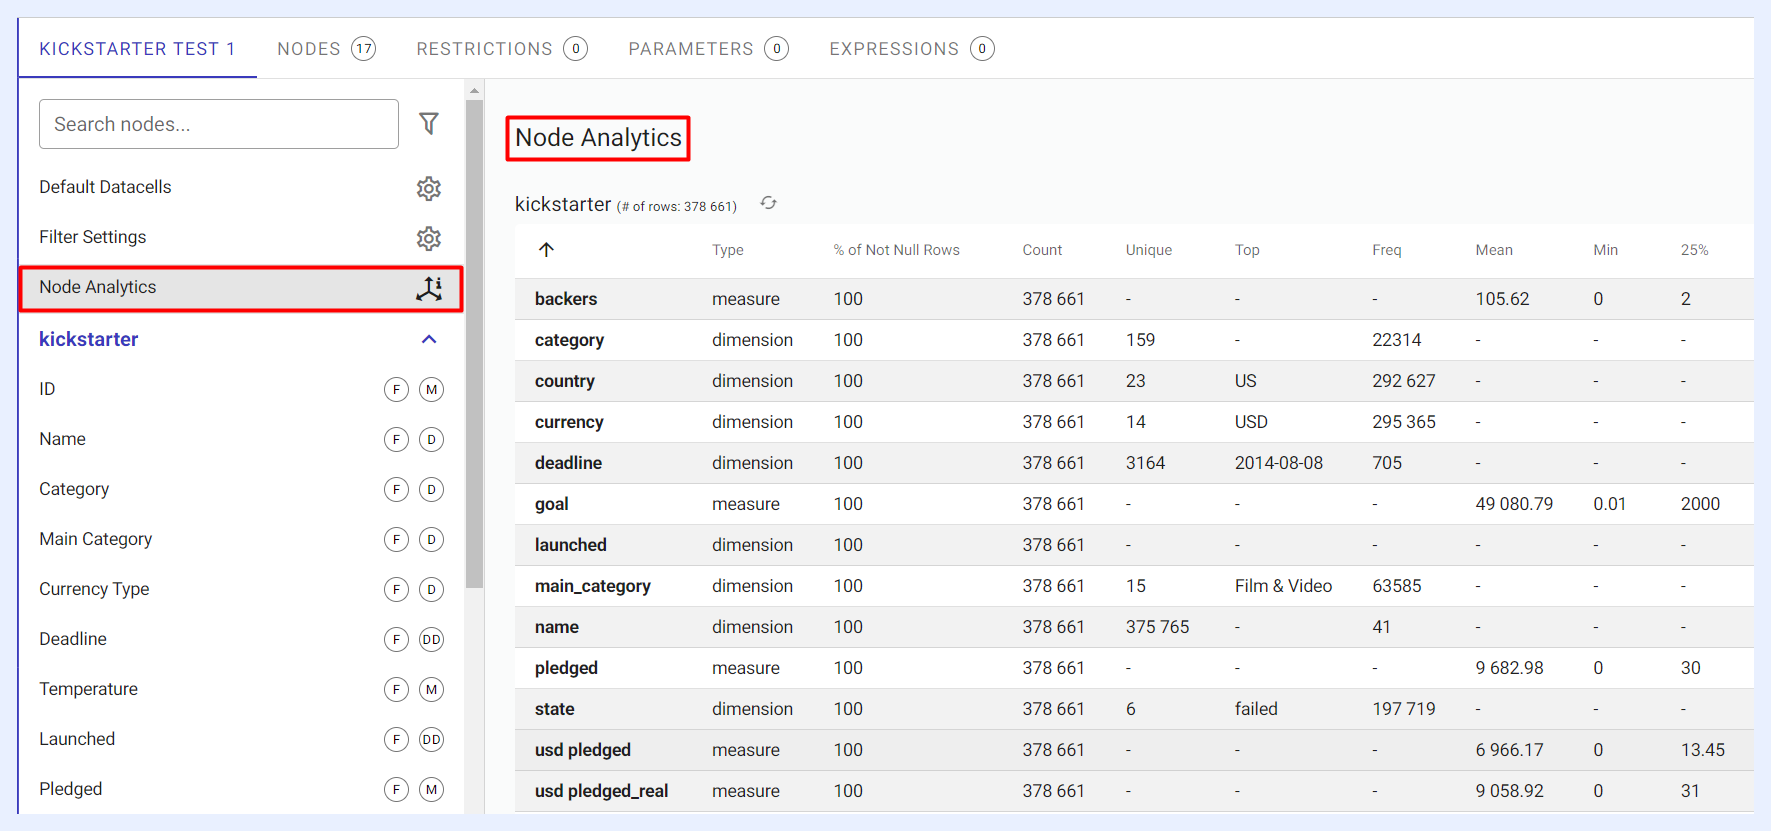
Before using a view (dataset) in a dashlet, analyzing it can bring about several benefits. By selecting the “Node Analytics” option, TURBOARD generates a report that includes various statistics on the nodes' types, such as the minimum and maximum values, mean, standard deviation, count, not-null count, unique values, top values, and more. This information allows you to gain a deeper understanding of the data, and use it to create meaningful visualizations in a dashlet.
Through such analyses, you can identify any data quality issues, pinpoint the most critical data points, and gain insights into the data's distribution, which can help you manage its settings and features more effectively.