Data Sources
According to TURBOARD terminology, any data source – either a database or a file – is called a data source. Data Sources contain digitized and formatted information. TURBOARD sends queries to databases according to the settings made in the view and uses the returned results to make the analysis.
TURBOARD mirrors the data source and creates queries using the dashlet. The data is never copied from the database, but the query is sent to the real data even if the schema is imported.
Supported Engines
Drivers for widely-used database engines are available at TURBOARD. They include: MySQL, Oracle, PostgreSQL, SQLite, Impala (Cloudera), MSSQL, Vertica, ClickHouse, and Snowflake, amongst others.
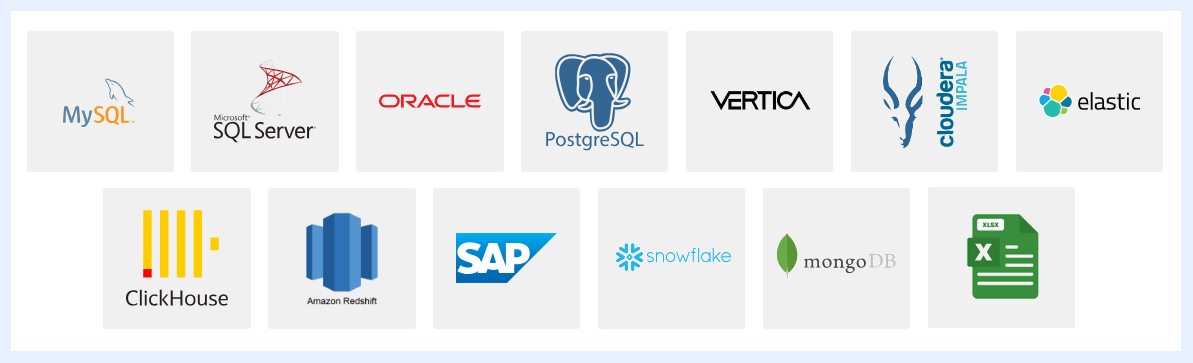
TURBOARD connects to these engines via ORM driver
How does TURBOARD connect to Data Sources?
TURBOARD can be directly connected to the database that is used for operational purposes. However, alternative options can be evaluated taking into consideration (1) the privacy and security of the data, (2) the possible additional burden that business intelligence screens may cause to the database, if used extensively for operational purposes.
Whether connecting directly to the data source, or via a data warehouse, or from excel files, there are considerations (pros & cons) to evaluate before deciding the connection as demonstrated below:
| Connection Type | Pros | Cons |
|---|---|---|
| Direct | ➤ Provides connection to live data with instant reflection of changes. ➤ Rapid progress as there is no data warehouse layer or excel automation process in between. |
➤ Cannot be recommended in case privacy criterion is of high priority. ➤ It may cause overload of sending high frequency select queries to the source database due to being a transactional medium. |
| Data Warehouse | ➤ A battle-proven method used when privacy is an issue. ➤ Has a direct driver of TURBOARD for widely used data warehouses: big data (Hadoop Impala), Vertica, Elasticsearch, and columnstores, etc. ➤ Ability to produce screens with much higher performance results as ETL processes will be built in parallel with the increase in analysis needs. ➤ Ability to schedule in a way that does not create a load on the source database. ➤ Does not include the data that is not needed for analysis, as it uses only tables and columns that will be the subject of analysis. |
➤ It provides close to live reflection depending on the data volume and the performance of the queries, yet it is still not 100% live. |
| Excel | ➤ No privacy/security barriers. ➤ Ability to update data with minimal effort when the data is transferred to the same excel format. |
➤ Inability to analyze with live data. ➤ There will be a continuous need to transfer the data from its database to excel files, and then to TURBOARD. ➤ Some problems may occur during the transfer process. |
Note
A data warehouse can be created with the fast ETL (Extract, Transform and Load process) tool within TURBOARD platform. It is necessary to provide a connection to the source database for this ETL process, which also allows setting up the process at regular intervals. For information on alternative ETL tools, contact support@turboard.com.
Tables & Data Source Connections
As TURBOARD has the ability to connect to multiple data sources seamlessly and at ease, it simplifies the process of cross-analysis and helps users get insights faster as it can run multiple queries on multiple data sources and/or datasets for the same dashlets and/or dashboards.
- Users can connect different data tables from the same data source together in order to create multiple datasets and analyze data in dashlets from multiple tables.
- Users can connect nodes from different views (datasets) and different data sources to be analyzed in the same dashlet.
- Users can merge filters in a dashboard to allow comparing and filtering data from different datasets and different data sources through a single filter that can be applied to the different dashlets in that dashboard.
| CONNECTED TABLES | CONNECTED NODES | MERGE FILTERS | |
|---|---|---|---|
| Connection | Star Schema | DATABASE-to-DATABASE | TABLE-to-TABLE or DATABASE-to-DATABASE |
| Requirement | Dashlet from multiple tables at the same database. | Dashlet from multiple databases. | Dashboard from either multiple tables or multiple databases. |
| Limitation | Tables are connected with inner join. | Field values should match. | Field values should match. |
| How to? | 1 Make sure the tables are connected at the datasource.2 Create a “View” using all the tables included in the star schema. |
1 Go to any of the views that have a common field with another datasource.2 Select the node (it should be a dimension).3 Select the connected view and the field at the other datasource on the right handside of the node details page.4 Multiple connections from one node is possible.5 Adding the connection to one of the views is enough. |
1 Create a dashboard.2 Add dashlets from different datasources.3 Go to “Filter” settings and click on “Add merged filters”.4 All the nodes that belong to different views will be listed and grouped by their views.5 Select the nodes that are common and save. |
| Process | Inner join select query from multiple tables at the datasource. | Multiple select queries run on the connected datasources. | Multiple select queries run on the connected datasources. |
| Result | ✅ Data from multiple tables in the same dashlet. | ✅ Data from multiple datasources in the same dashlet. ✅ Eliminates the need for ETL to cross multiple databases. |
✅ Data from multiple tables or datasources in the same dashboard. ✅ Eliminates the need for ETL to cross multiple databases. |