Managing Dashboards
Dashboard Playground Sections
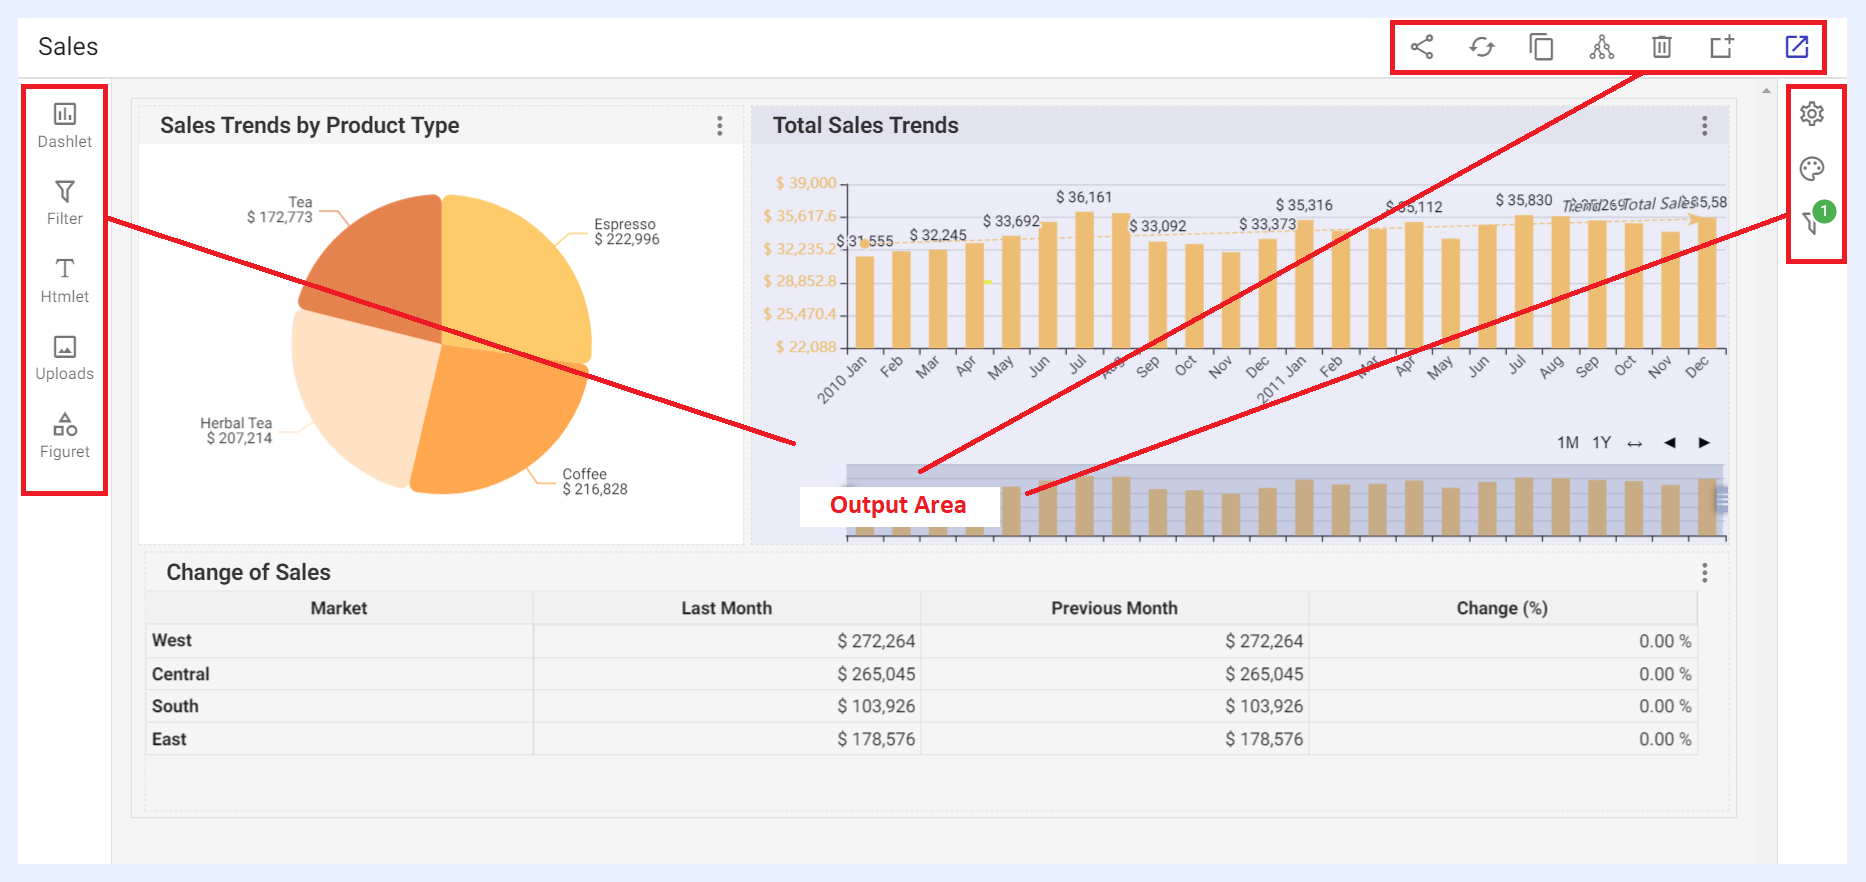
The page where the dashboard is configured (add/edit mode) is called the playground (PG) in our terminology and it consists of various controls and panels to allow configuring the design, components and settings of the dashboard. These are:
- Output Area
- Quick Actions Ribbon
- Components Addition Panel
- Dashboard Settings and Configuration Panel
Output Area
The output area is the result of the added components of the dashboard. It interactively responds to the designer's selected settings and configurations. The components in the Output Area can be relocated and resized by moving each component (whether for example a dashlet, an Htmlet or a filter) or resizing it with the mouse.
Quick Actions Ribbon
At the top-right side of the dashboard’s add/edit window, several icons are available to apply general actions on the dashboard.

| Dashboard Quick Action Icons Explained | |
|---|---|
| Share: | to share the dashboard and make it available to either for public or with defined user(s) and/or group(s). When a dashboard is shared with “Can View” privilege, shared users will only be able to view the dashboard. When it is shared with “Can Edit”, shared users can apply changes to the dashboard settings as well. This option can also be accessed from the dashboard’s ellipsis menu in the dashboards’ listing window. |
| Refresh dashboard and dashlets data cache: | to update the data displayed on all the dashlets of the dashboard by reloading the temporary storage location (cache) where data is stored. |
| Copy: | to duplicate and copy the dashboard with the same settings and/or components but under a different name, where you have the option to open it in the current window or in a new tab/window. |
| Share meta info: | when clicked, a pop-up window opens listing the related data source/s, the view/s and the dashlets that the dashboard depends on. This option can also be accessed from the dashboard’s ellipsis menu in the dashboards’ listing window, namely the “Meta Info” option. |
| Remove: | to delete the dashboard. |
| Add to the selected showcase: | to add the dashboard to an existing showcase by selecting the required showcase in the overlay window that opens then clicking ADD button, or to add it to a new showcase through + CREATE A NEW SHOWCASE button that is available in the same overlay window. |
| View dashboard: | to view the resulting dashboard (View mode) and how it will be displayed for end-users. |