Element Properties and Layout Settings
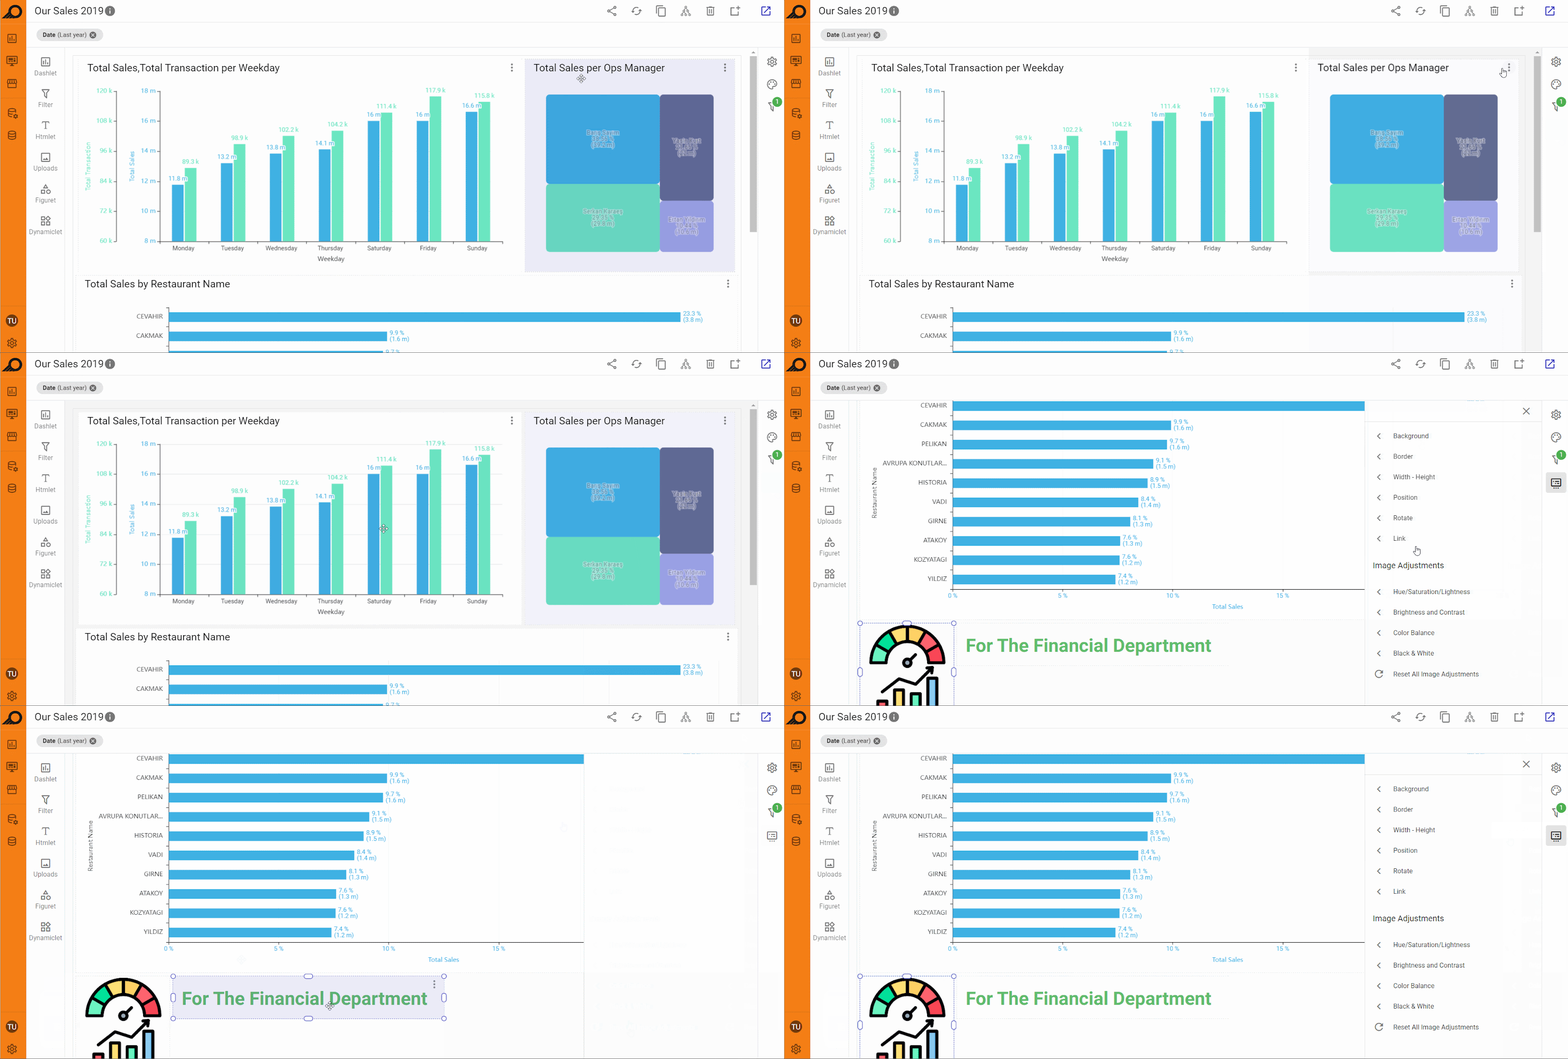
As a designer user, you can customize and adjust the layout, styling, and formatting of any element added to the dashboard (including dashlets, Htmlets, figurets, filters, or other types of elements) through the Box Style & Layout pane. This pane can be accessed by selecting the ellipsis menu on the right corner of the element or by selecting the element directly in the dashboard “Edit” window.
The available options vary depending on the element type. For instance, when a figuret or image is selected, additional settings like adding a clickable link, adjusting padding, rotating the element, etc. are available.
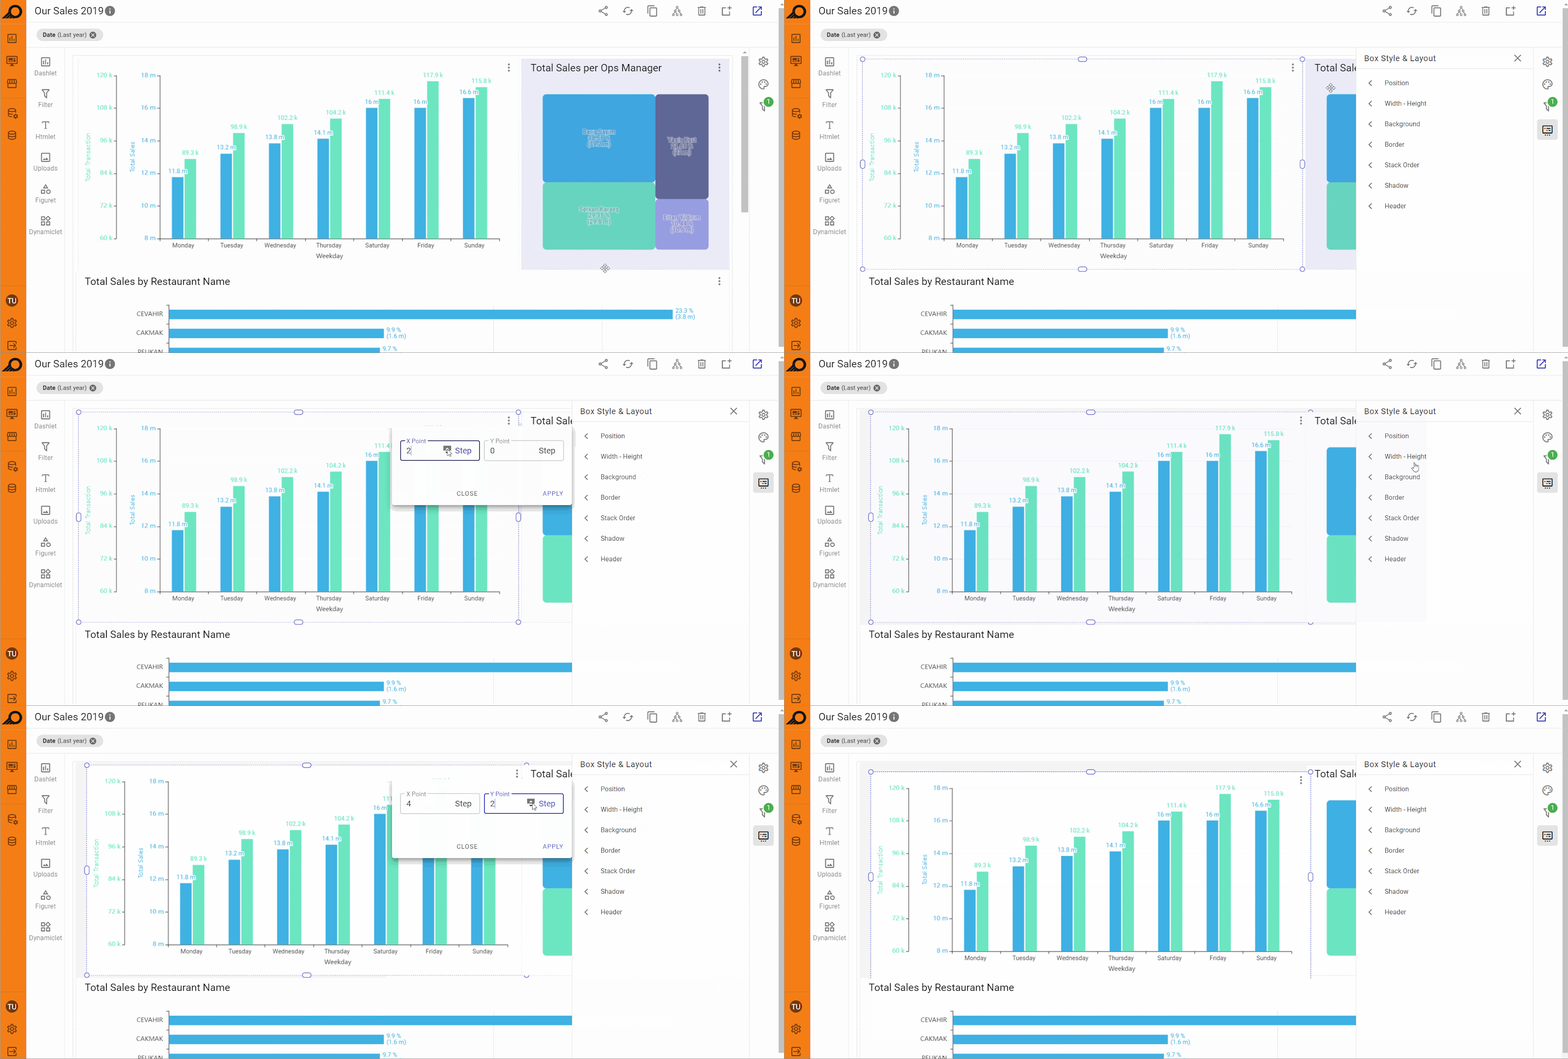
1 “Position” options: this feature allows you to specify the exact position of the selected element by entering specific units in steps, instead of relying on drag-and-drop. Each step corresponds to a dynamically adjusted unit based on the browser or screen width, ensuring that the element’s position is consistently aligned across different devices. This provides more control over the precise placement of elements within the dashboard.
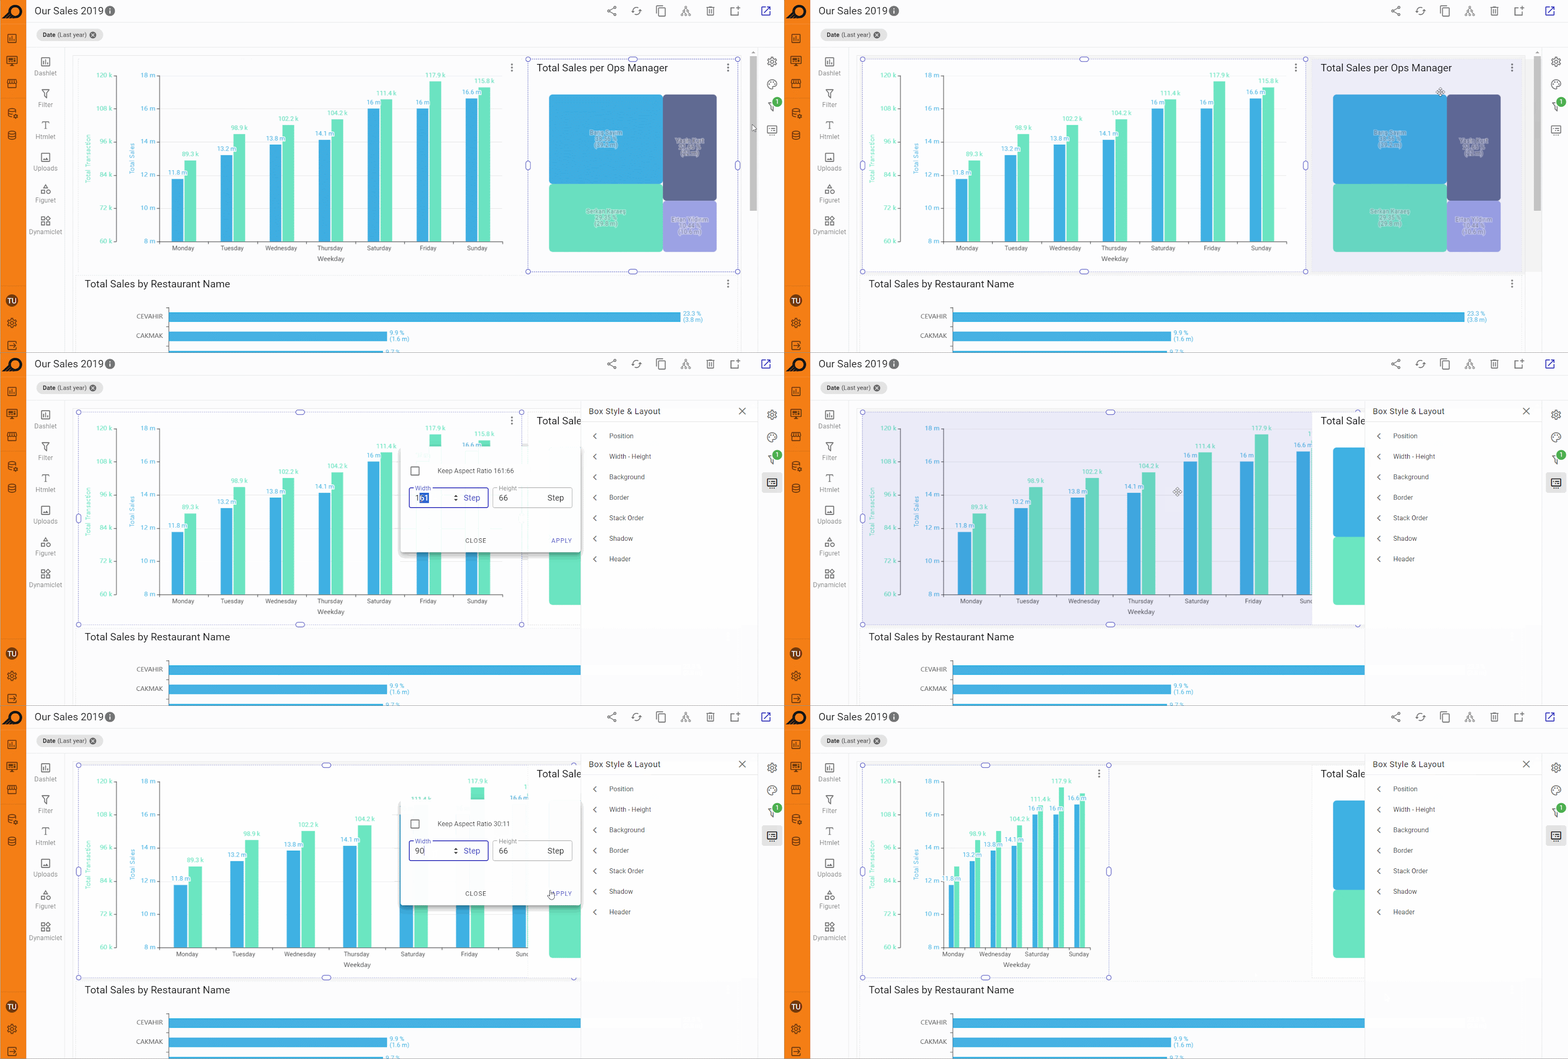
2 “Width - Height” options: using this feature, you can set the precise width and height of an element by entering their required values in the relevant fields. The maximum width of any element is 240 steps, which represents the full width of the dashboard. If a value greater than 240 is entered in the width field, it will automatically be adjusted to 240 steps. This limit ensures consistency in layout and design, helping to maintain proportionality across different dashboard elements, especially when precise control over element size is required.
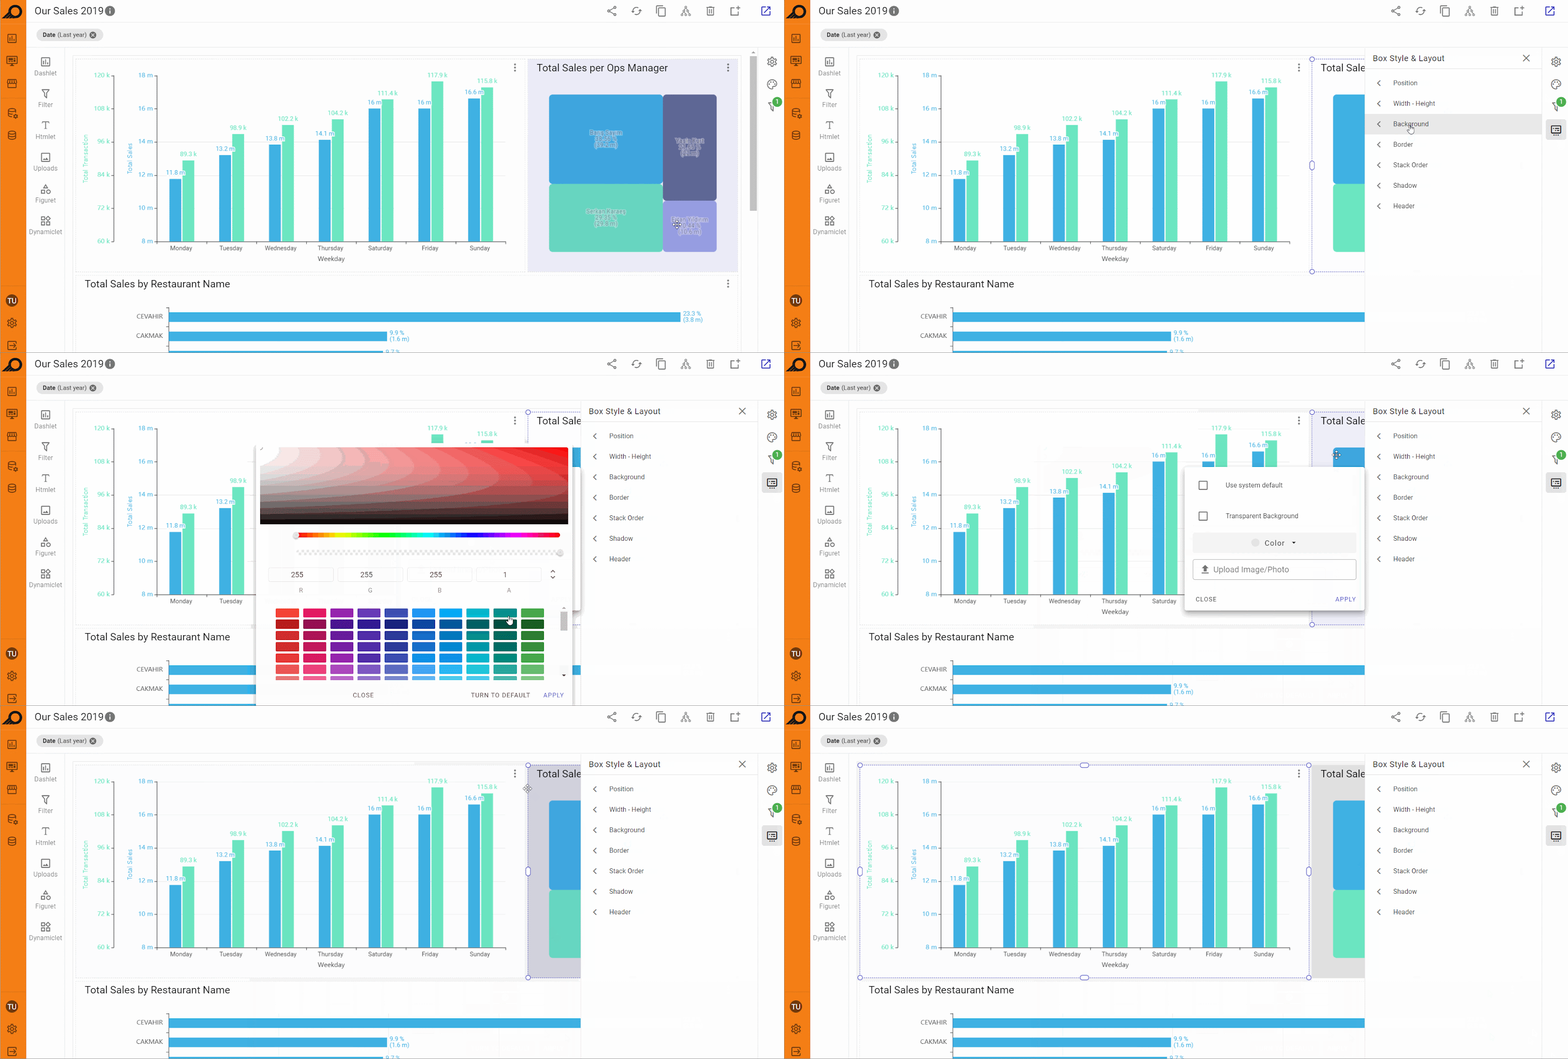
3 “Background” styling options: customize the background of the selected element by choosing from several options. You can use the system default background, select a transparent background, apply a solid color, or upload an image from your device to set as the background. This flexibility allows you to tailor the look and feel of individual elements to align with your dashboard's design and branding.
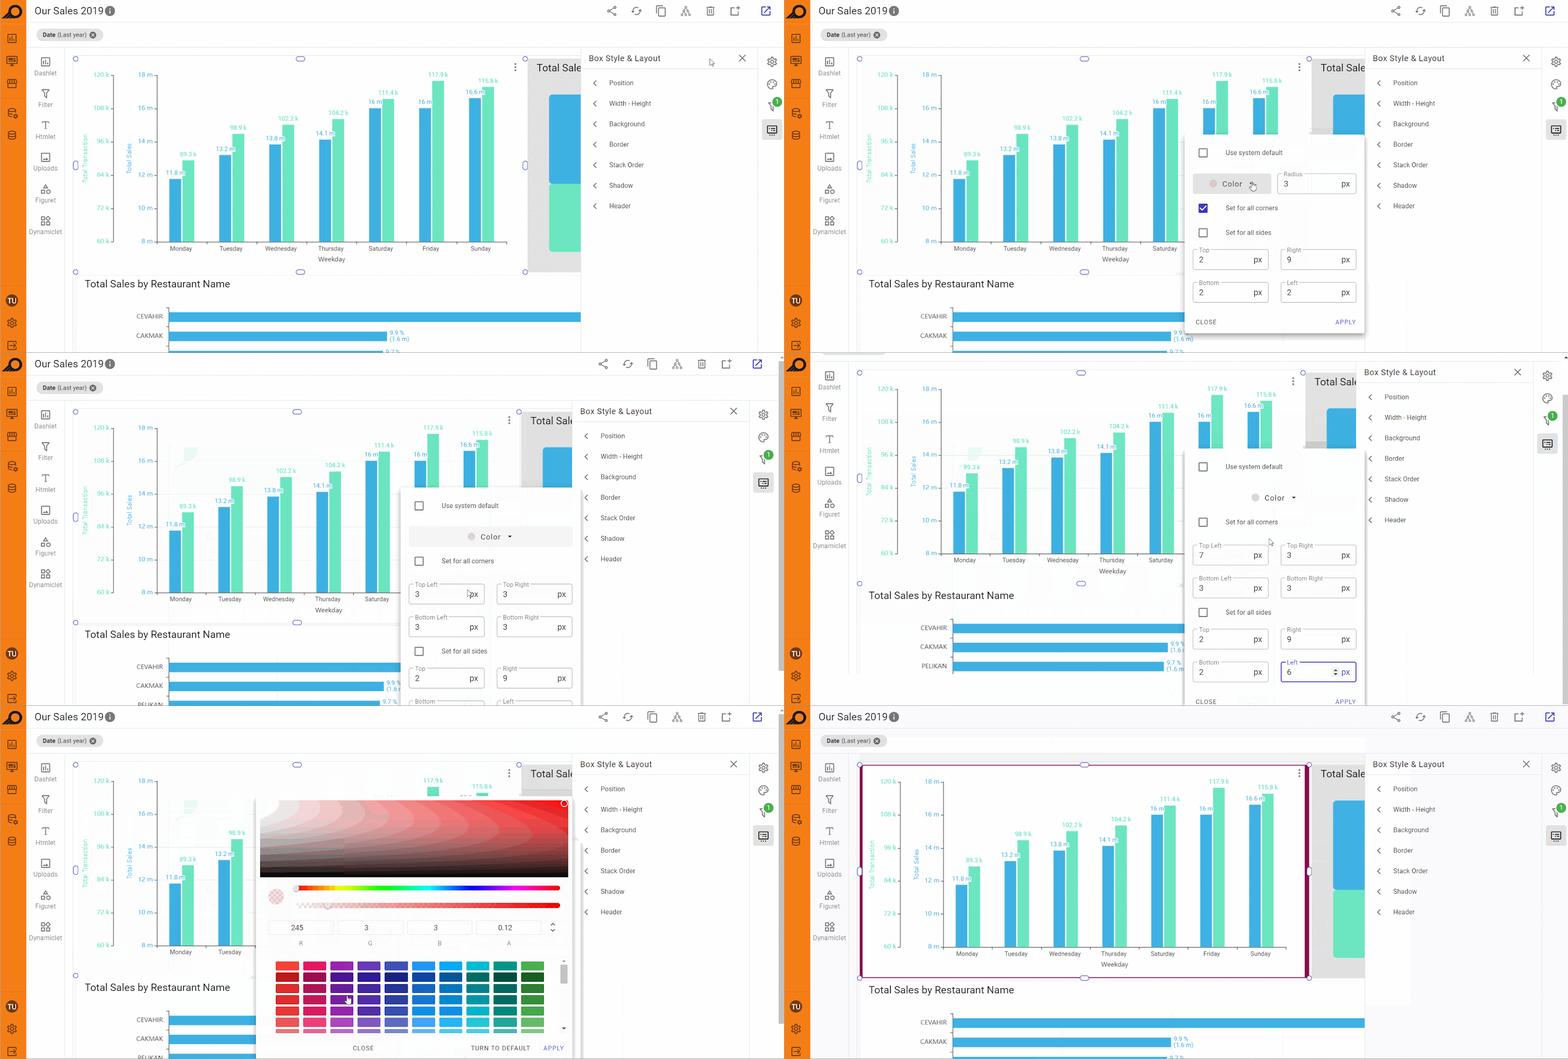
4 “Border” styling options: this feature allows you to add a border around the selected element and adjust its color, thickness, and corner radius. You can apply different styles to each side of the border (e.g., different colors or thicknesses), or use a uniform style for all sides. Additionally, you can set whether the corners should be sharp or rounded, allowing for greater customization of the element’s appearance.
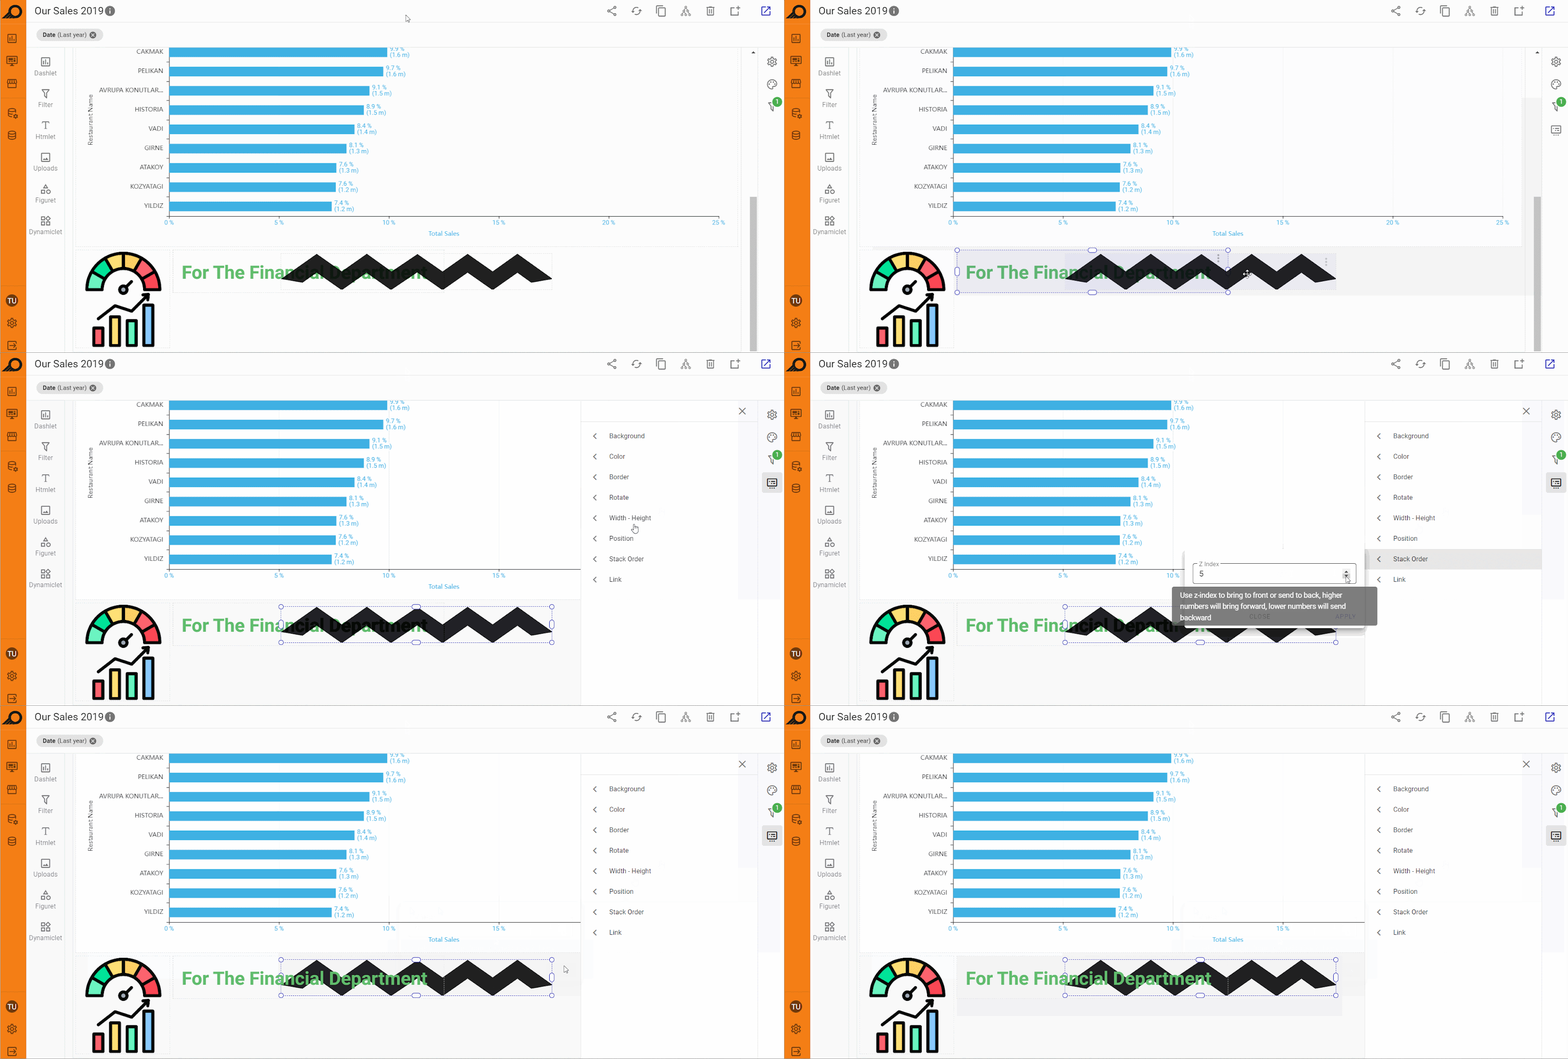
5 “Stack Order” options: when this option is selected, the “Z Index” field appears in the side pane. This setting controls the layering of the element relative to others. A higher Z Index value brings the element to the front, while a lower value pushes it to the back. This is especially useful when dealing with overlapping elements, transparent images, or backgrounds, ensuring the correct layering and visibility of important content.
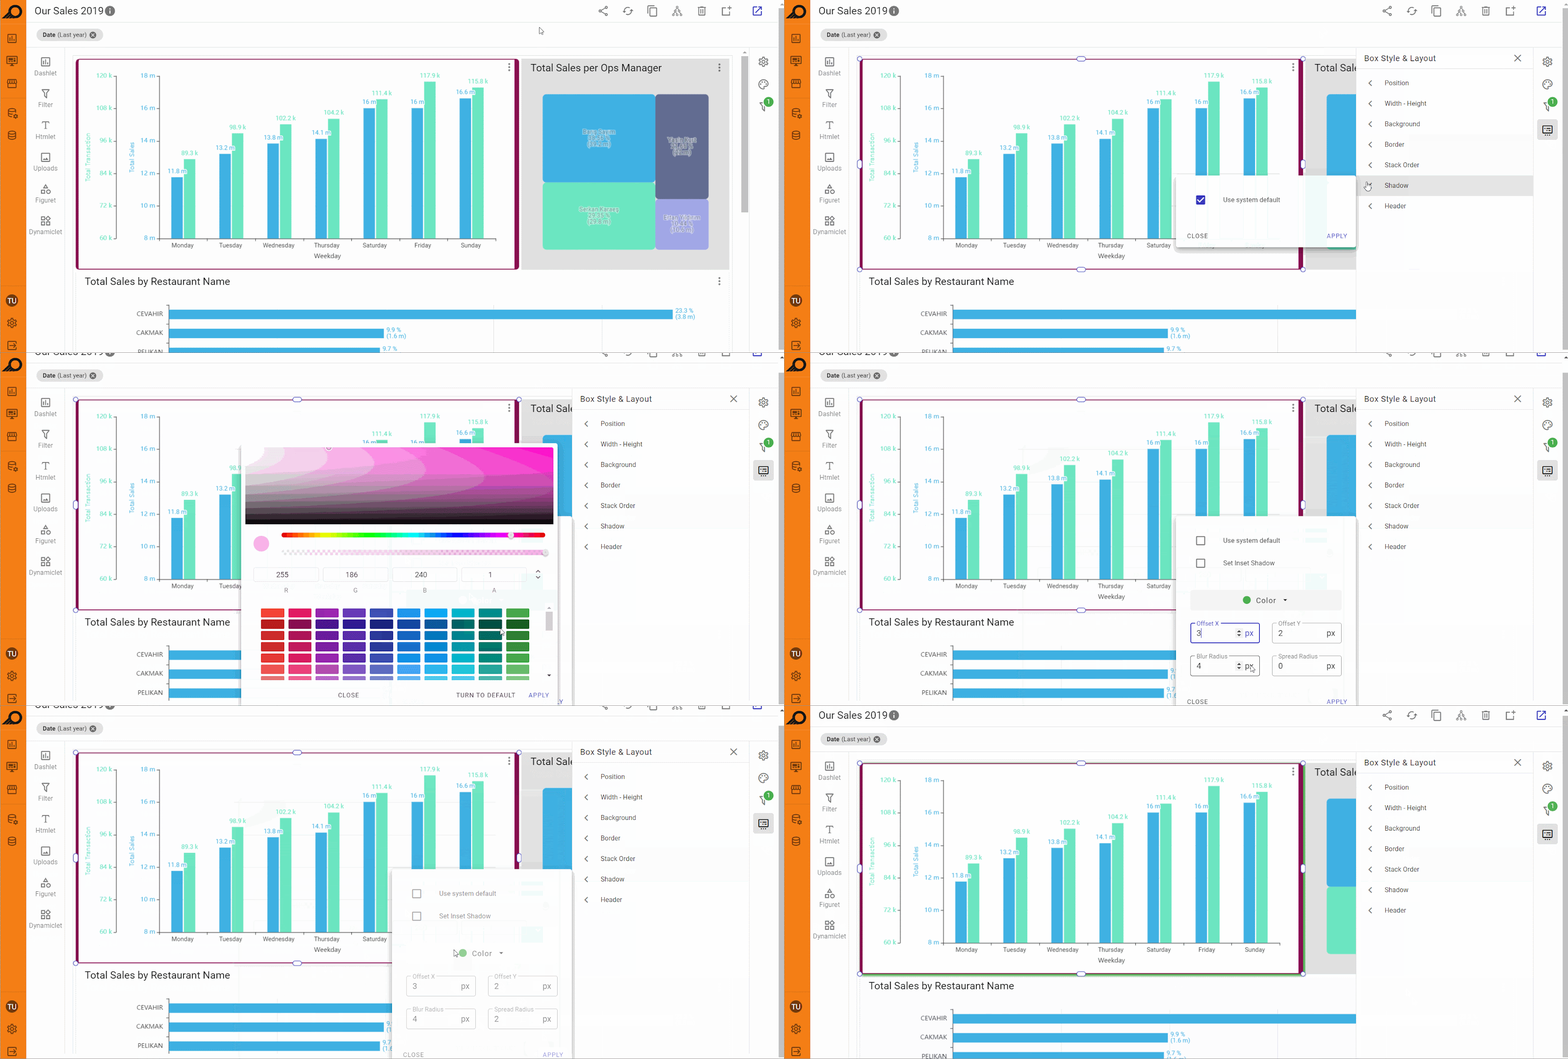
6 “Shadow” styling options: the shadow options pane includes two checkboxes: “Use system default” and “Set Inset Shadow”. If the “Use system default” box is unchecked, users can manually adjust the shadow settings. This includes selecting a shadow color and adjusting parameters such as Offset X, Offset Y, Blur Radius, and Spread Radius (all in pixels). These controls give you detailed customization over the shadow effect, allowing you to enhance the element’s appearance and depth.
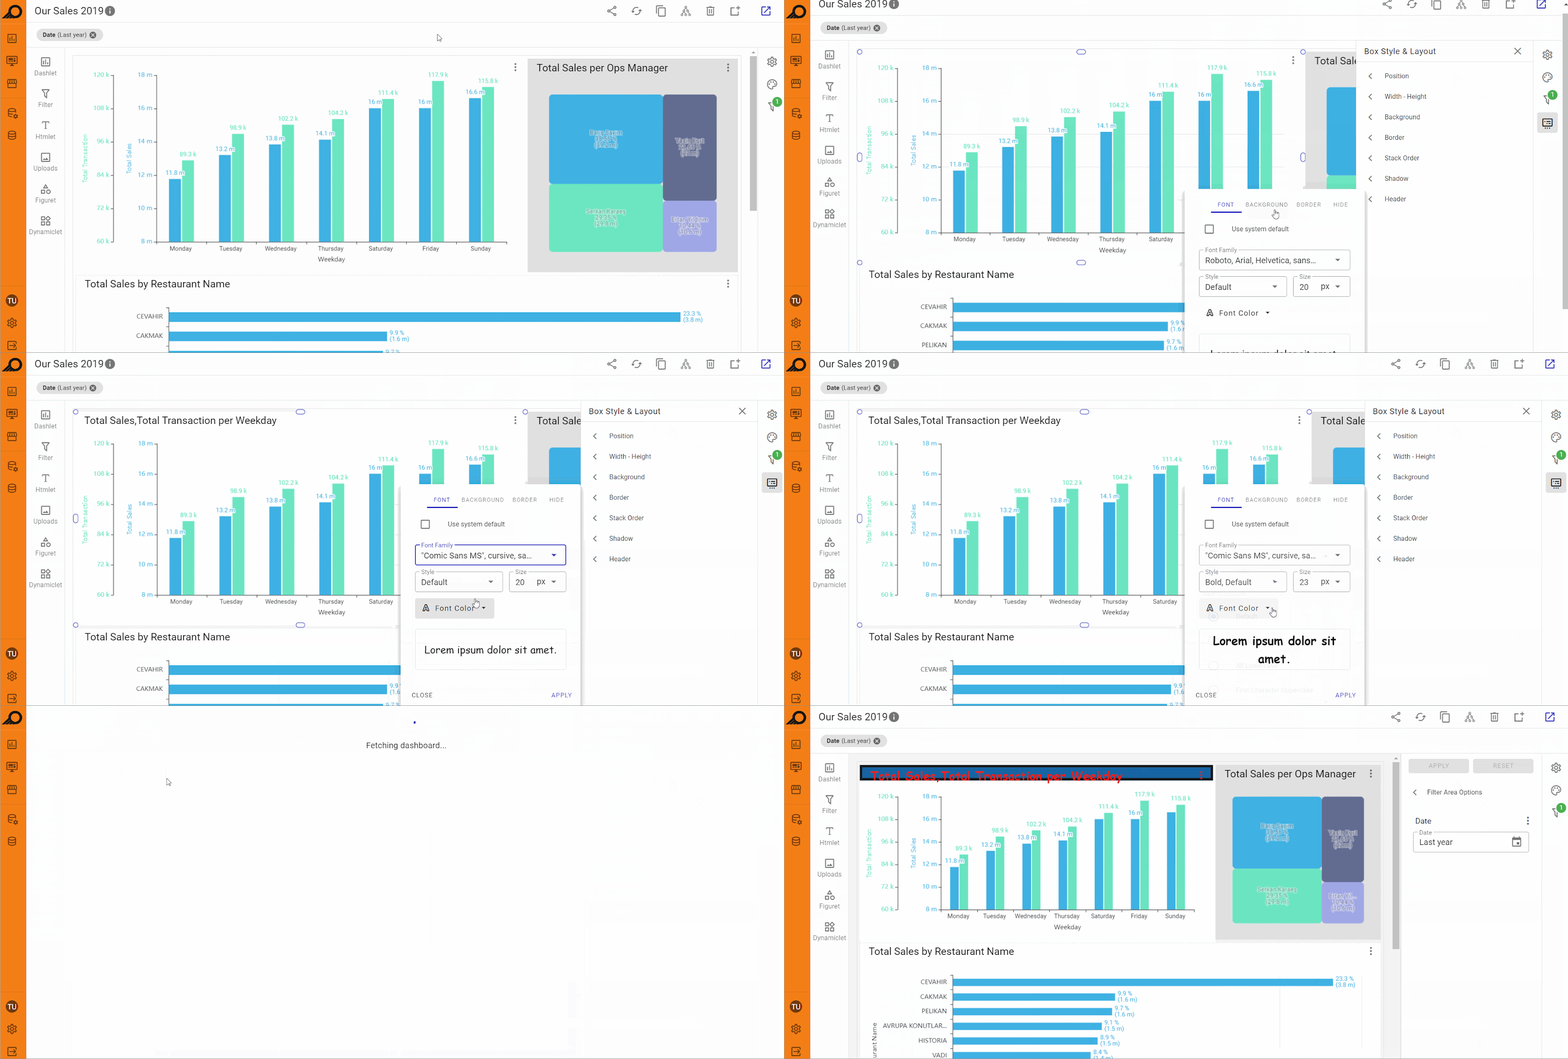
7 “Header” styling options: this option primarily applies to elements like dashlets that have a title or header. Users can customize the font color, size, and style of the title, and also adjust the border around the header in terms of color, thickness, and corner radius. Additional background options for the header include choosing between transparent, system default, or a solid color. A checkbox is also available to toggle the visibility of the header.
Dashlets Settings Inside Dashboards
Dashlets that are added to the dashboard can be managed through the ellipsis menu available at the right-top corner of the dashlet area. Users can apply several actions on the dashlet as below:
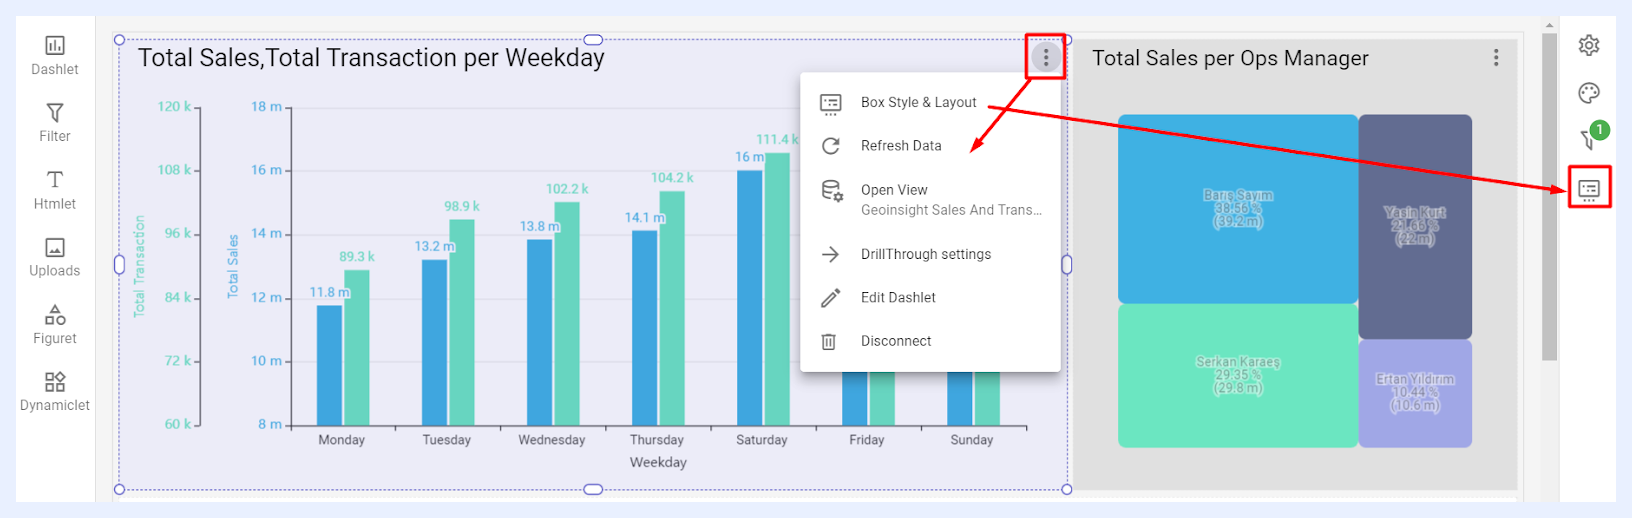
1 Box Style & Layout: when selected, it opens the “Box Style & Layout” pane at the right side of the Dashboard “Edit” window.
2 Refresh Data: when selected, it will refresh the data cache for the relevant dashlet.
3 Open View: when selected, it opens the related view edit window to allow the user to edit the nodes and manage the settings of the relevant view.
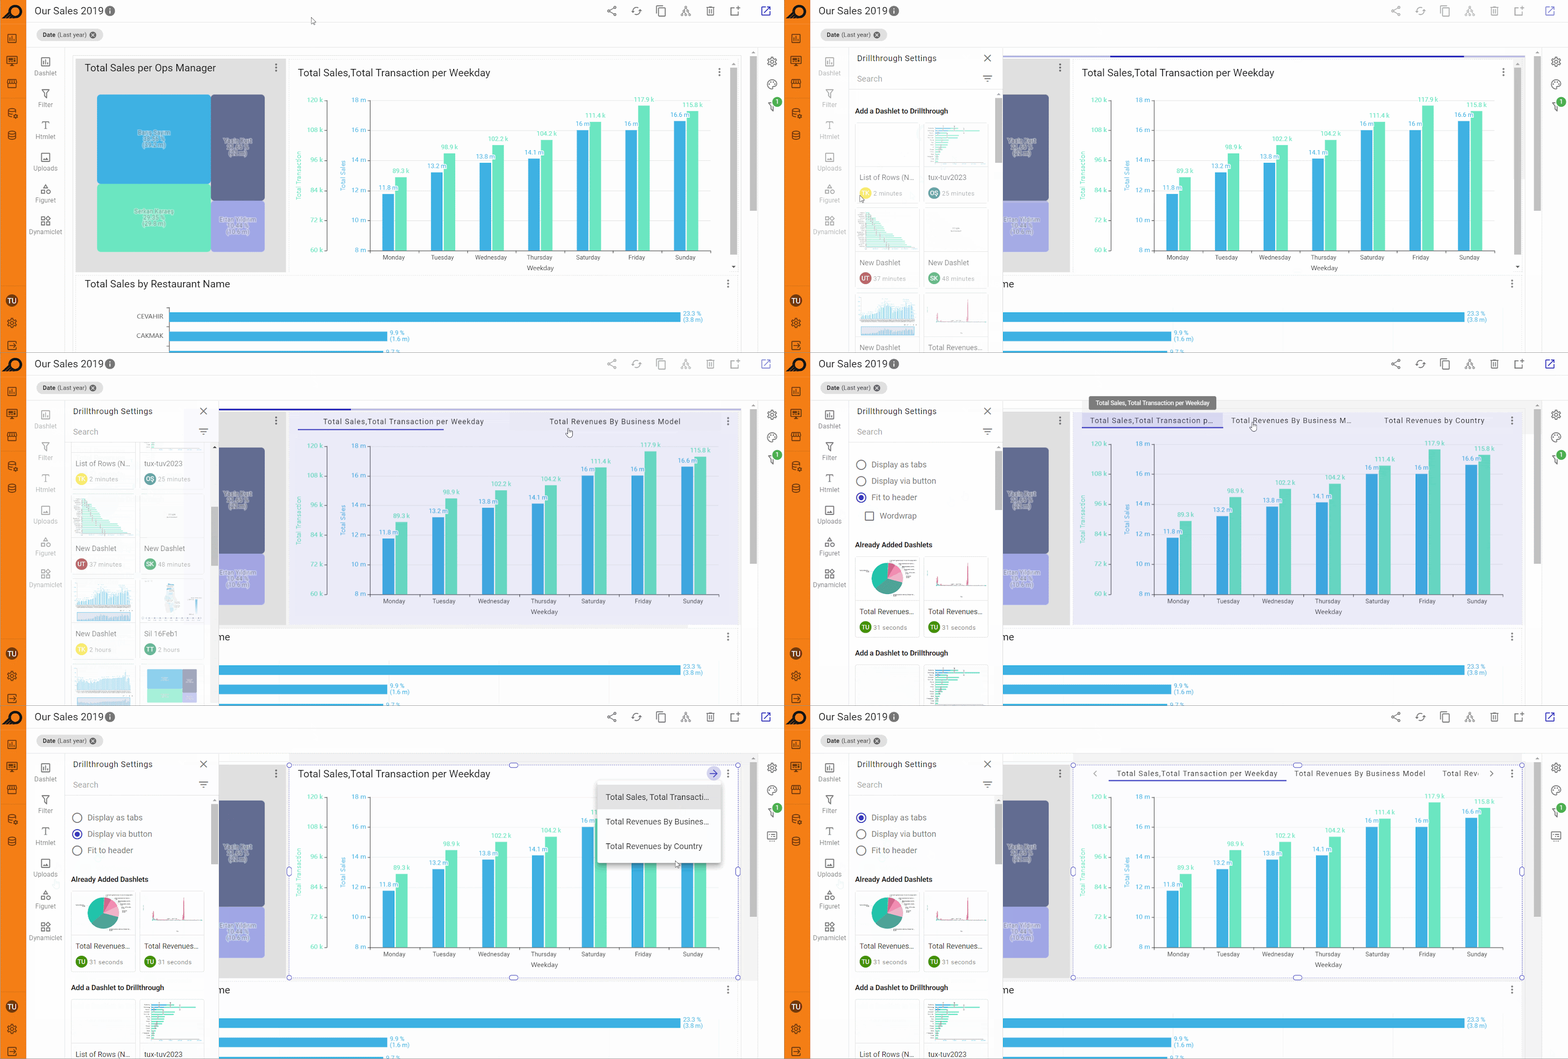
4 DrillThrough Settings: when selected, it allows applying horizontal leveling and grouping several dashlets horizontally together either as tabs with the option to fit them all on the dashlet header, or navigating between them using a clickable arrow button, or as a drop-down list at the right-top of the main dashlet area. DrillThrough is generally preferred if your dashboard has multiple dashlets and looks vertically too long or requires much scrolling or has multiple pivot tables. When applied, all the added dashlets will appear at the top of the relevant dashlet and viewed by navigating between them as tabs or using the arrow button to open them as a drop-down menu.
5 Edit Dashlet: when selected, the dashlet edit window opens to allow the user to edit the dashlet if required.
6 DISCONNECT button: to remove the dashlet from the dashboard.
When a dashlet has dynamic measure(s) configured, each dynamic measure has its own Settings Menu (accessible via the ellipsis icon on the dashboard). From this menu, designers can configure measure-specific limitations (min/max value ranges), axis title position, and a non-default chart type for that specific measure independently.
Designers can also add a configurable Action Button to any dashlet's ribbon on the dashboard. The button can link to another dashboard, a showcase, or an external URL, with options to transfer the current filter state to the destination and to open in a new tab.