Chart Measures
Measures Settings and Preferences
Under the “Nodes Pane”, all “Measure” nodes are grouped together, along with any expressions that were added as measures.
When selecting a measure to be added or aggregated in a dashlet, its settings, functions, and features can be managed from the ellipsis menu associated with that selected measure.
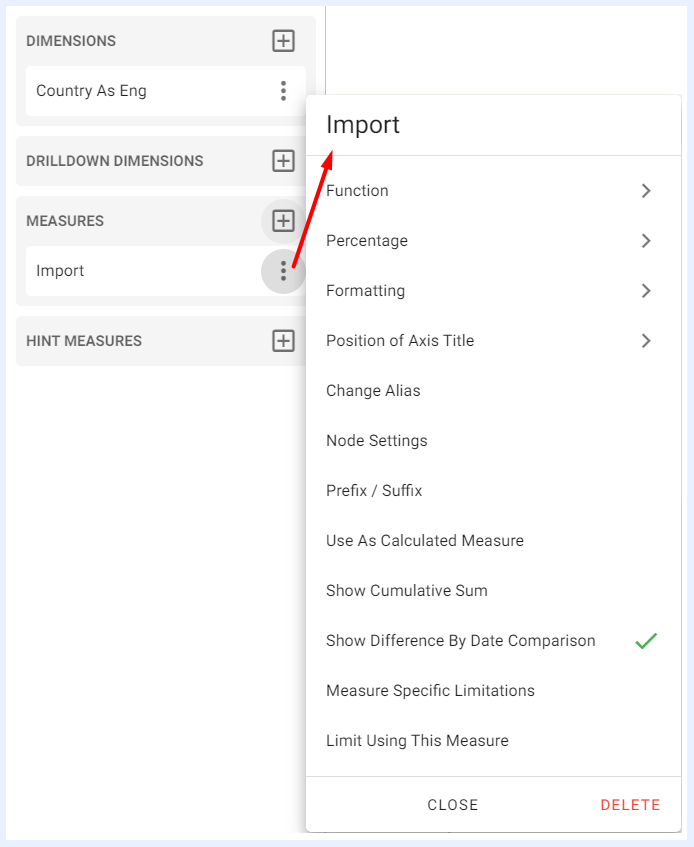
Measures Function Settings
1. Function
The selected function is applied to aggregate the measure. The set of available functions are:
- Avg: calculates the average of all values in the selected measure.
- Sum: calculates the sum of all values in the selected measure.
- Min: returns the minimum value in the selected measure.
- Max: returns the maximum value in the selected measure.
- Count: counts the number of values in the selected measure.
- Distinct: counts the number of unique values in the selected measure.
- StdDev: calculates the standard deviation of the values in the selected measure.
- Variance: calculates the variance of the values in the selected measure.
This feature is available for charts, pivot tables, info cells/gauges and regional maps dashlets.
2. Percentage
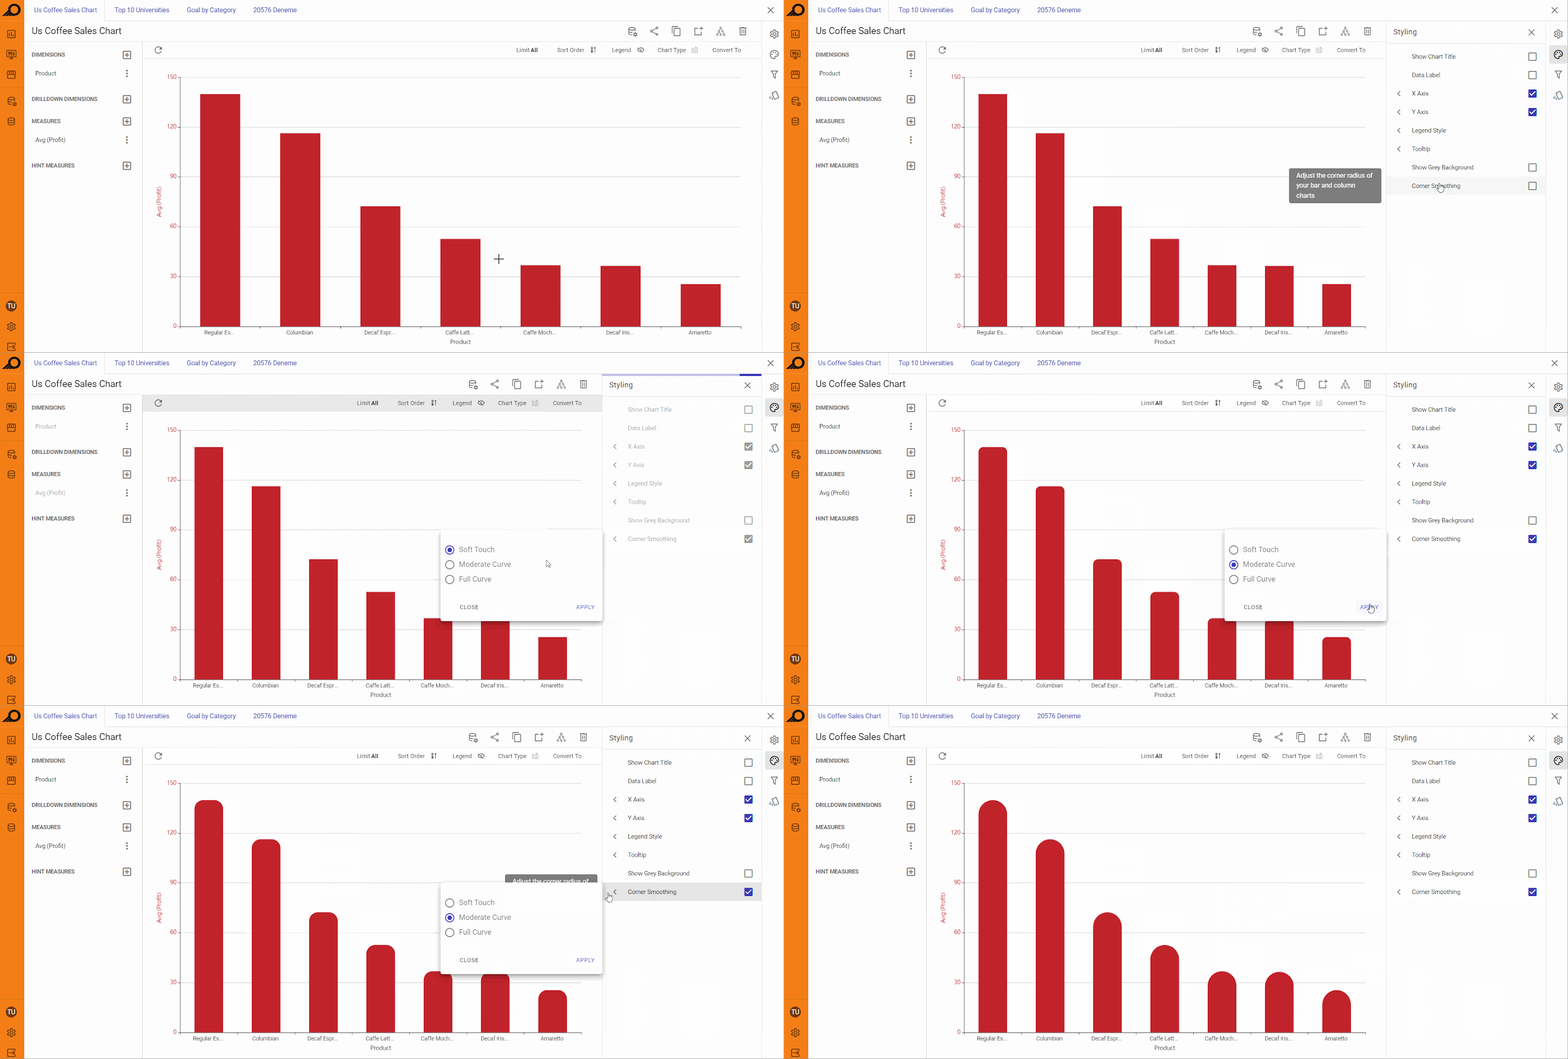
Used to convert the displayed value to percentage, or to display the results as both value and percentage. If there are two dimensions, the “Percentage” sub-menu displays 2 options: Percentage on dimension 1 to display the percentage for the first applied dimension, or Percentage on dimension 2 to display the percentage for the second applied dimension. This feature is available for charts and regional maps dashlets as well.
Value <> Percentage Conversions in a Chart Dashlet
3. Formatting
Advanced numeric formatting options are available under “Formatting” menu and by default are abbreviated (if not changed at node in the “View” level).
This feature is available for charts, pivot tables, info cells/gauges and regional maps dashlets.
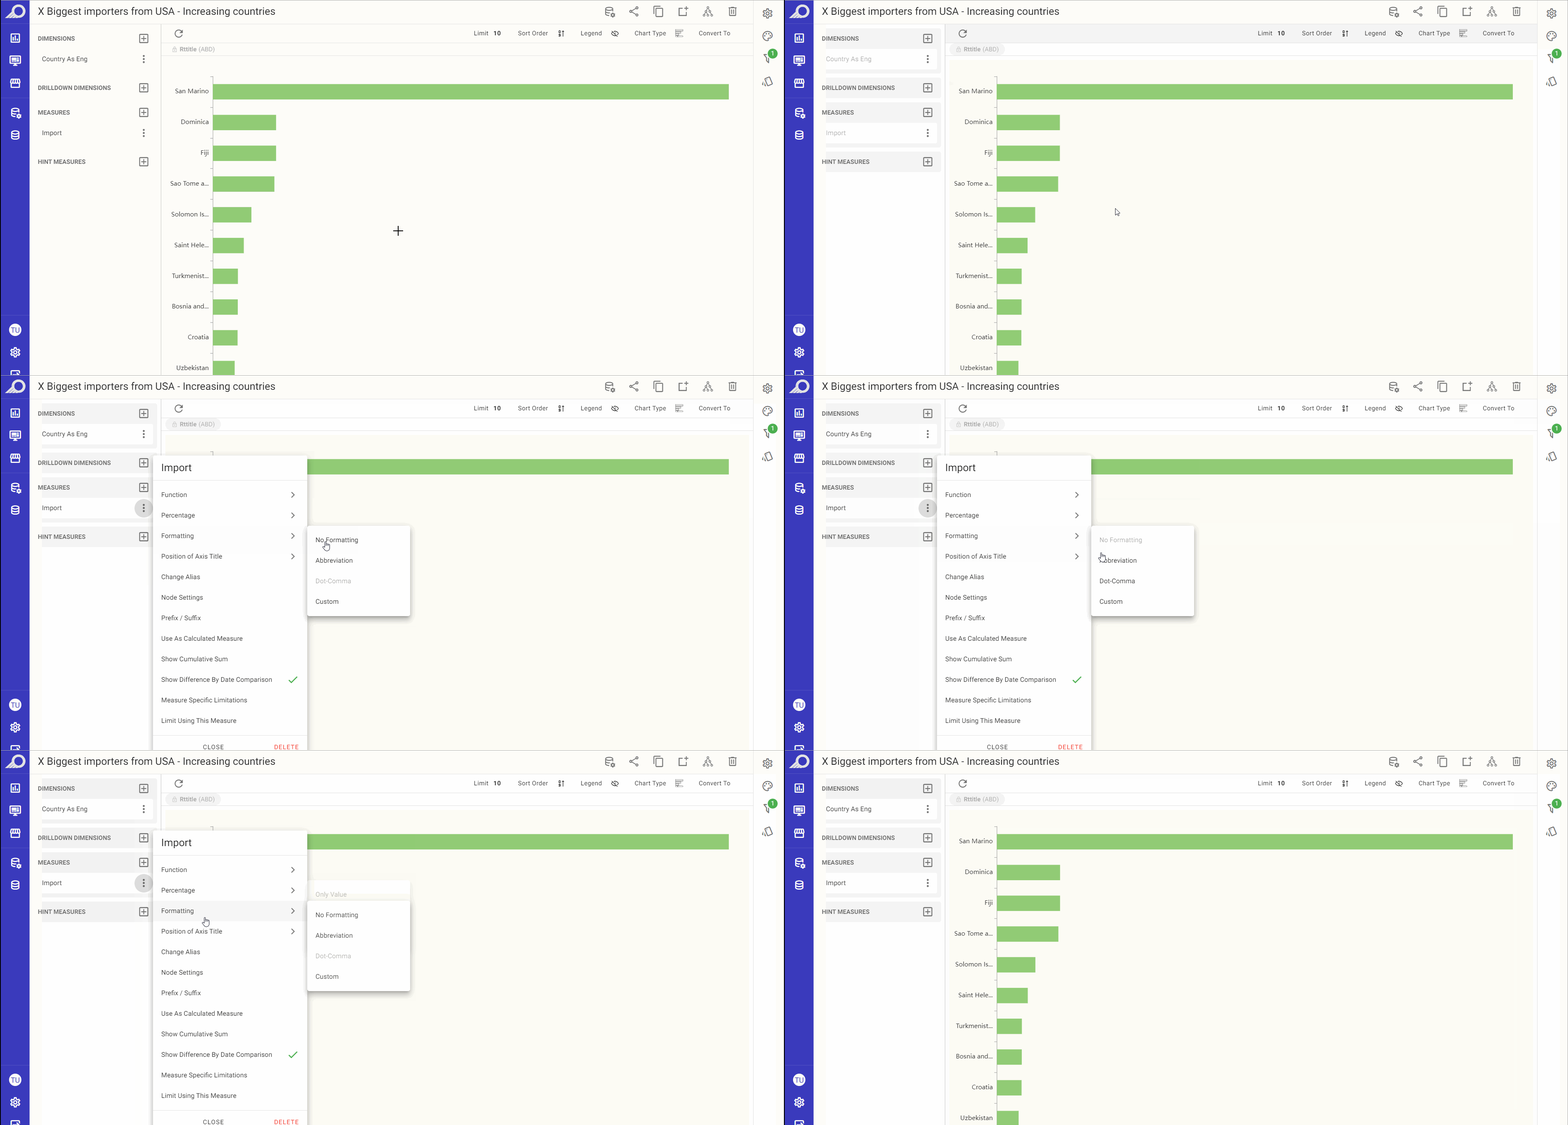
Measure Value Formatting Options
Note
TURBOARD applies the configured settings following priority as: Measure settings at the dashlet PG > Node settings at the view > Super User settings at admin pages > Default Application Settings.
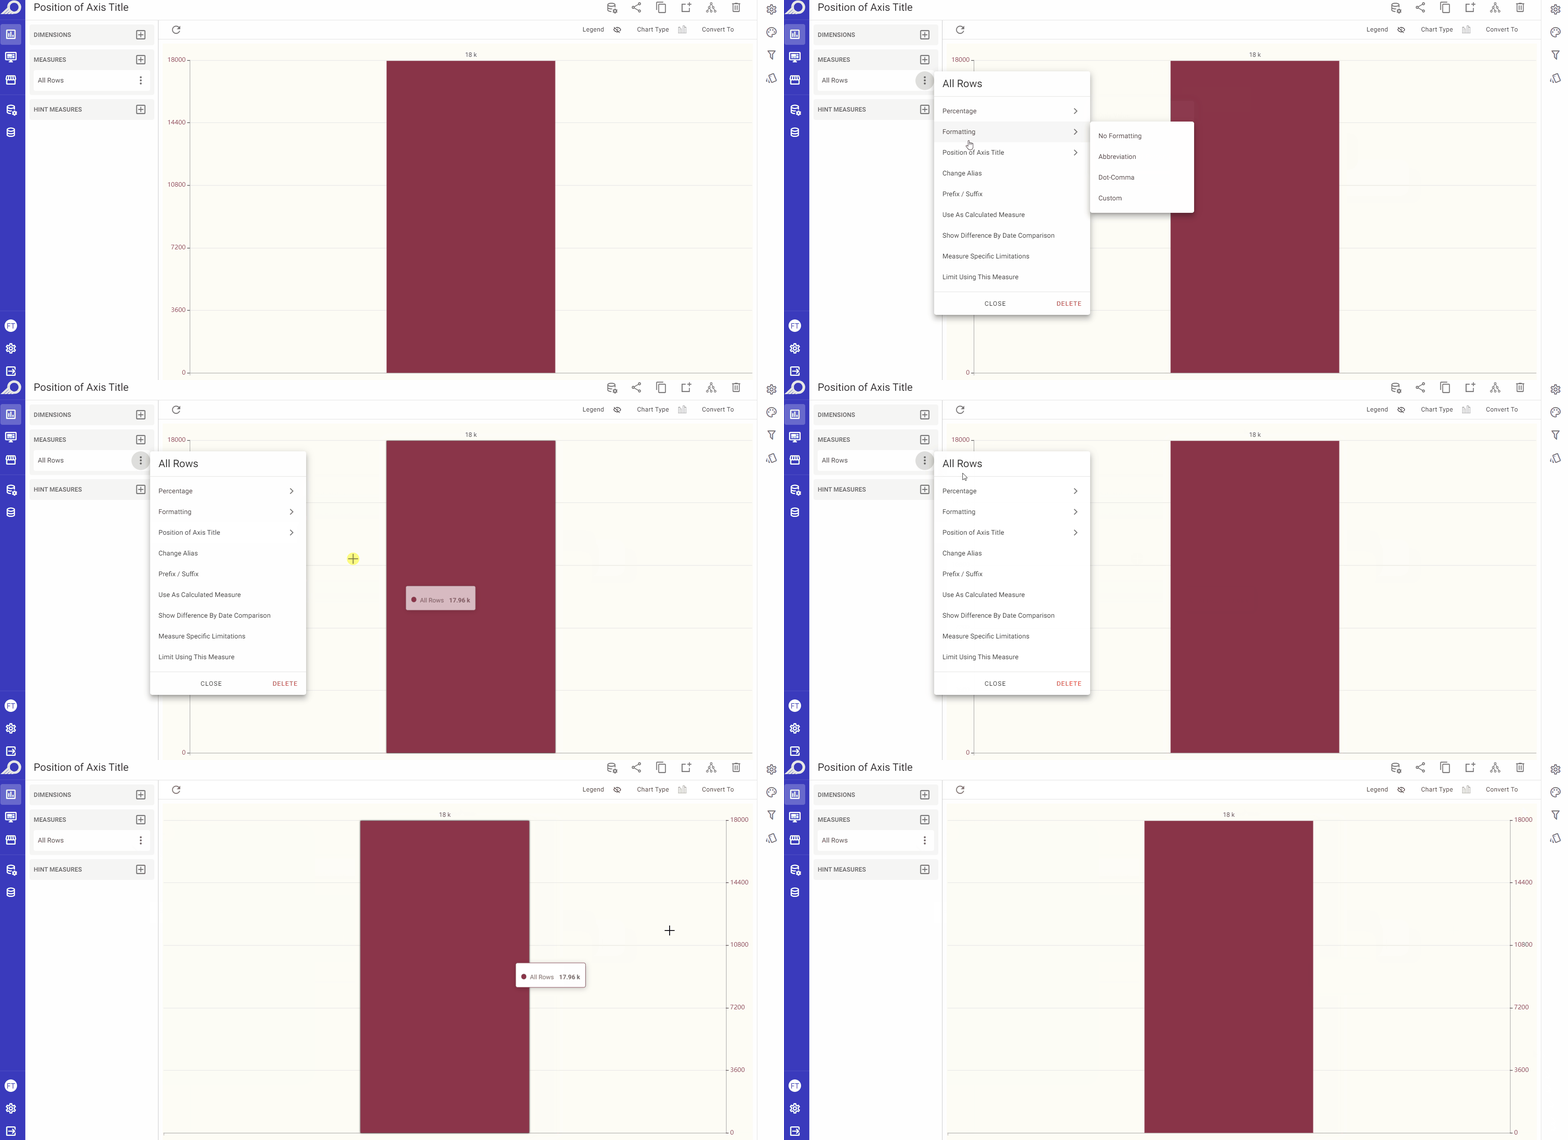
4. Position of Axis Title
This feature is available for chart types where the values are plotted on axes only in order to allow the user to determine the position(s) of the axes as in, for example, column, bar, area and line charts.
“Default” is selected when the dashlet is first created where the Y axis will be displayed on the left side of the resulting dashlet.
When selecting “Opposite”, the Y axis will be displayed on the right side. For dashlets with multiple measures with diverse ranges, right side located axes (Opposite) may be used.
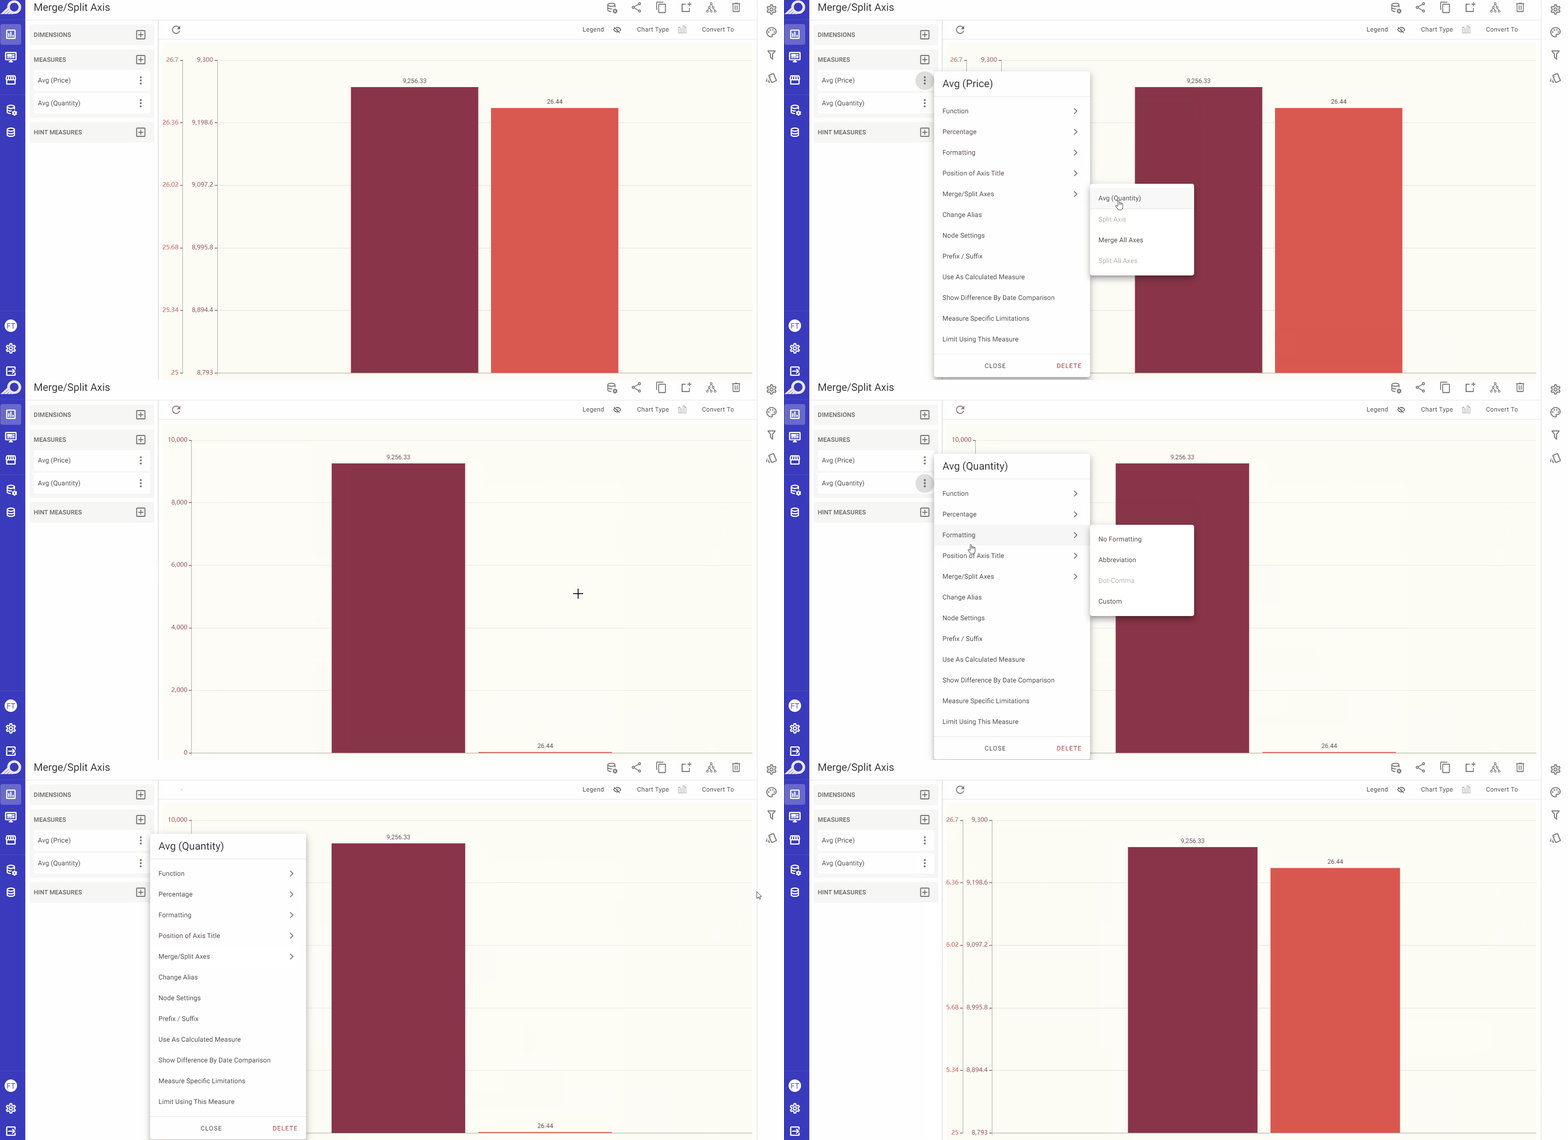
5. Merge/Split Axis
This feature is available for dashlet types where the values are plotted on more than one axis (more than one measure) in order to allow the user to merge or split the axes (all together or only the selected ones) on the resulting dashlet.
6. Change Alias
With this feature, the user can modify the title of a measure and assign it a different alias than the one assigned to its node. However, the modified alias will only be implemented in the dashlet, and won't alter the original alias of the measurement as a node in its respective view/dataset.
This feature is available for charts, pivot tables, info cells/gauges and regional maps dashlets.
7. Node Settings
When selected, the View Edit window for the selected measure will open to allow the user to make any necessary changes on the node settings.
This feature is available for charts, pivot tables, info cells/gauges and regional maps dashlets.
8. Prefix / Suffix
In some cases, adding prefixes or suffixes to a measure can enhance its meaning and provide more valuable insights. Typically, these options are used with currencies or percentages, when the unit is already known.
For instance, when displaying temperature data as a measure, a suffix such as “°C” can be added to inform the user about the unit of measurement.
By utilizing the “Prefix / Suffix” option available in dashlets, users can add a prefix and/or suffix that will be displayed before or after the selected measure value in the resulting dashlet. Note that these modifications will only affect the dashlet and won't alter the measurement's node settings for its respective view. This feature is available for charts, pivot tables, info cells/gauges and regional maps dashlets.
Calculated Measures Using Pandas Functions
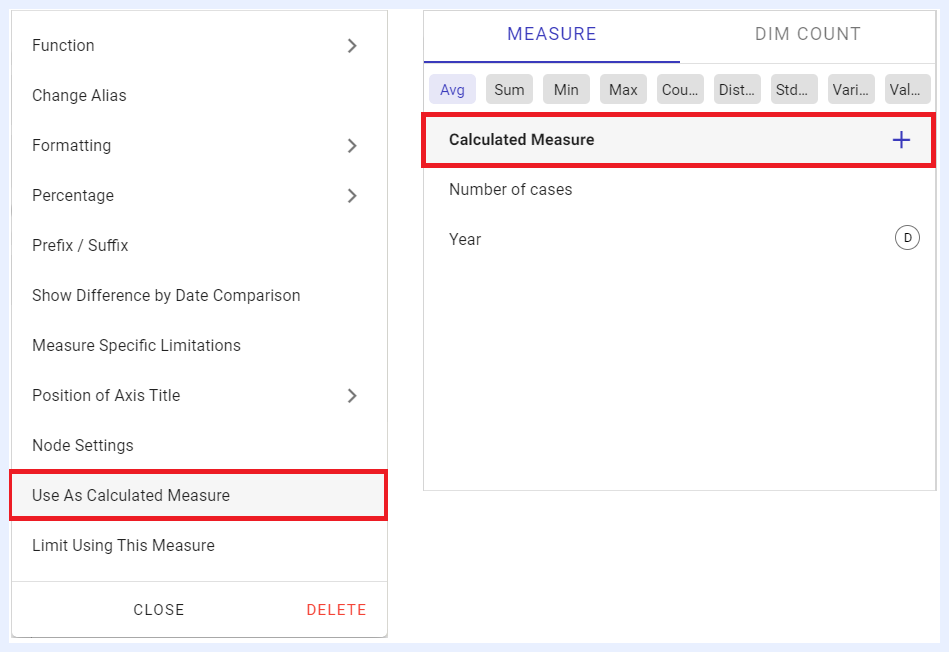
This feature is used to display the measure value for dashlets (charts, pivot tables, info cells, gauges, and regional maps) as a customized calculation using Pandas functions and Pandas DataFrames – A python powered structure with a toolset to flexibly organize and work with data.
When to Use Calculated Measures
While expressions at the view level are ideal for creating standardized and reusable calculations across multiple dashlets, calculated measures using Pandas functions are best suited for dashlet-specific scenarios. This approach allows for more dynamic and interactive data manipulation directly within the dashlet, leveraging the powerful capabilities of the Pandas library. It is particularly useful when:
- You need to perform instant data analysis and transformations without querying the database repeatedly.
- You require specific calculations that are unique to a particular dashlet and do not need to be reused across multiple dashlets.
- You want to experiment with different calculations without altering the underlying view as it allows for flexibility in analysis and visualization within the dashlet.
- You aim to reduce the load on the database server by offloading calculations to the client side, resulting in improved performance and faster dashboard responsiveness.
Practical Use Cases for Calculated Measures Using Pandas Functions
Calculated measures using Pandas functions can be used for different use cases such as:
9. Normalization:
Definition: to normalize a measure and adjust its values to different scales. For example, you can normalize a measure to 0 and 1 and round it to 2 decimal digits as below sample image.
Used Function: ((COL("Measure Name")-COL("Measure Name").min())/(COL("Measure Name").max()-COL("Measure Name").min())).round(2)
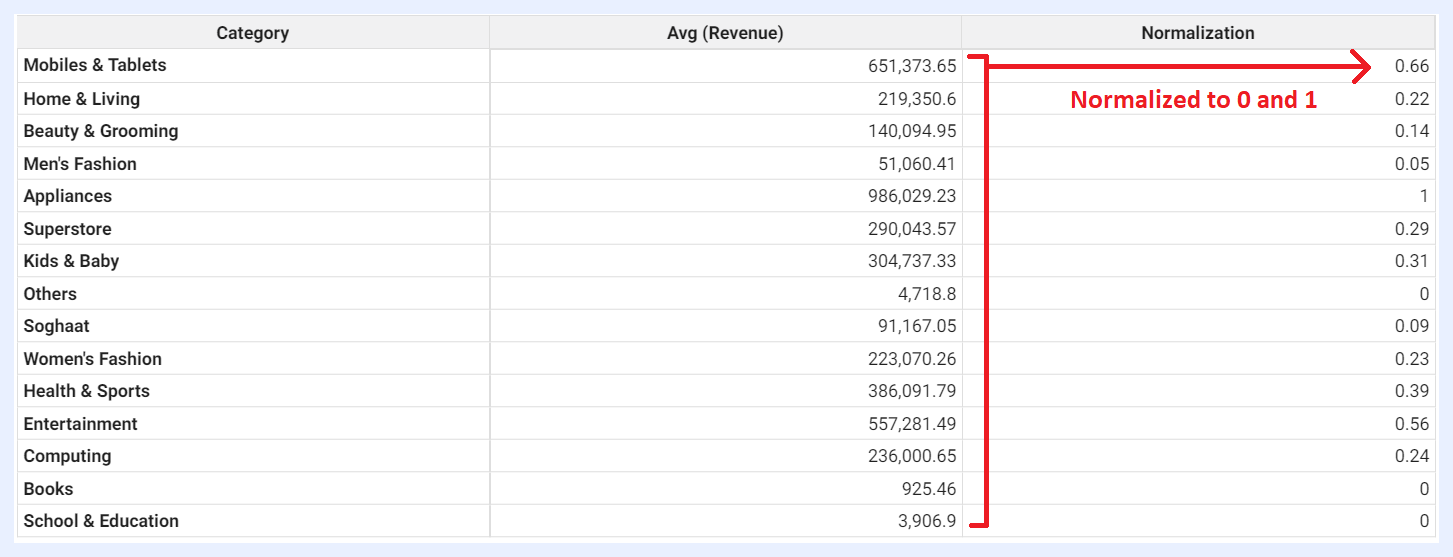
Sample Result
10. Imputation:
Definition: to replace missing or null values with a specific value. For example, you can write proper no-data messages and choose to write something like “No Data” when there is no data (null values) for that cell.
Used Function: COL("Measure Name").fillna("Your Replaced Message")
11. Labeling:
Definition: to assign labels or set specific tags to your data based on the values of a particular measure. For example, if the values are bigger and/or smaller than a specific threshold, certain labels can be assigned to them for comparison reasons as in the sample image below.
Used Function: COL("Measure Name").apply(lambda x: "Tag 1" if x > 0 else "Tag 2")
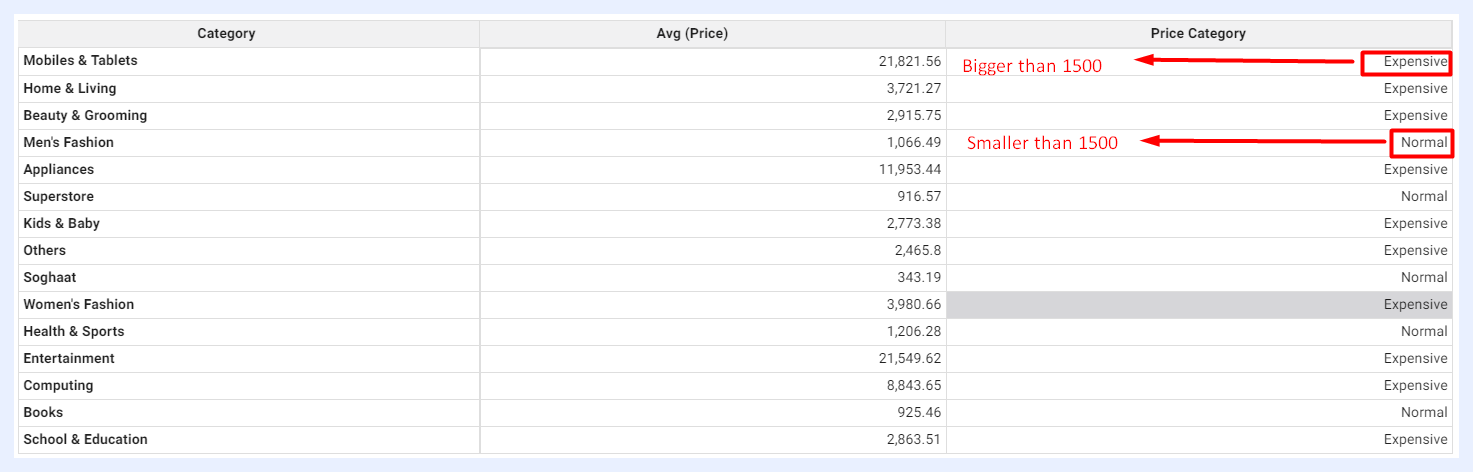
Sample Result
12. Absolute:
Definition: to display all values in absolute format (the non-negative value of measure without regard to its sign).
Used Function: COL("Measure Name").abs()
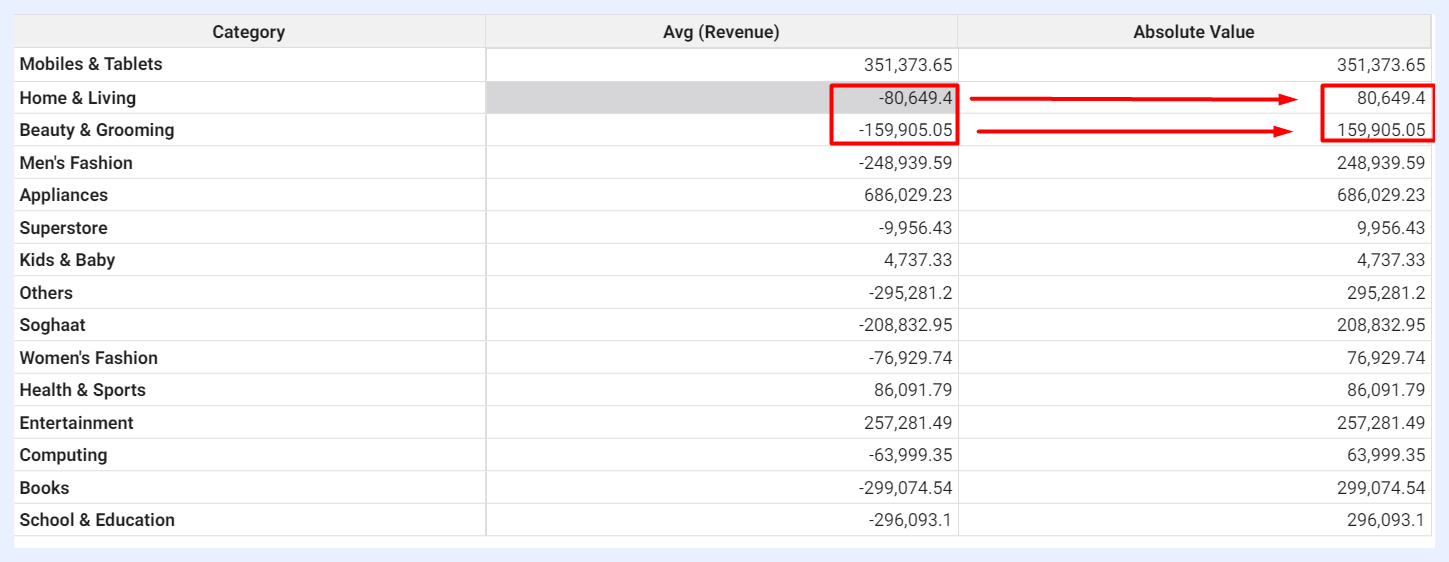
Sample Result
13. Comparison:
Definition: to compare two measures with “greater than” or “less than” parameters.
Used Function: COL("Measure Name 1").lt(COL("Measure Name 2"))
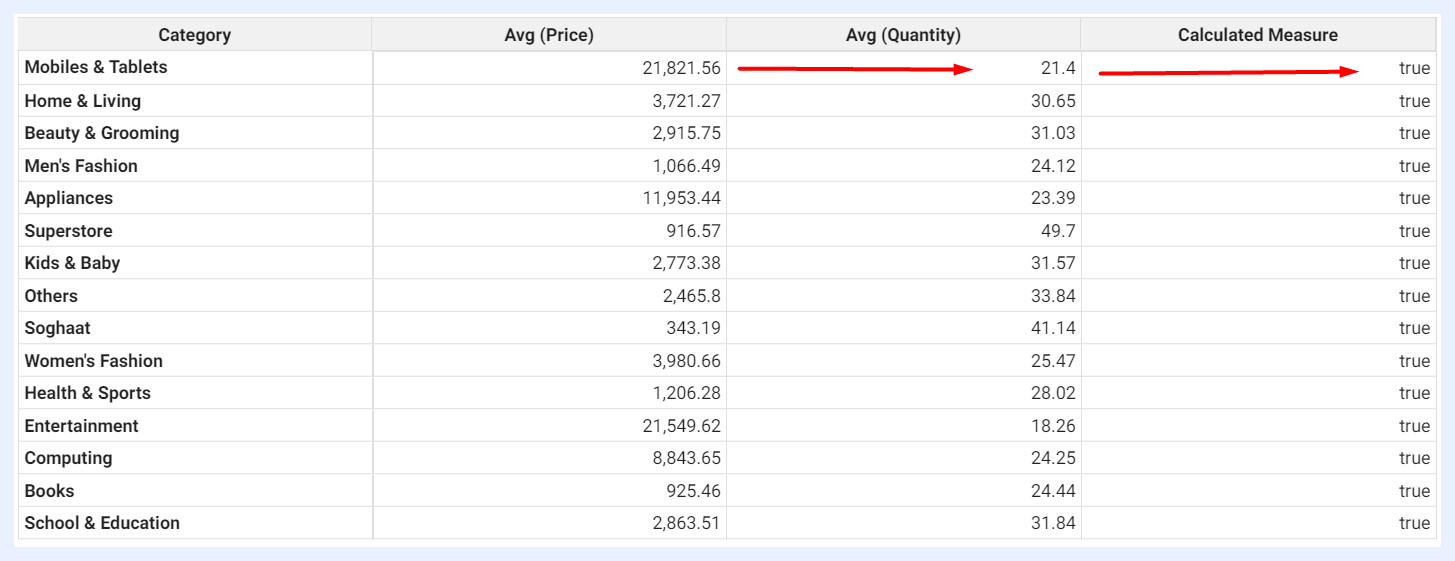
Sample Result
14. Replacement:
Definition: to translate or replace some values systematically.
Used Function: df['Measure Name'].replace({"Value 1": "Value Replacement 1", "Value 2": "Value Replacement 2"})
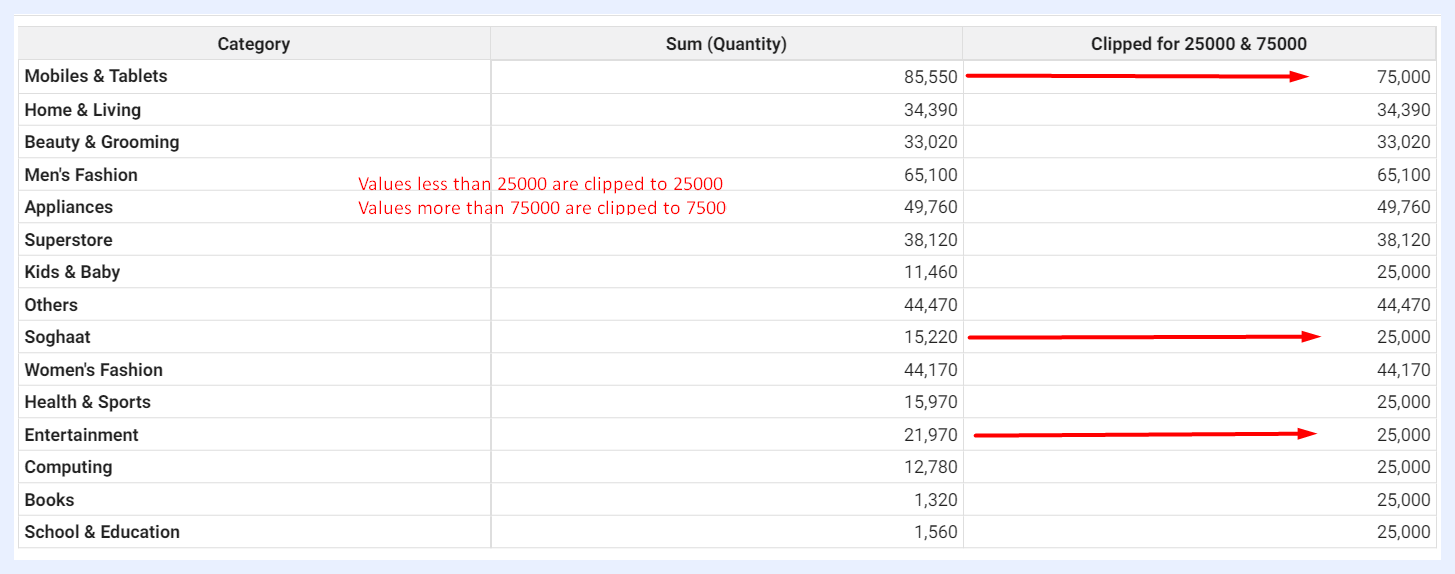
15. Clipping:
Definition: to clip some values and set a threshold to limit your residual values. It helps limit the range of values in a column to a specified minimum and maximum value.
Used Function: COL("Measure Name").clip(00, 01)
Sample Result
16. Validation:
Definition: to mark some values as valid (True/False) and check them among possible choices.
Used Function: df["Measure Name"].isin(["Value 1", "Value 2", "Value 3"])

Sample Result
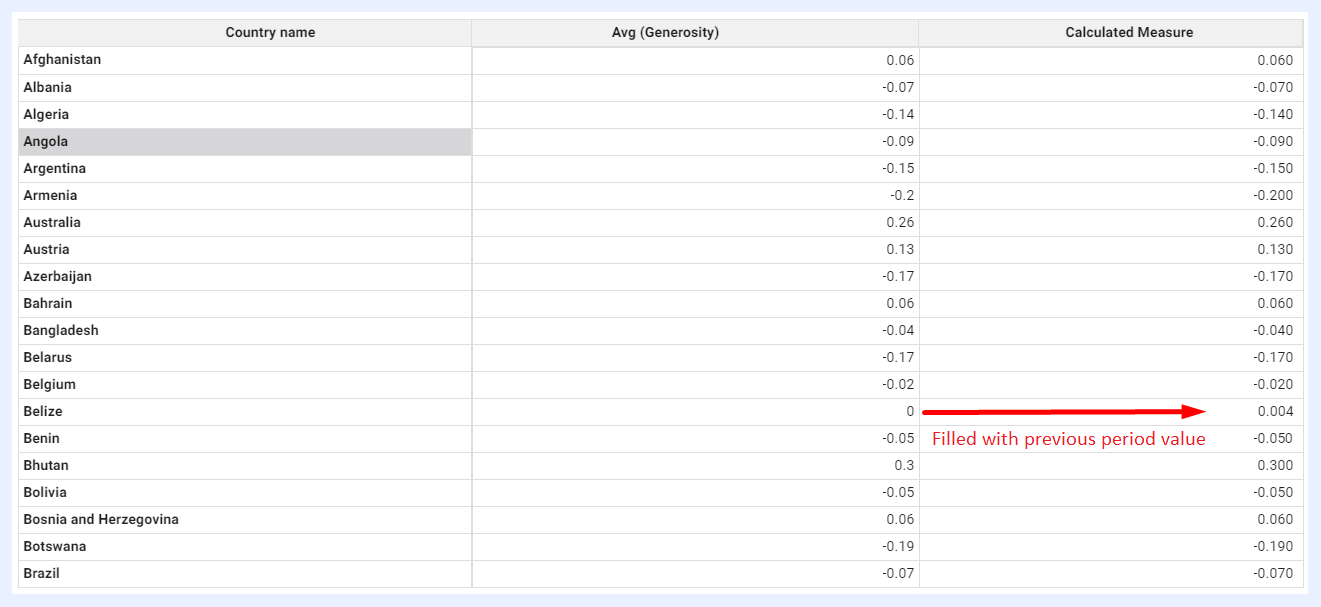
17. Backfilling:
Definition: to autofill missing values with their corresponding previous period values.
Used Function: COL("Measure Name").bfill()
Sample Result
Note
Exceptions: do not use Pandas functions starting with “plot” (as they are for plotting something), or “to” (as they intend to export to external files). Avoid functions that would change order such as “cumsum” and “diff” as TURBOARD will execute sort operations afterwards.
How to add a Calculated Measure?
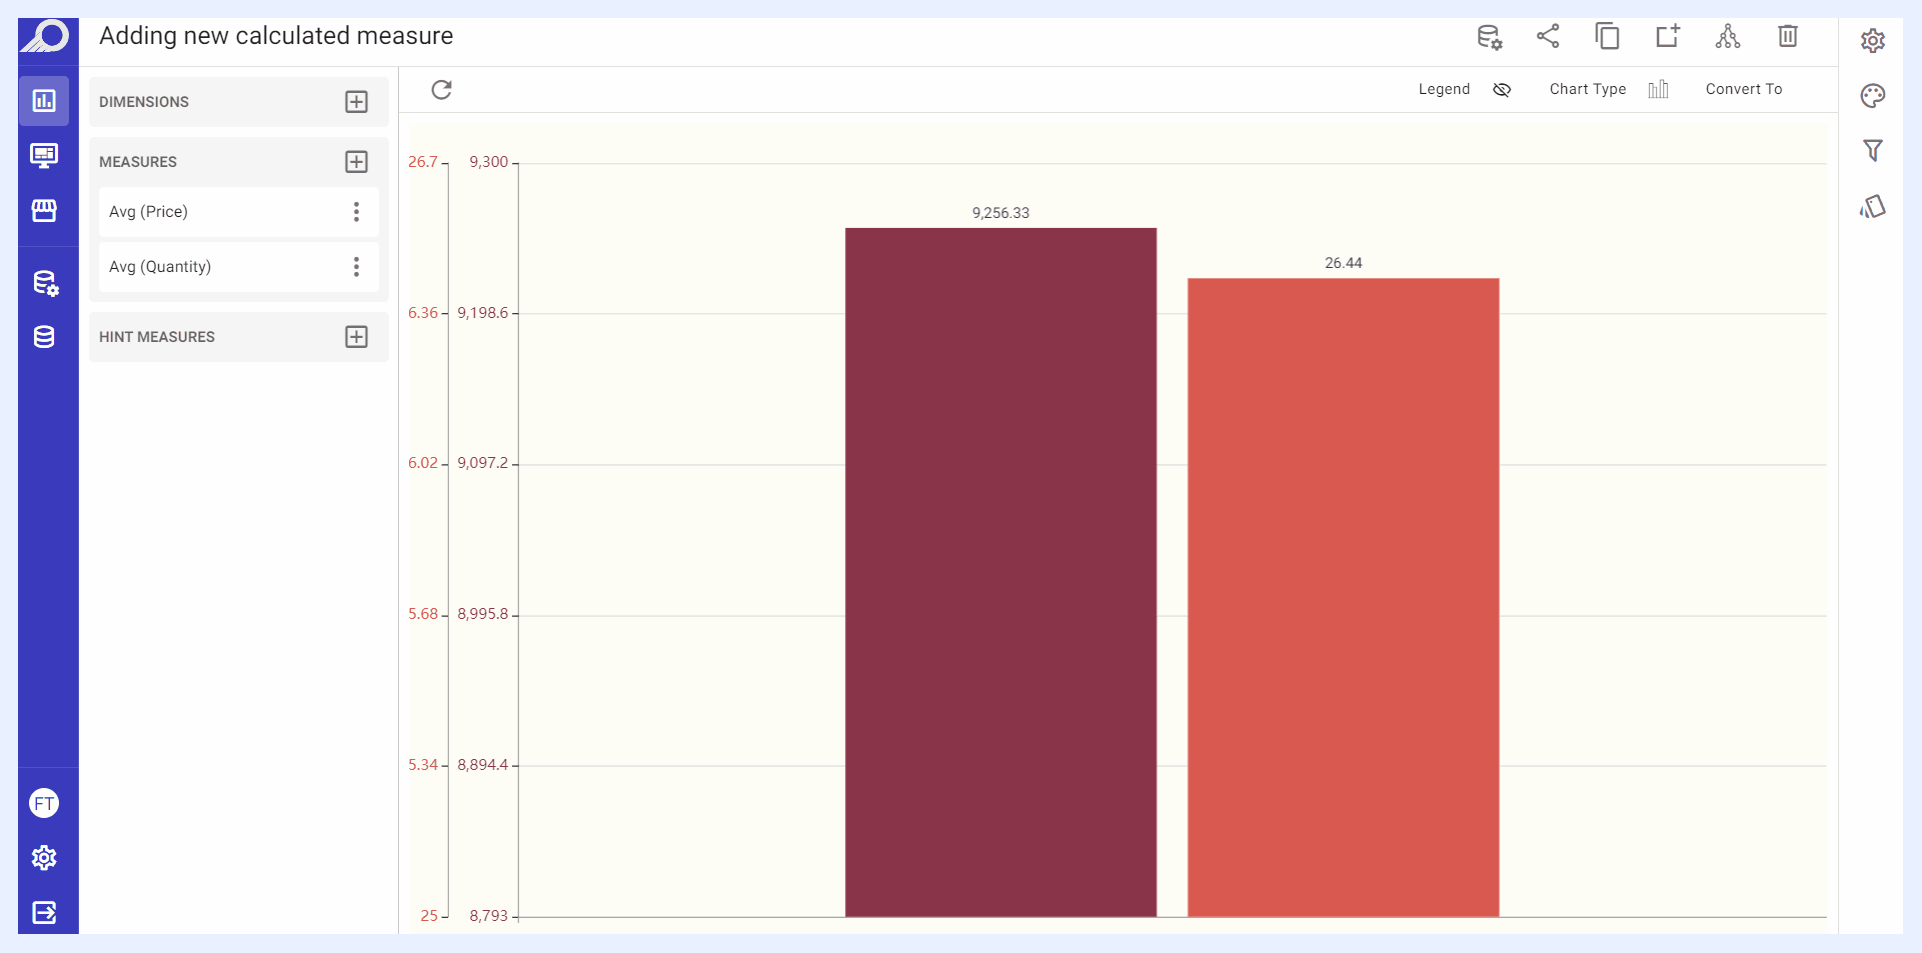
1 Click + Add Measure icon button located next to the “Measure” left pane > select Calculated Measure + option > click ADD button.
2 An overlay window will open. Write the required Pandas function DataFrame in “COL(x)=” field and click APPLY button.
3 The new calculated measure will be listed under “Measure” left pane. Give your new measure a name by selecting Change Alias option from its ellipsis settings menu.
4 Any time needed later on, you can edit the added calculated measure using Edit Calculated Measure option from its ellipsis settings menu.
How to change an existing Measure into a Calculated Measure?
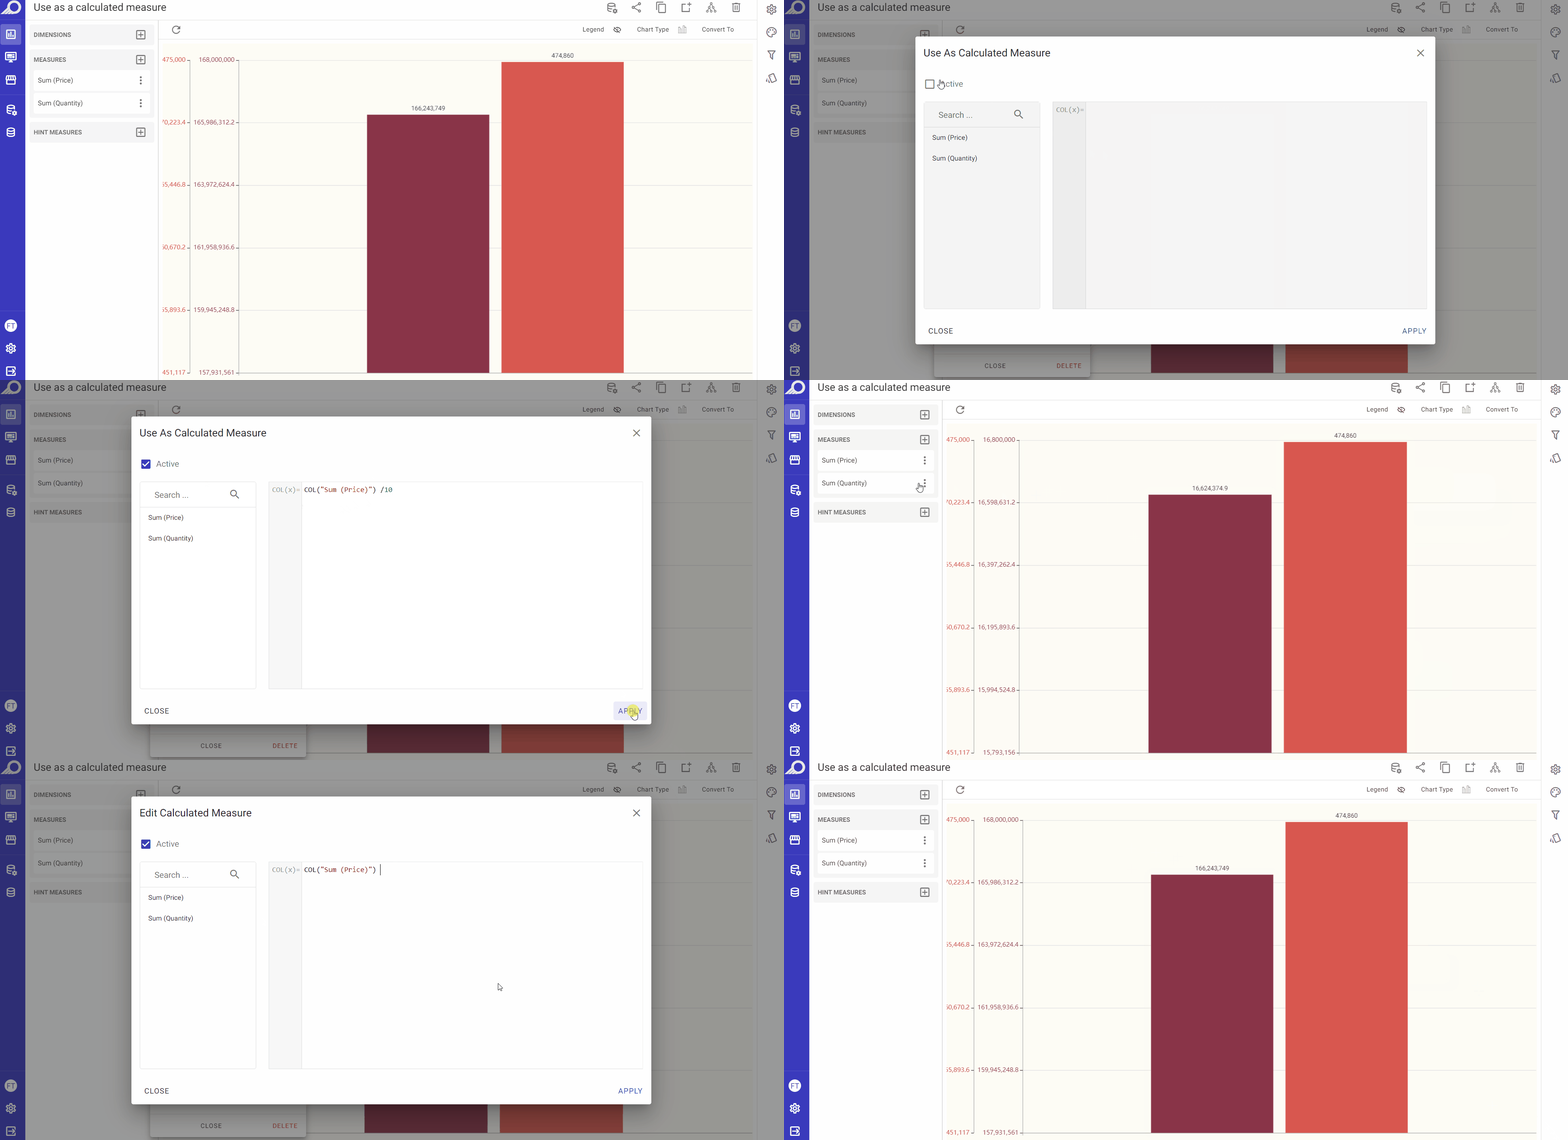
1 Click on the ellipsis settings menu for the required measure to open its functions and settings drop-down list.
2 Choose Use As Calculated Measure option from the list.
3 An overlay window will open. Check “Active” check box, and write the required Pandas DataFrame structure in “COL(x)=” field, then click APPLY button.
Note
You cannot use Python (or libraries like SciPy and NumPy) directly for security reasons. Refer to this CheatSheet for a full list of Pandas functions.
Other Settings for Measures
18. Show Cumulative Sum
If selected, the chart will display the running total of the selected measure over time, rather than just the individual values. For example, if you have a chart showing the daily sales revenue for a business, selecting “Show Cumulative Sum” for the “Sales Revenue” measure will cause the chart to display the total revenue earned up to each day, rather than just the revenue for each individual day.
You can show the original single values on the chart through “Show Single Values” option that will automatically replace “Show Cumulative Sum” when selected.
This feature is available for charts, pivot tables and regional maps dashlets.
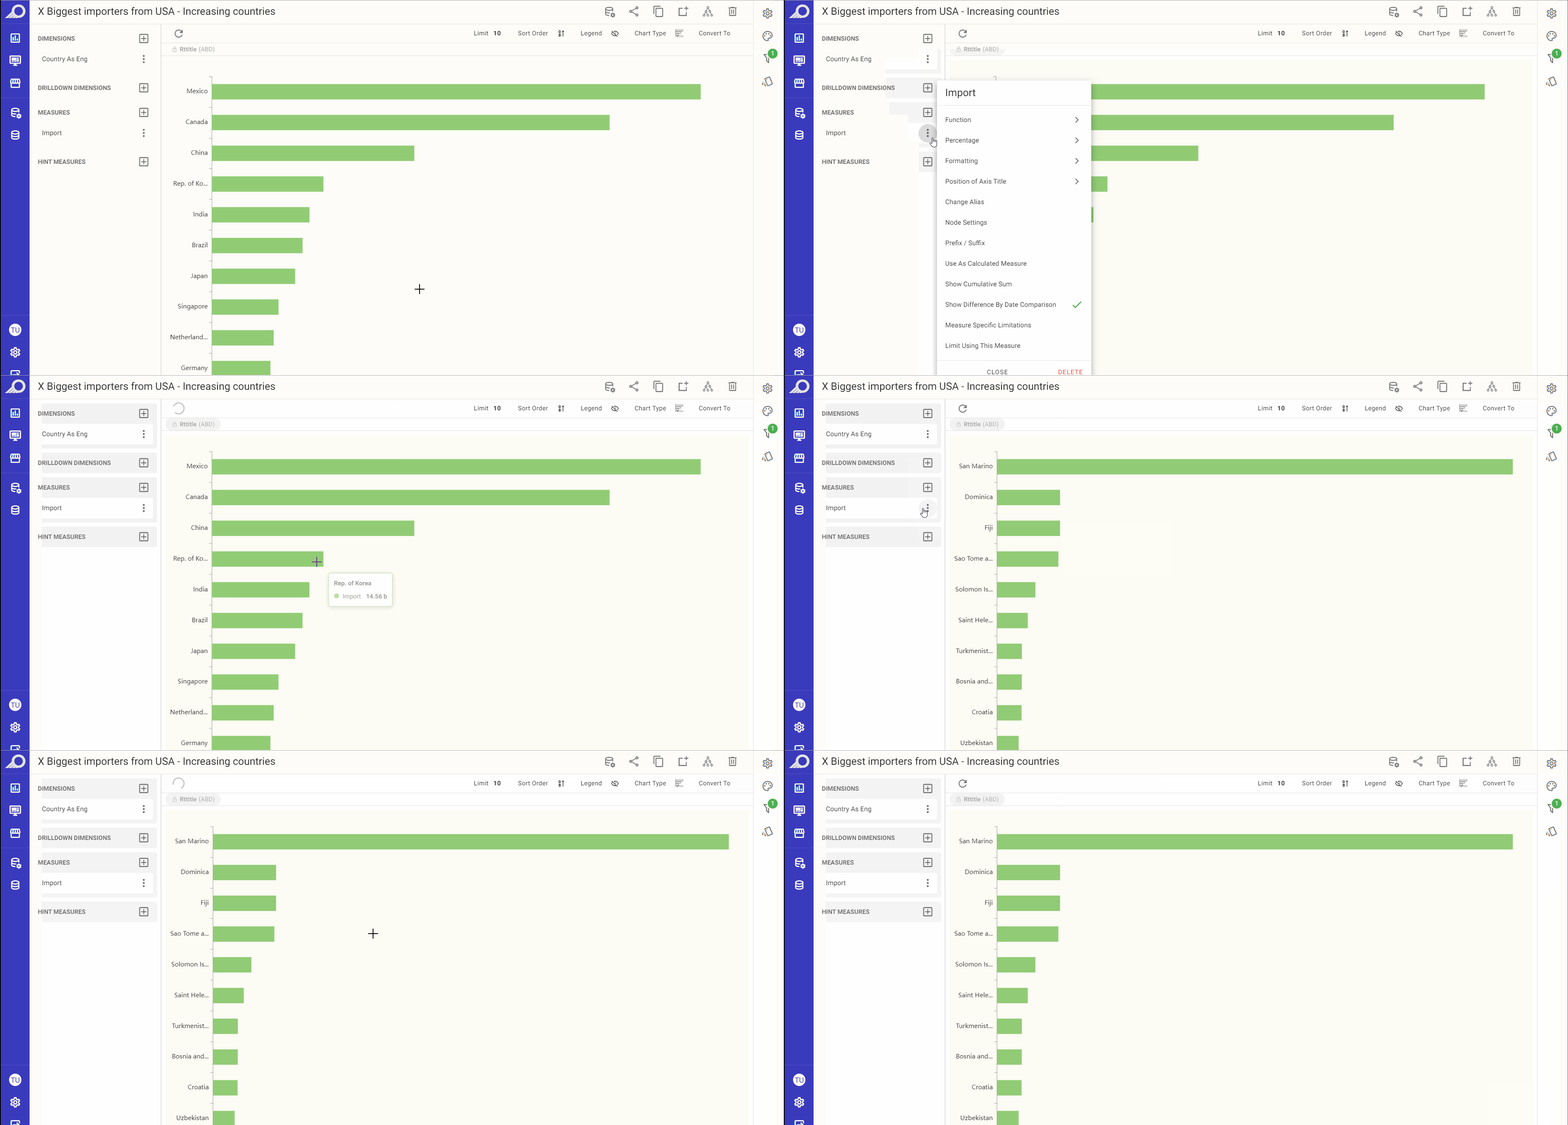
19. Show Difference By Date Comparison
This feature enables you to compare data for different dates and analyze the changes over time. It specifically helps to identify the historical variances in your data, such as the differences between values for the previous month and the current month. It applies to the date dimension in your data, which organizes data by date.
This feature is available for charts, pivot tables, info cells/gauges and regional maps dashlets.
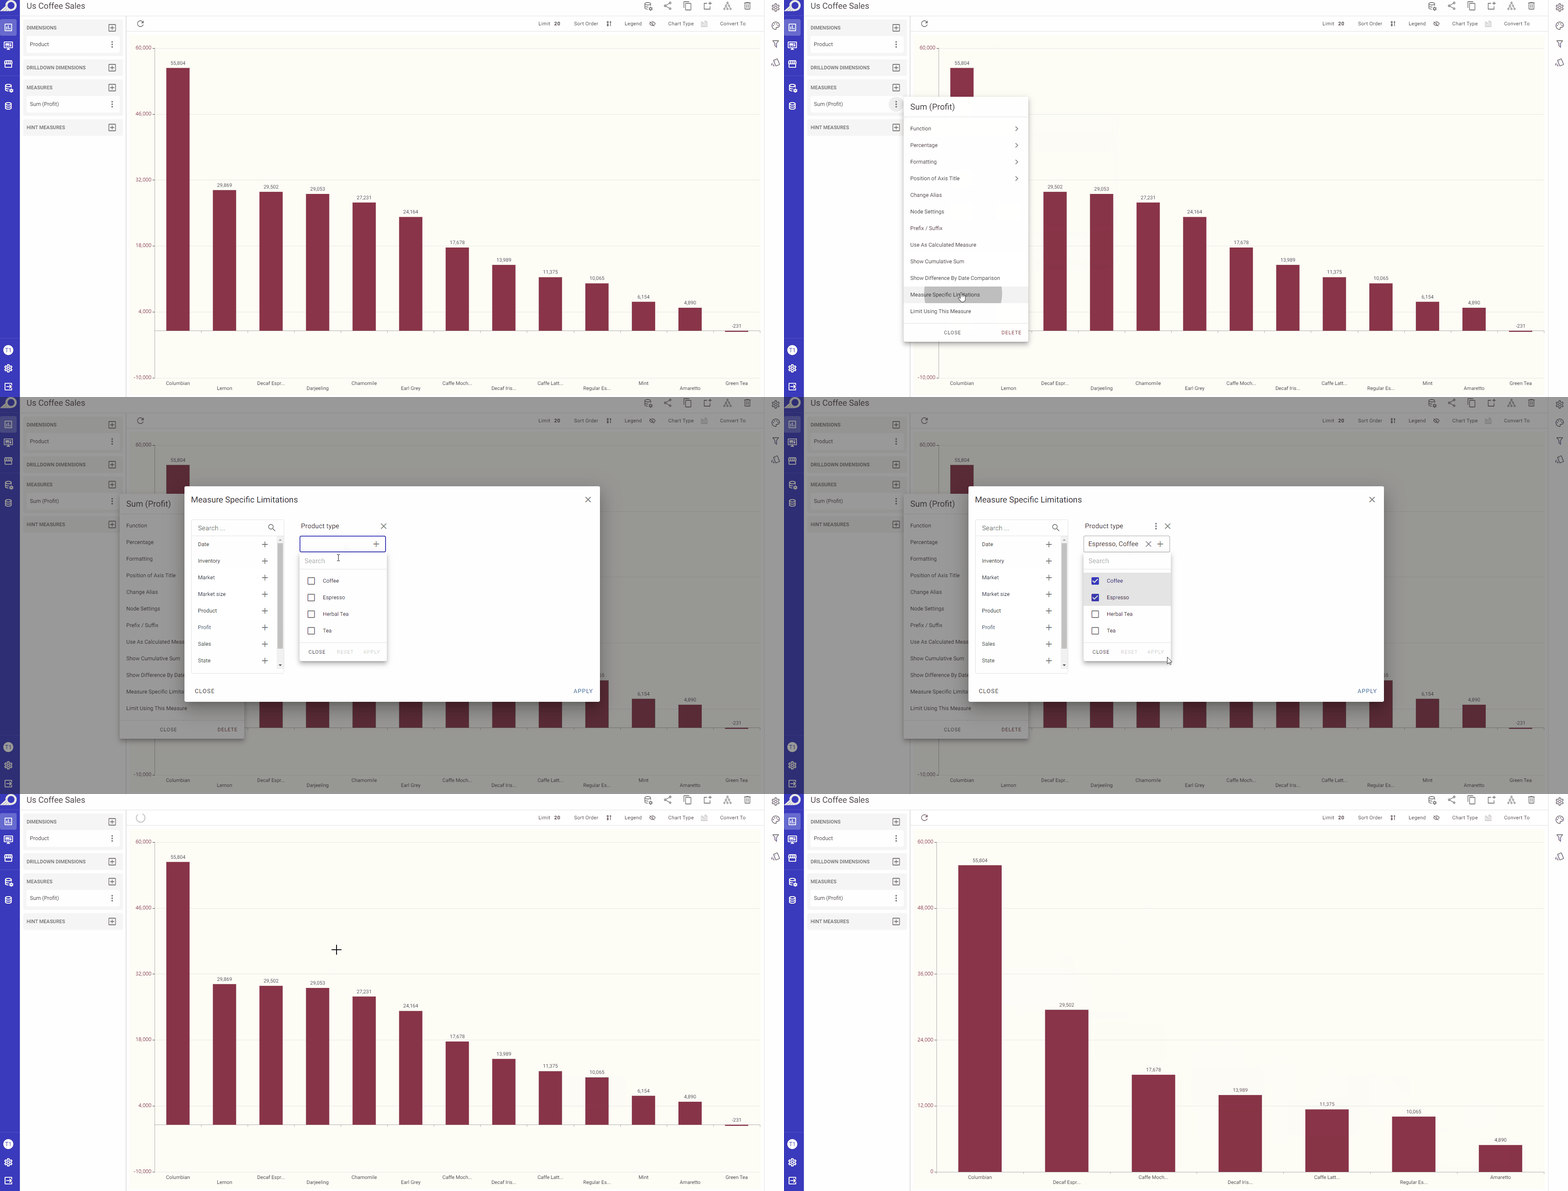
20. Measure Specific Limitation
This feature is used to set measure-specific constraints as a rule to limit the fetched data or prevent some values from occurring. In simpler words, it works as an internal filter for the selected measure and only fetches the data according to the selected limitation.
Measure limitation can be applied on any node that is set as a filter. You may limit the fetched data according to values within a certain range, or fetch the data according to selected periods, dates, or even anchored dates through “Relative“ option.
This feature is available for charts, pivot tables, info cells/gauges and regional maps dashlets.
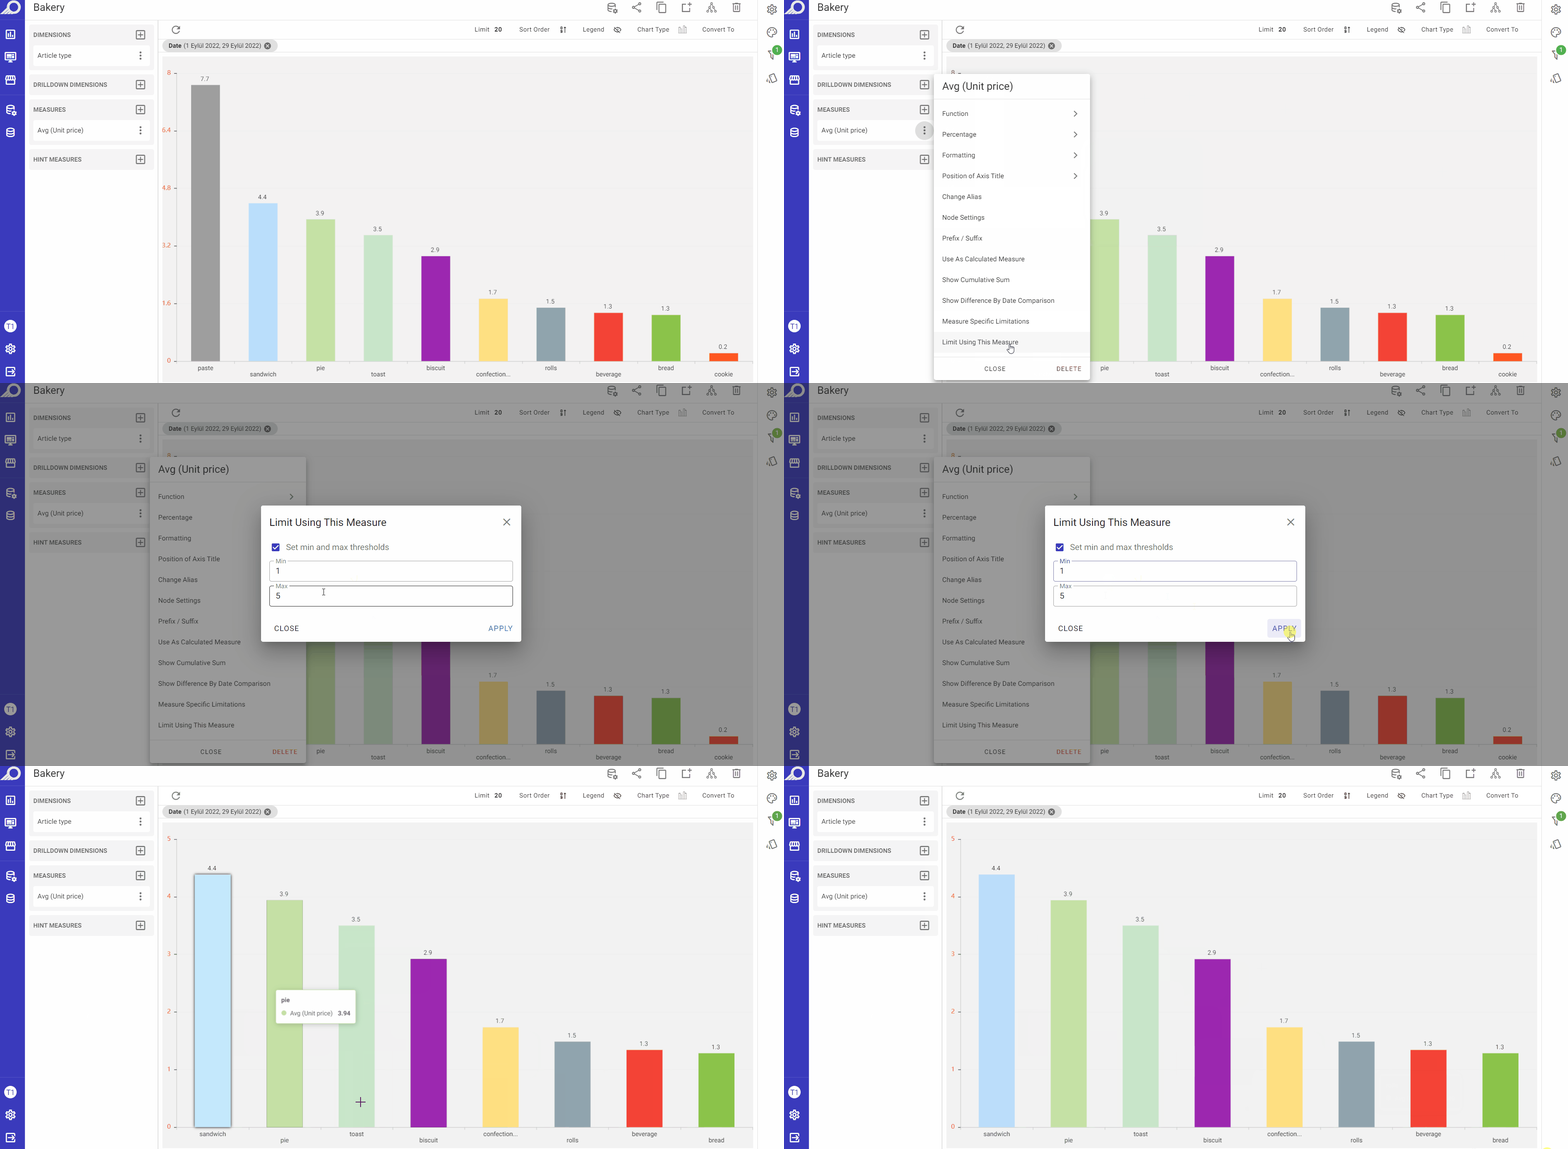
21. Limit Using This Measure
This feature only appears on chart dashlets. It allows the user to restrict a measure with values thresholds.