Components Addition Panel
The left-side panel consists of a number of icons made available for designer users to add various components to their dashboards.
When a component is added to the dashboard PG from the panel, its location and size can be adjusted using the mouse. Its settings and design (styling) can be configured through the Dashboard Settings and Configuration Panel.
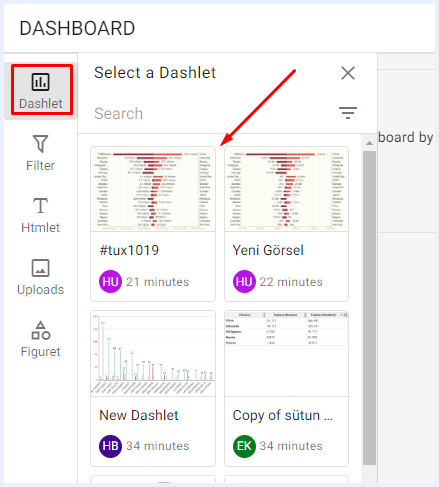
Adding Dashlets to a Dashboard

When clicked, a sidebar window will open listing all the created and/or shared dashlets with the user. Users can add any dashlet to the dashboard by simply selecting it from the list, and it will be automatically added without requiring any additional steps. If there are numerous dashlets listed, you can utilize the search function to find the specific ones you need.
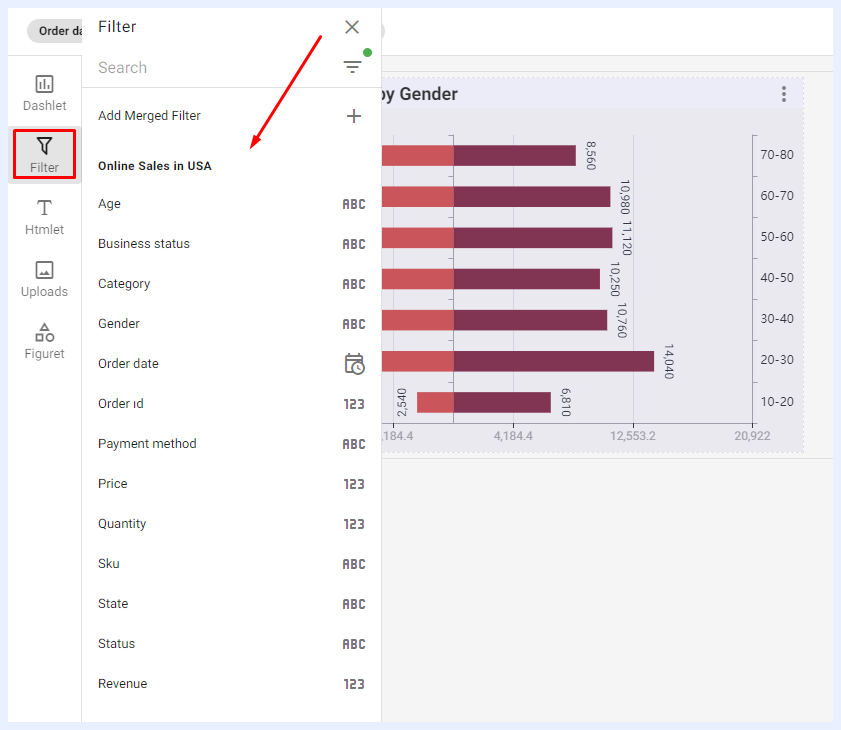
Adding Filters to a Dashboard

When clicked, a sidebar window will open listing all the nodes of type “Filter” for all the added dashlets in the dashboard. This allows users to select and add any filter they need, enabling them to drill down and limit visualizations by different sizes and dimensions.
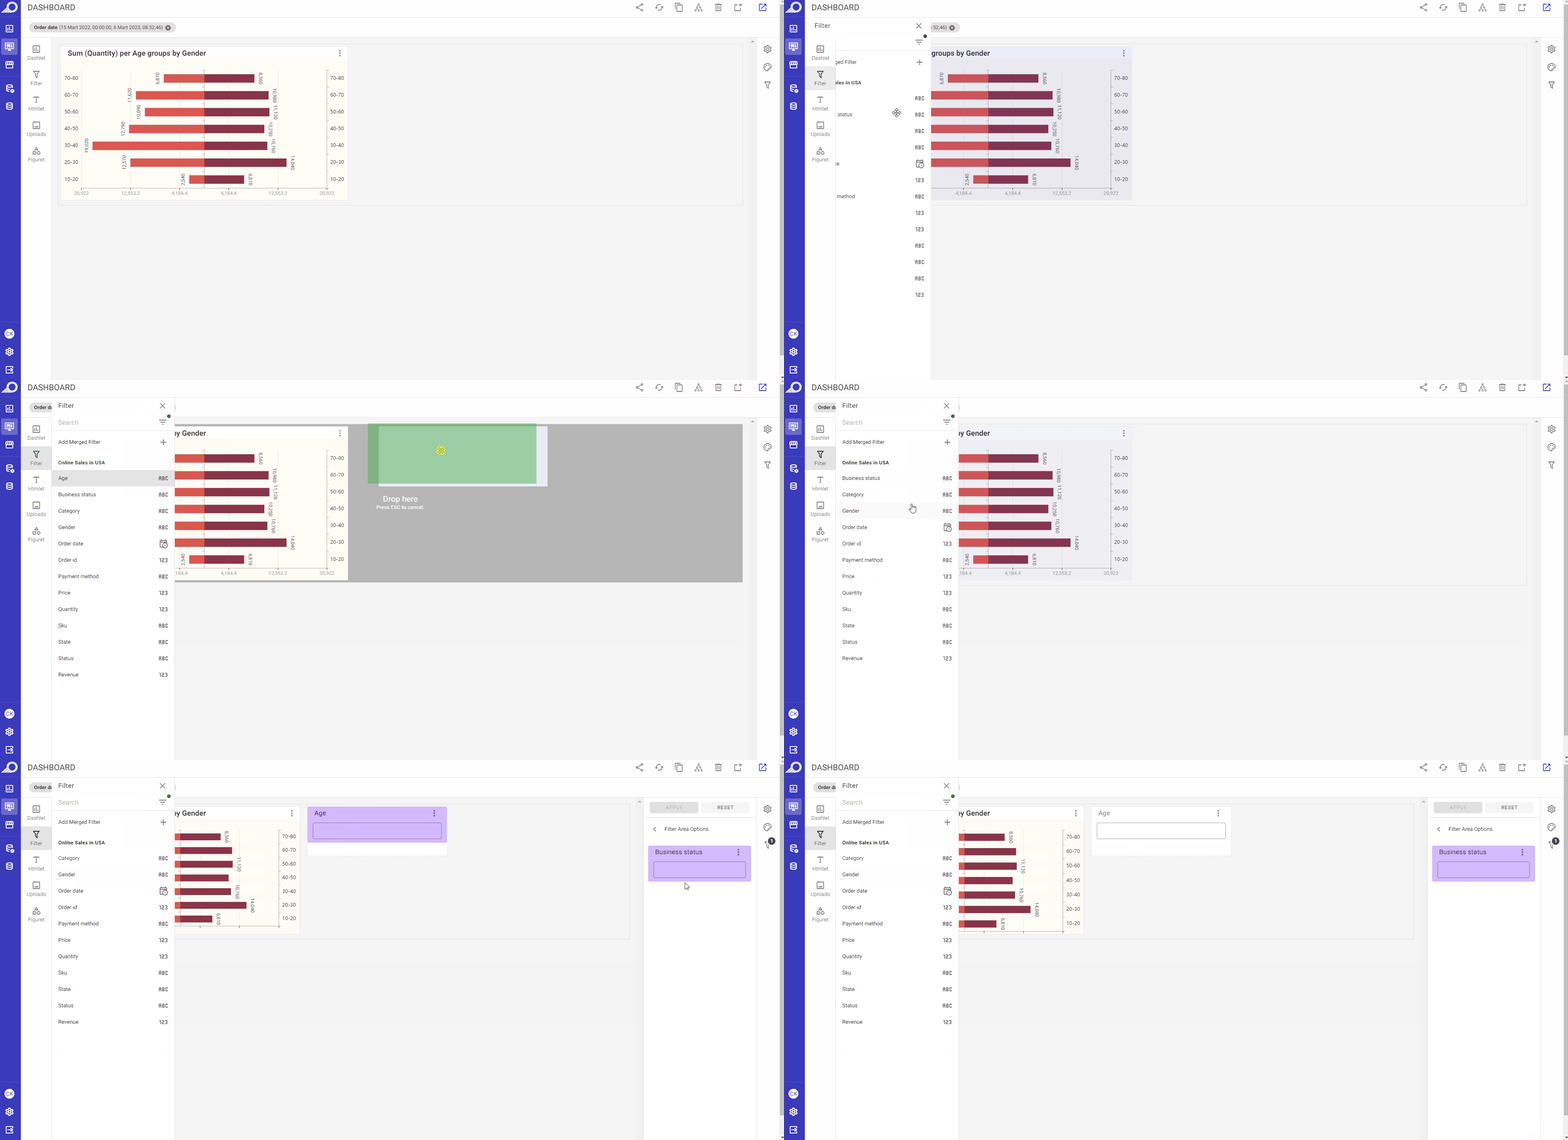
Fixed Filters on the Right-side Pane: when a filter is clicked from its sidebar menu, it will be directly added to the right-side filters’ pane.
Custom Filters on Dashboard PG: Users can easily add custom filters to the dashboard playground area by dragging and dropping the selected filter from the sidebar window. This feature provides users with the flexibility to manage the filter's location and size to achieve their desired design and formatting options.
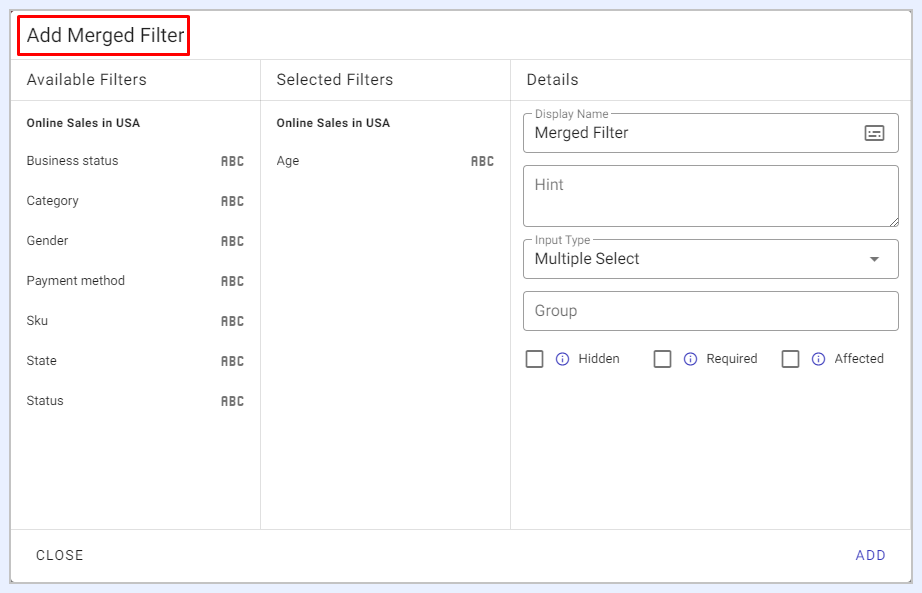
Merged Filters: using this feature, users can combine multiple related filters into one single filter. This allows users to apply a set of filter criteria to the dashboard simultaneously, simplifying the filtering process and improving dashboard interactivity. By using a merged filter, users can control and adjust multiple filters at once, making it easier to refine and analyze data based on specific requirements or criteria.
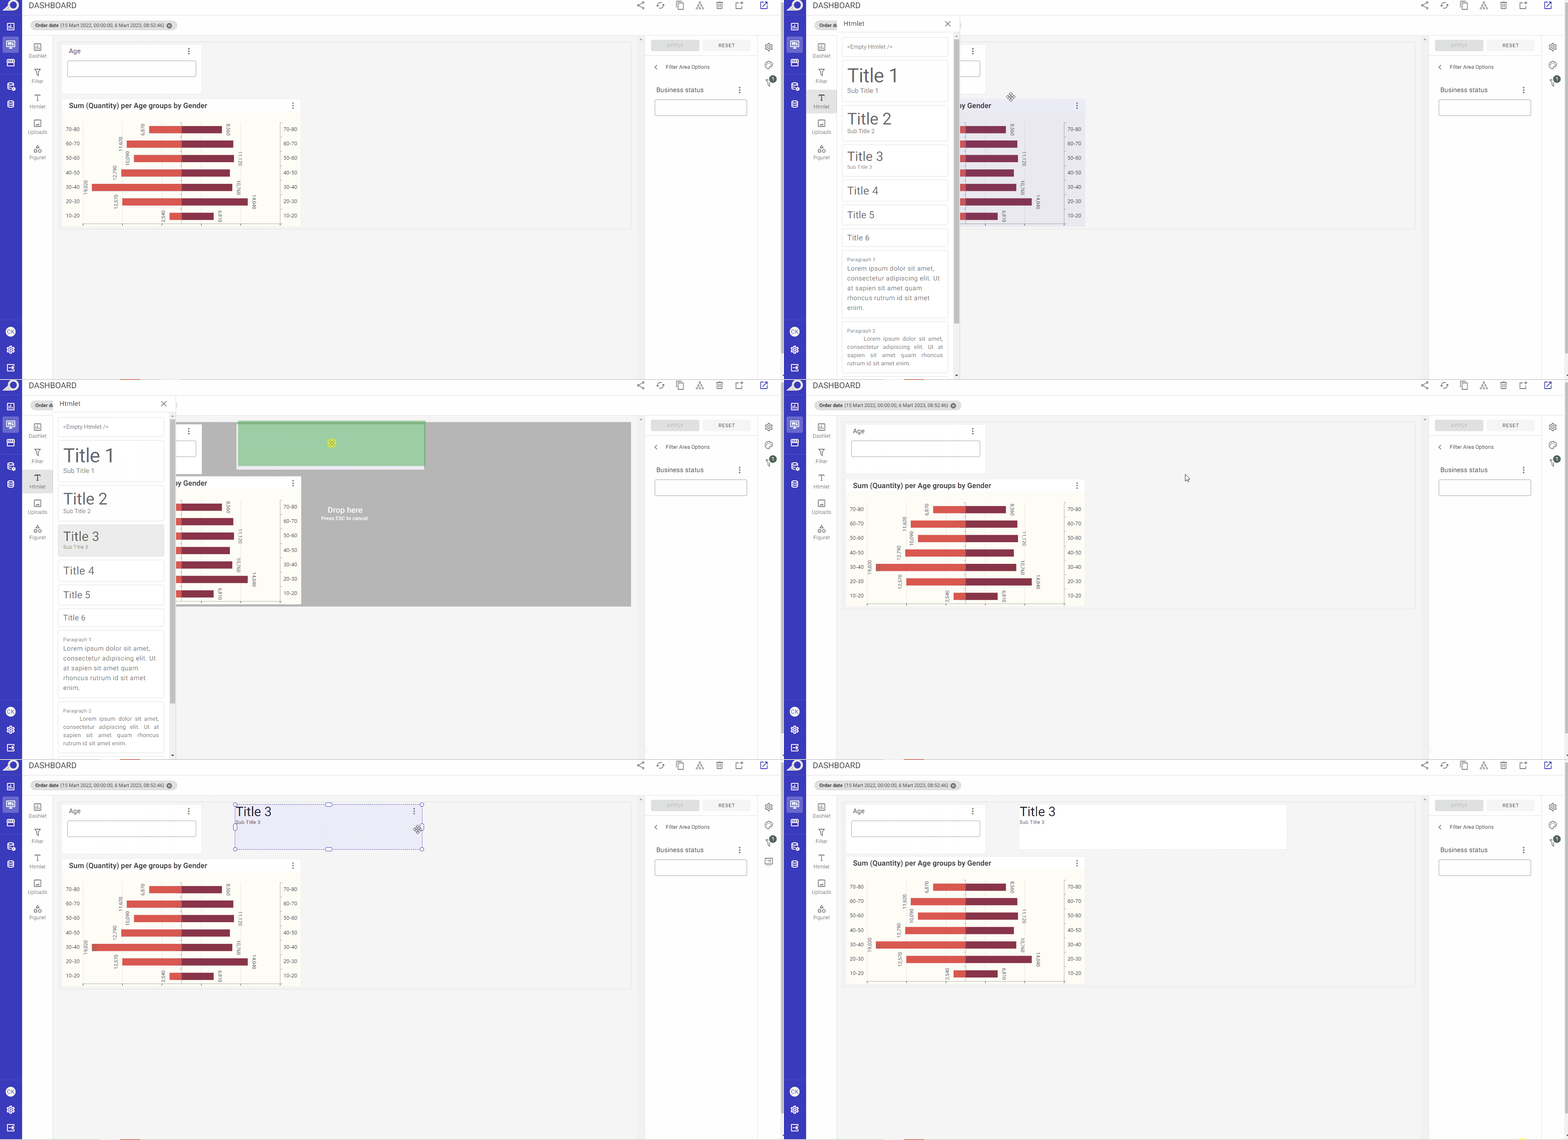
Adding HTML Components to a Dashboard

When clicked, a sidebar window will open to allow the user to add HTML components to the dashboard. Users can either click on the required HTML style to add it directly to the dashboard or drag and drop it to the desired location on the dashboard's PG. Once an Htmlet is added, users can access the right-side ellipsis menu and select their preferred option to edit or manage the added component as needed.
- Properties option: when selected, the “Htmlet Properties” options for the added Htmlet will open at the Dashboard Settings and Configuration Panel. Users can change/manage the settings, styling and formatting of the Htmlet as needed.
- Edit Content option: when selected, it allows users to modify and enhance the HTML content they've added to the dashboard. When this option is selected, the HTML editor will open, providing users with a variety of tools to add and edit HTML elements such as URL links, images, dynamic dates, filters, formatted texts, and more. The HTML editor window includes a range of formatting and styling options, enabling users to customize the appearance of the HTML content to suit their specific needs.
- Duplicate option: when selected, a duplicate copy of the Htmlet component will be directly added to the dashboard.
Adding Visual Components to a Dashboard

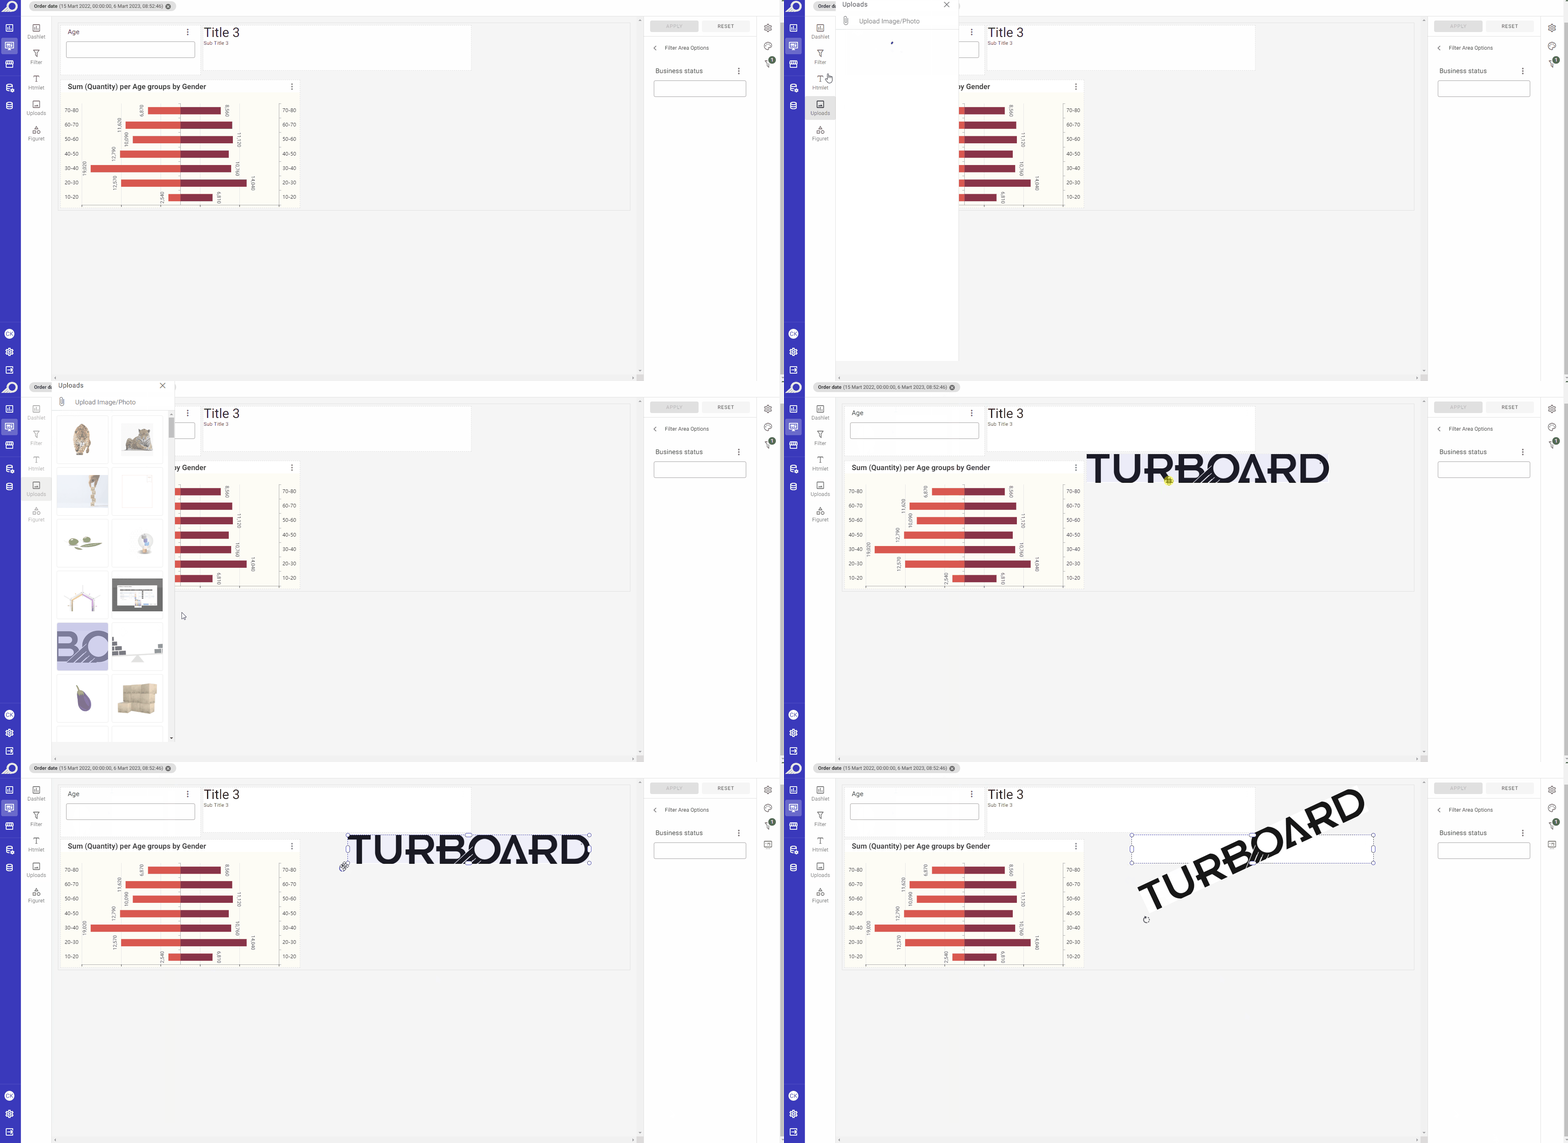
When selected, it enables users to add visual components, such as images or photos, to the dashboard. There are two ways to use this feature:
Firstly, users can choose images or photos from TURBOARD's library. The library contains a collection of visual assets that users can select from and add to their dashboards as needed. These assets are already optimized for use on the dashboard and are designed to be visually appealing and effective.
Alternatively, users can upload their own image files from their computers. This allows users to use their own images or photos, which may be more relevant or appropriate for the dashboard's content or purpose. Uploading images from your computer can be done by clicking the Attach icon available at the left-top corner of the “Uploads” side window. Once uploaded, the images can be added to the dashboard using the drag-and-drop feature or by selecting the image from the library.
Incorporating Visual Elements from the Library into a Dashboard

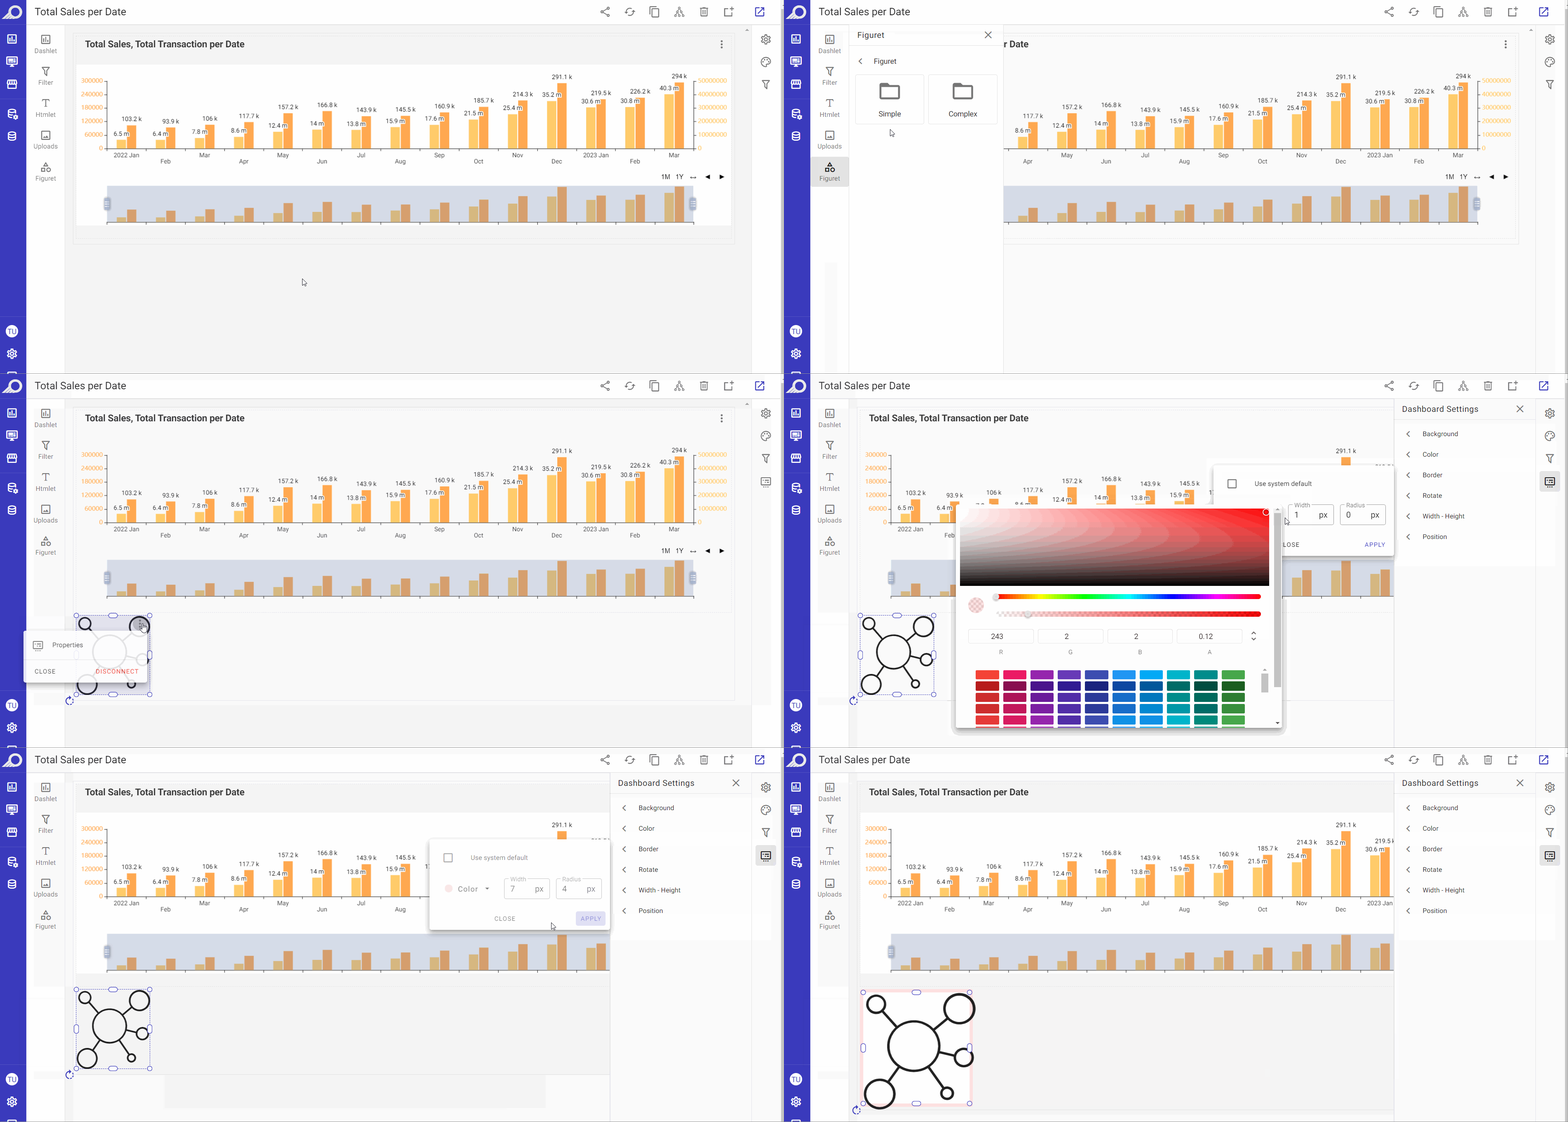
When selected, a library of patterns, symbols, images, special characters and other visual elements can be added to the dashboard.
Customizing Dashboard Elements and Components
You can customize any element added to the dashboard, including dashlets, Htmlets, figurets, filters, or other types of elements, by selecting it with the mouse and using the following options:
- Drag-and-drop the element to change its location or place it where desired on the dashboard.
- Resize the element using the mouse and adjusting the borders to achieve the desired size.
- Adjust the properties of the element by accessing the right-corner ellipsis menu and selecting the “Properties” option.
- Remove the element from the dashboard by accessing the right-corner ellipsis menu and clicking
DISCONNECTbutton.
These options allow for easy and efficient customization of elements on the dashboard, ensuring that the dashboard is tailored to meet the specific needs and preferences of the user.