Chart Dashlets
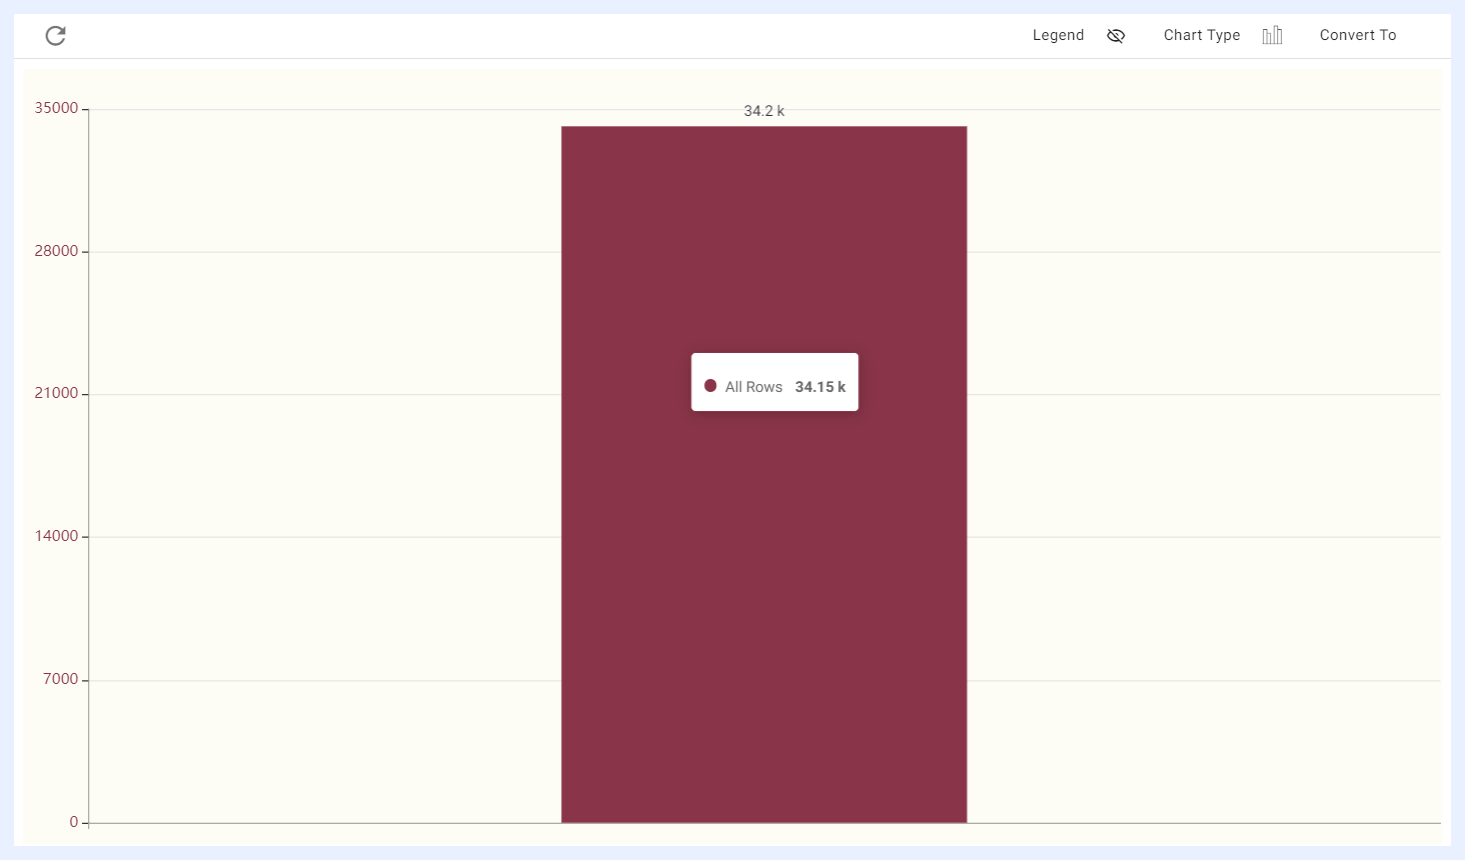
When creating a chart, its default will be a column chart with its measure as the count of the rows of the table.
Available Chart Types in TURBOARD
TURBOARD has a rich library of charts that can be used to display data in various ways.
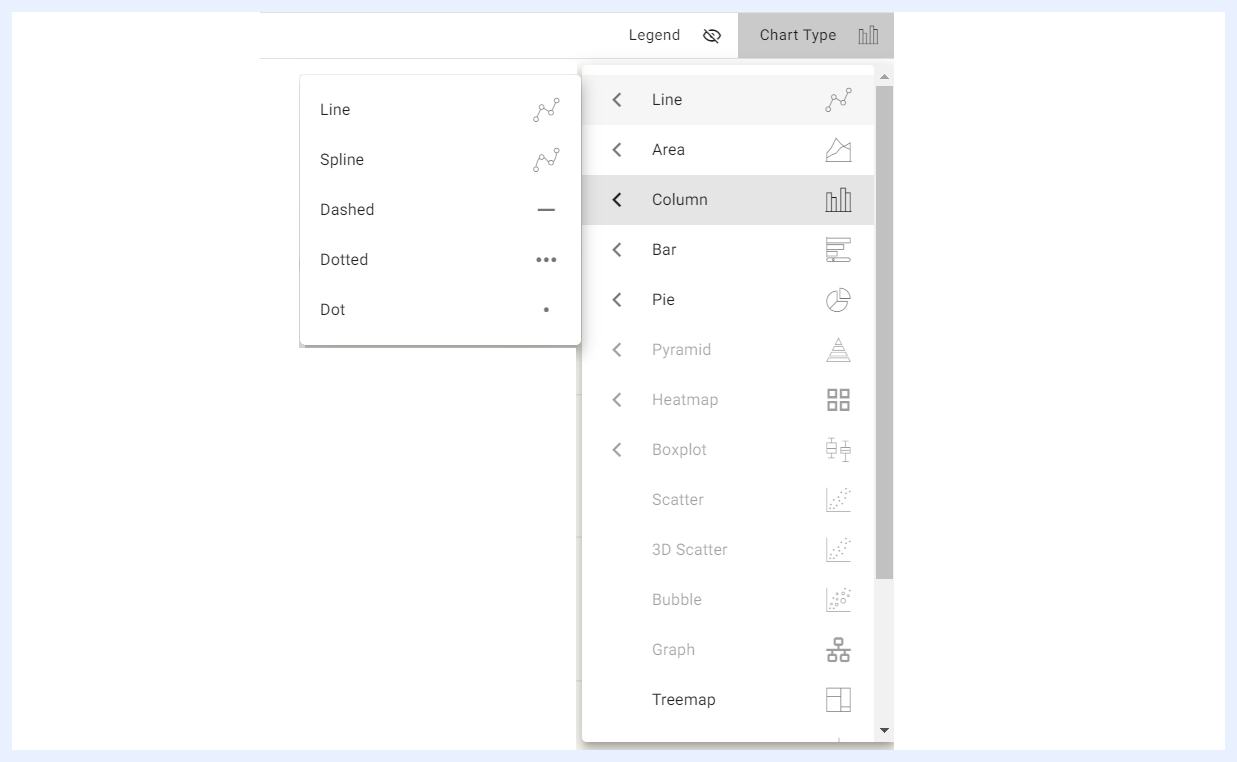
One of the features of TURBOARD is that users can change the chart type directly in the playground section of the platform while working on their dashlet.
When a user selects the required dimension(s) and measure(s), TURBOARD will automatically activate the appropriate chart type or types based on the number of dimensions and measures that have been selected. This helps users choose and find the chart type that works best for their data.
Line Chart
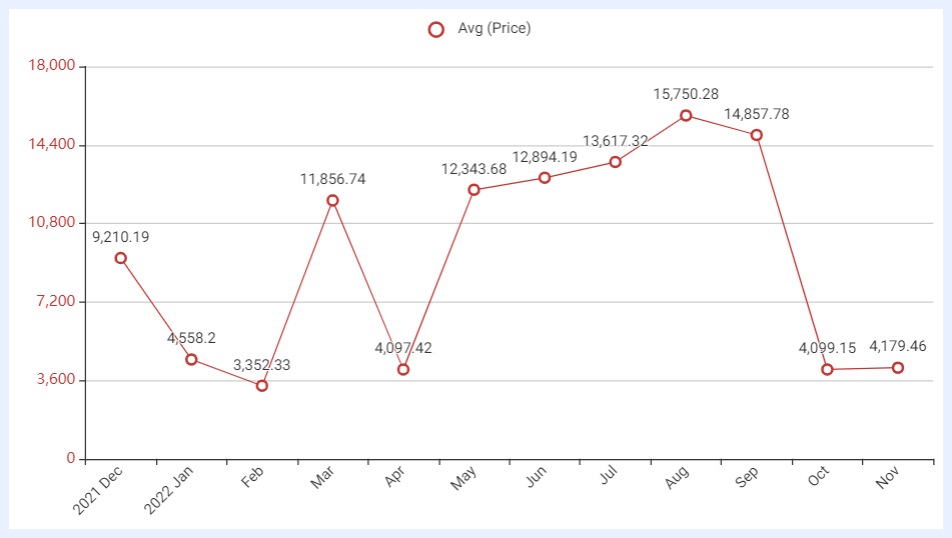
Definition: a line chart is a chart that displays data points as a series of connected data markers in the form of a line.
Uses: tracking trends and changes over time; comparing two or more data series over time; showing the correlation between two variables; highlighting peaks and valleys in the data; displaying data with a clear upward or downward trend.
Examples: visualizing stock market trends; tracking website traffic; monitoring sales figures; displaying scientific data such as weather patterns or disease outbreaks over time.
Dimensions and Measures: 2 dimensions with one measure, or 1 dimension with several measures.
Variances: Spline Line Chart, Dashed Line Chart, Dotted Line Chart, Dot Chart.
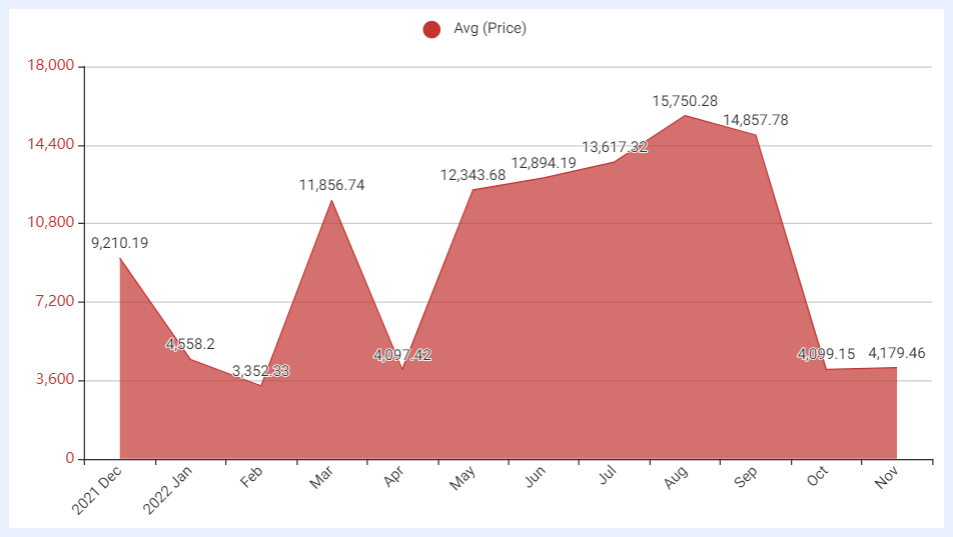
Area Chart
Definition: a chart that displays data points as a series of connected data markers, similar to a line chart, but with the area below the line filled in with color or shading to help emphasize the magnitude of the data over the selected dimension.
Uses: to show how a particular dataset changes over time in relation to the whole, or to compare the changes in two or more datasets over time. Often used in various scenarios where it is necessary to show changes in data over time, while also highlighting the magnitude of the changes.
Examples: visualizing changes in website traffic; showing changes in market share over time; displaying the progress of project milestones; tracking changes in the number of people affected by a disease outbreak; depicting changes in revenue or sales over time; visualizing the changing composition of a population or workforce over time; comparing the performance of multiple products or services over time.
Dimensions and Measures: 2 dimensions with one measure, or 1 dimension with several measures.
Variances: Stacked Area Chart, Area Spline Chart, Stacked Area Spline.
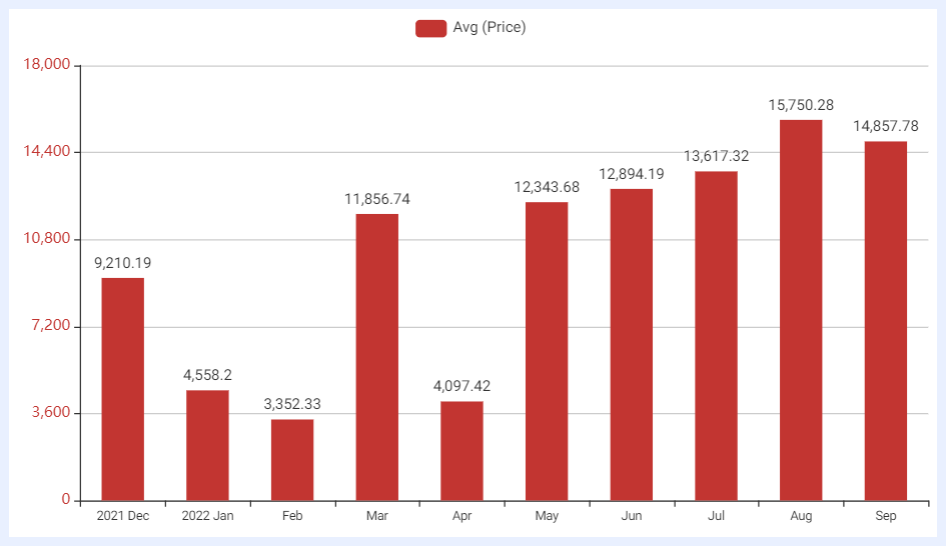
Column Chart
Definition: a graphical representation of data using rectangular bars arranged vertically, where the length of each bar represents the magnitude of a specific category or data point.
Uses: to display, compare or identify trends/patterns in data over a period of time or across categories. The time period is relatively long or the number of categories are numerous, which in some cases, using a navigator comes handy on the chart to choose and display a specific part of it, change the data segments and easily navigate through them. The data type can be nominal, ordinal, or quantitative.
Examples: tracking sales over time; presenting demographic data, such as the breakdown of a population by age, gender, or ethnicity; comparing data from different categories or groups.
Dimensions and Measures: 2 dimensions with one measure, or 1 dimension with several measures.
Variances: Stacked Column Chart. For Stacked Column Charts, the Order By Stack option allows sorting by a specific measure within the stack rather than only by the total stack value.
3D Column Chart
Definition: a column chart variant that visualizes data with two dimensions and one measure in a three-dimensional perspective. The Bar Colors option allows columns to be colored based on a selected dimension, providing clearer visual differentiation across categories.
Uses: comparing category values with an added sense of depth; highlighting dimensional groupings through color.
Dimensions and Measures: 2 dimensions with one measure.
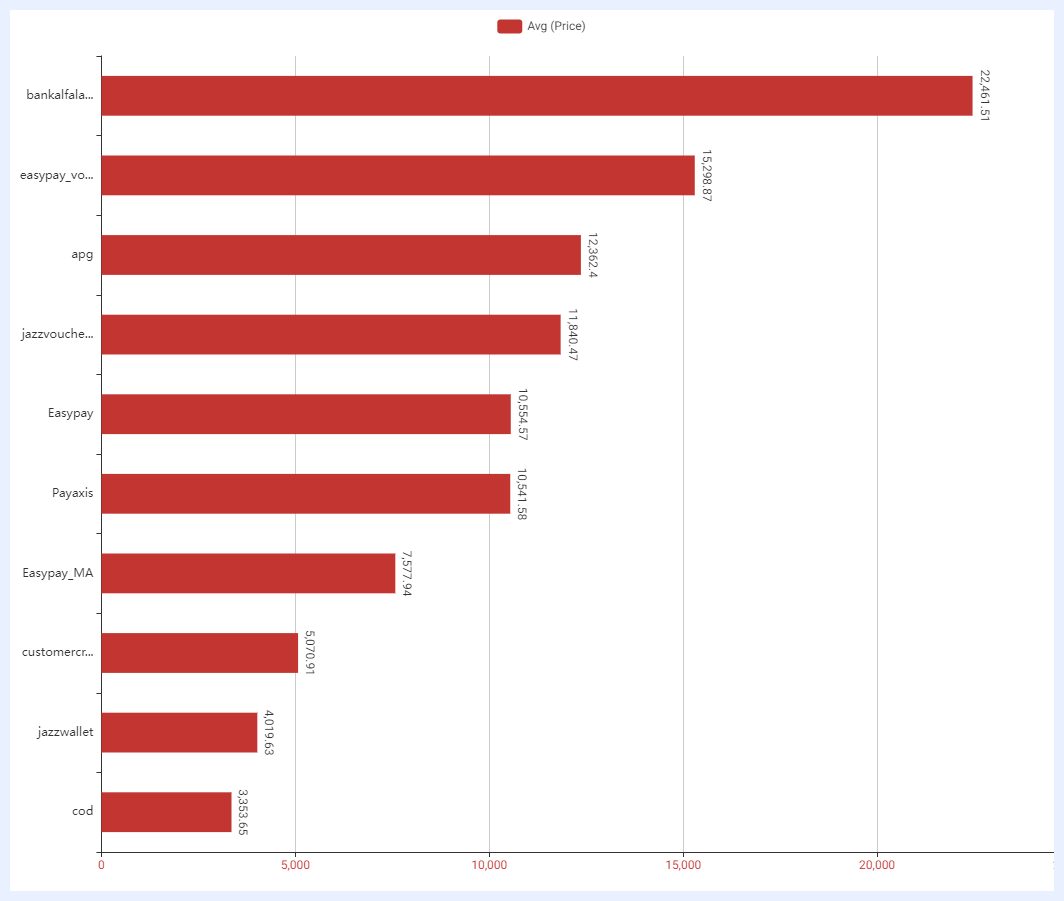
Bar Chart
Definition: a graphical representation of data using rectangular bars arranged horizontally, where the length of each bar represents the magnitude of a specific category or data point.
Uses: a suitable alternative to column charts, particularly when the category names are lengthy. They are particularly helpful when the main focus is on highlighting the differences in values rather than the categories. They are also ideal for comparing negative and positive values.
Examples: comparing the performance of different entities, such as sports teams, companies, or stocks; product comparison as it is easier to see the relative differences in values between the products; survey results as the longer category names become easier to read.
Dimensions and Measures: 2 dimensions with one measure, or 1 dimension with several measures.
Variances: Stacked Bar Chart, Symmetrical Double Bar Chart.
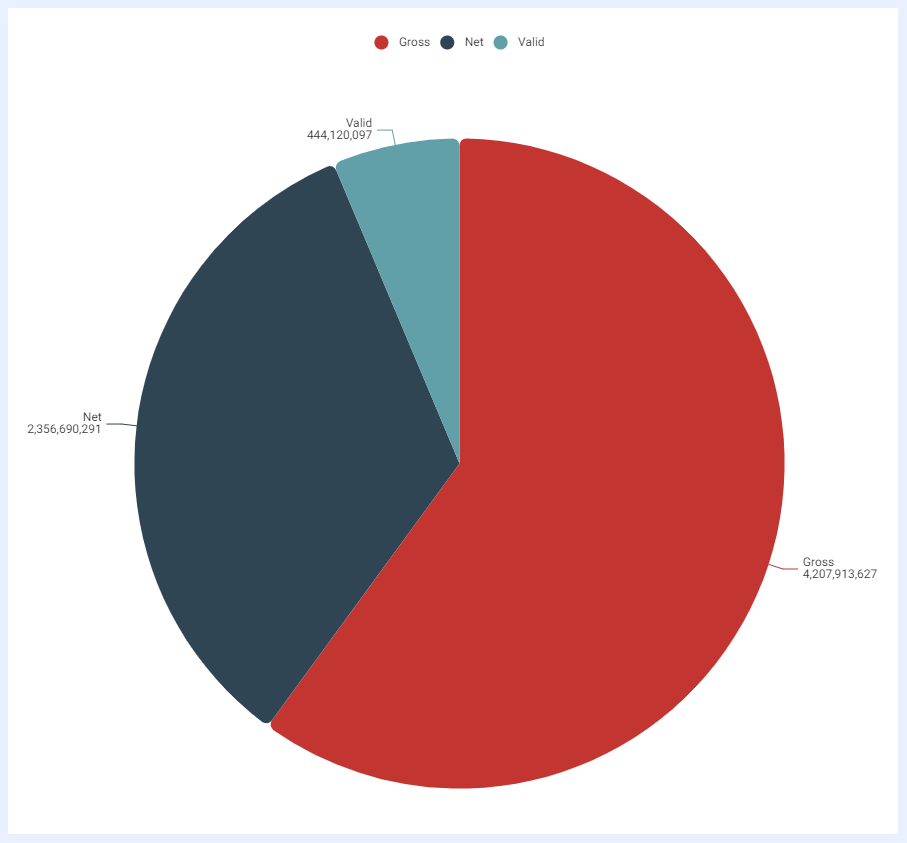
Pie Chart
Definition: a circular statistical graphic that is divided into slices to illustrate numerical proportion. The arc length of each slice is proportional to the quantity it represents.
Uses: comparing the proportions of different categories within a single dataset in which this dataset has a small number of categories (2 to 5); representing these proportions as a percentage of the whole dataset.
Examples: showing the market share of different companies or products; showing the percentage of time spent on different tasks during a workday, or the percentage of a website's traffic that comes from different referral sources; visualizing how a budget is allocated.
Dimensions and Measures: up to 2 dimensions with 1 measure only.
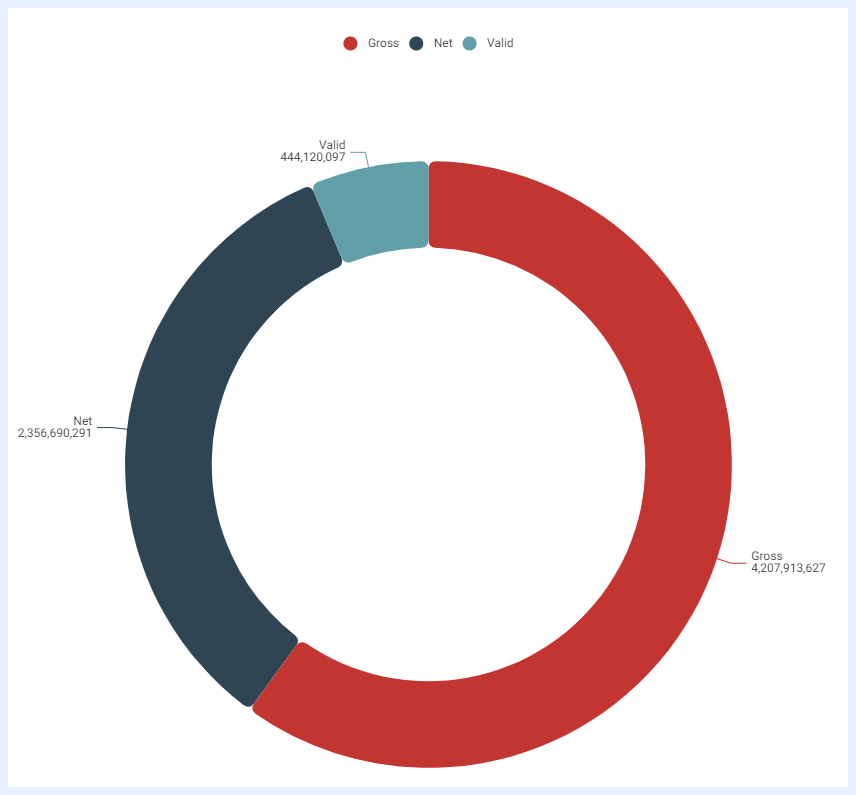
Donut Chart
Definition: a circular statistical graphic with a hole in the center and the circle is divided into slices to illustrate numerical proportion. The arc length of each slice is proportional to the quantity it represents, and the hole in the center can be used to show the whole dataset as a whole, and its relation to the sum of the individual slices.
Uses: its general use is similar to that of a pie chart, as it is also used to show the relationship between different parts and a whole.
Examples: showing the percentage of sales for each product category, with the empty center space showing the total sales for the period being analyzed, showing the percentage of a company's budget that is allocated to different departments, with the center space showing the total budget amount; showing the percentage of students enrolled in different academic programs, with the center space showing the total number of students enrolled.
Dimensions and Measures: up to 2 dimensions with 1 measure only.
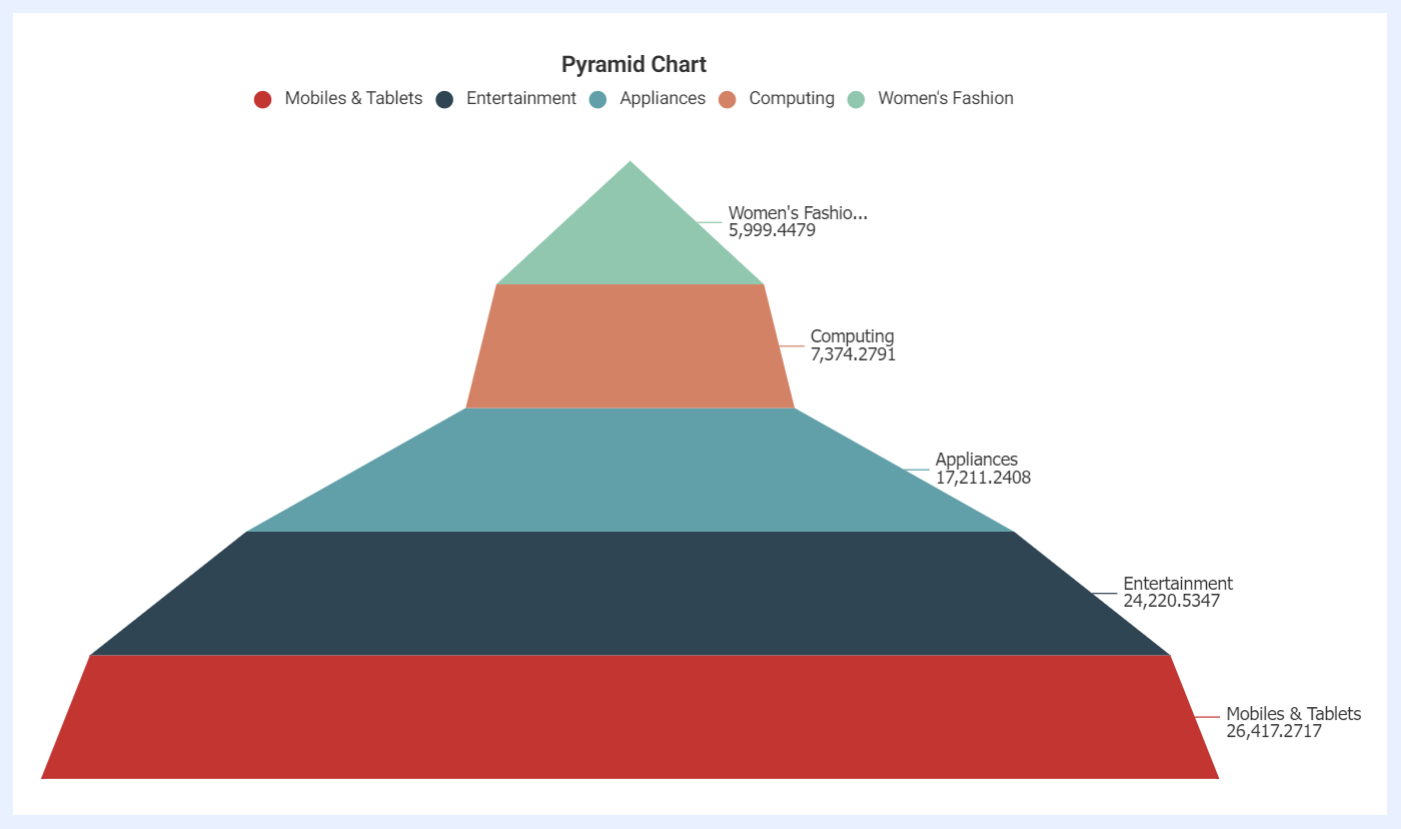
Pyramid Chart
Definition: a graphical representation of data that is shaped like a pyramid and displays data in a hierarchical structure with the largest or most important category at the top of the pyramid and smaller or less significant categories at the bottom.
Uses: to show the distribution of a dataset across different categories; ideal for explaining and visualizing categories, rankings or groupings of information.
Examples: commonly used in marketing and sales to show the distribution of customers or products by age, gender, or other demographics.
Dimensions and Measures: 1 dimension and 1 measure only.
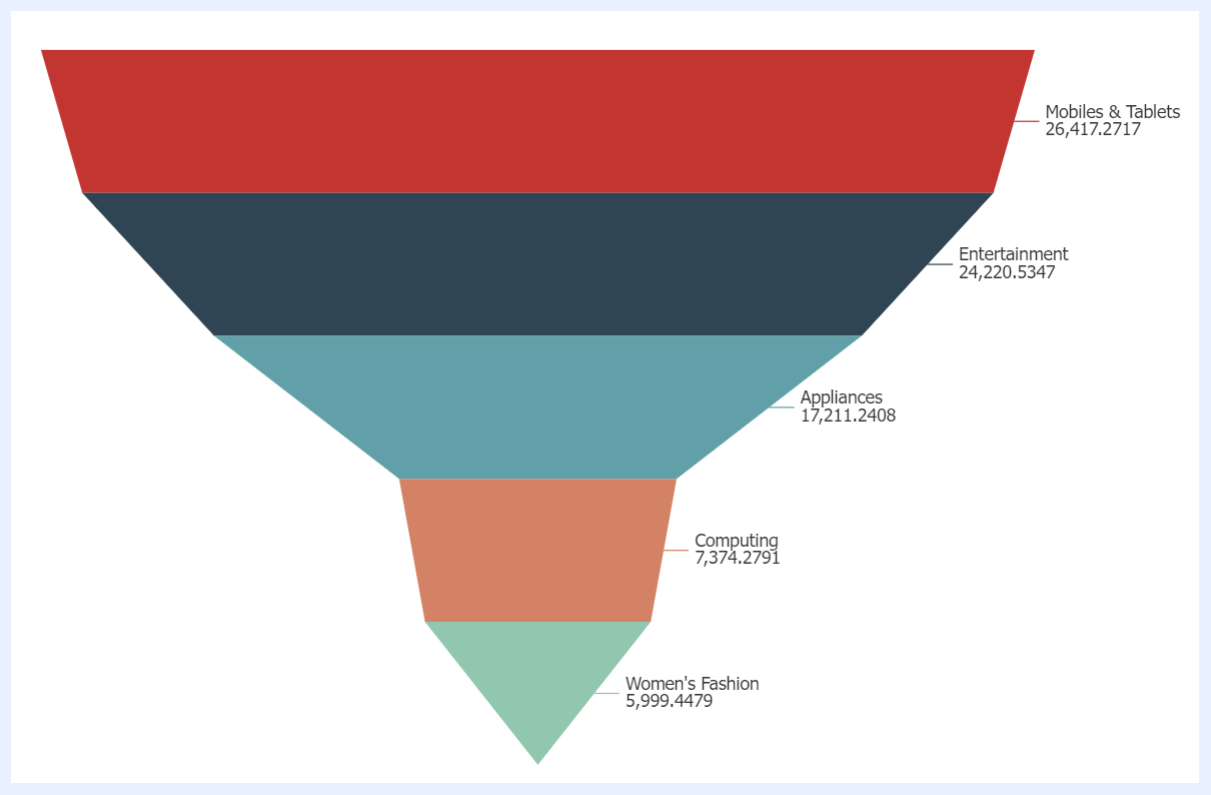
Funnel Chart
Definition: a graphical representation of data that is shaped like a funnel and displays data in a sequential order, with the top of the funnel representing the initial number of potential customers or opportunities and the bottom of the funnel representing the final number of successful conversions or outcomes.
Uses: commonly used to show the progression of data through a sequential process (represents a journey), such as a sales or a marketing funnel.
Examples: visualizing how many potential customers enter each stage (for example: awareness, interest, consideration, intent, and purchase) of the marketing funnel and how many ultimately make a purchase; visualizing the number of leads that enter each stage (such as lead generation, lead qualification, proposal, negotiation, and closing) of the sales funnel and how many of those leads ultimately convert to a sale.
Dimensions and Measures: 1 dimension and 1 measure only.
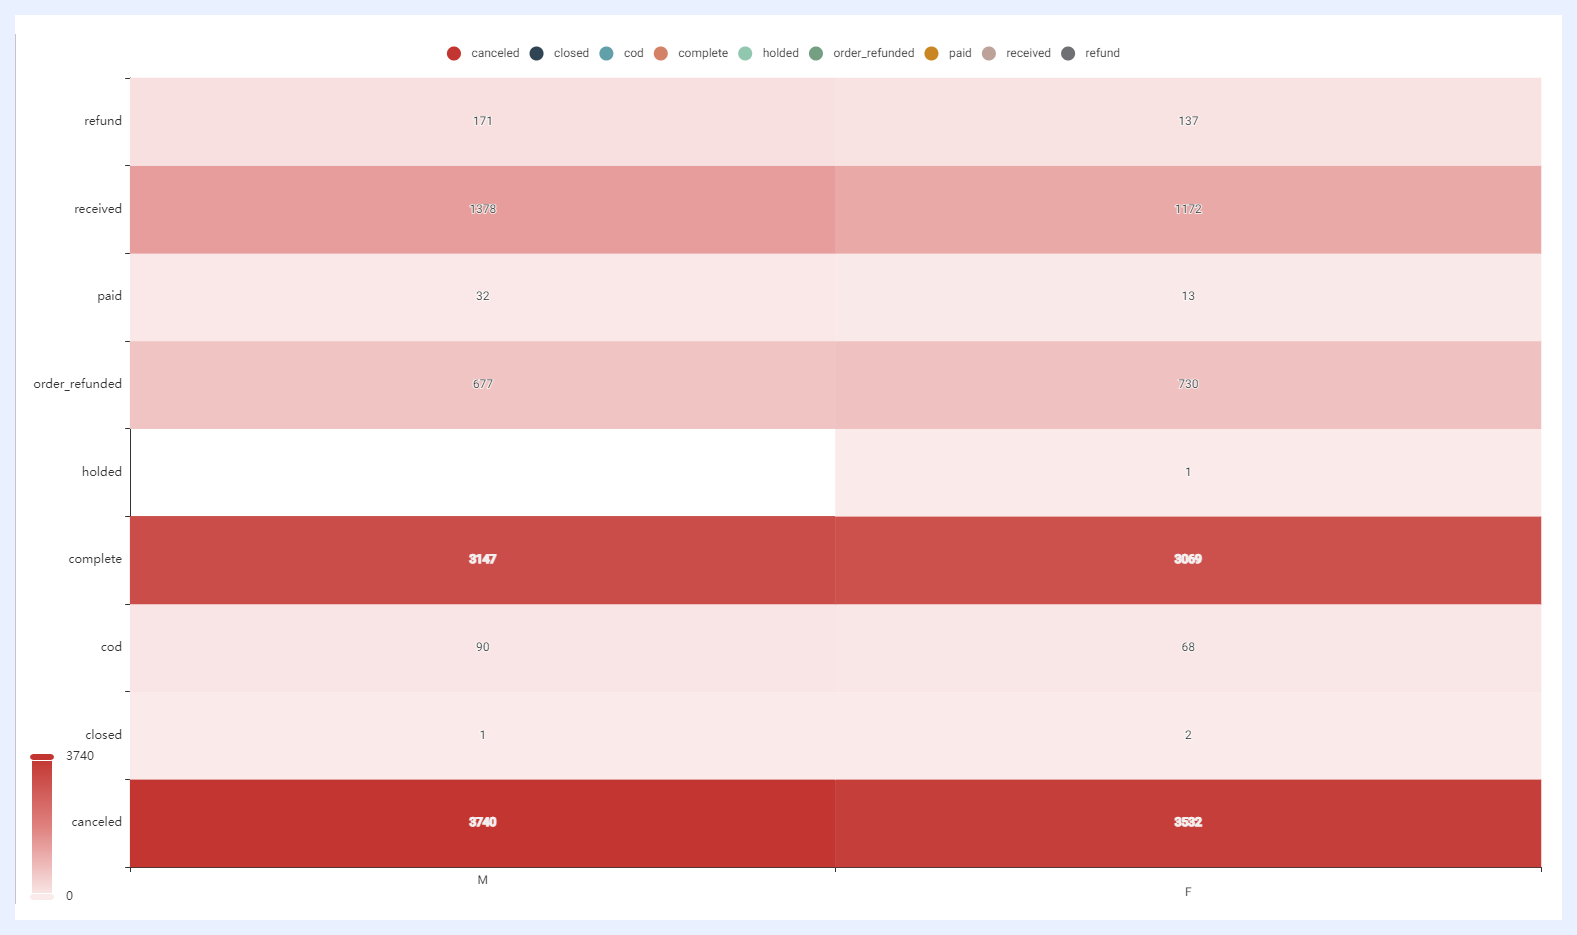
Heatmap Chart
Definition: a graphical representation of data where values are represented as colors in a color-coded matrix which allows to quickly and easily understand patterns and trends within the data by simply interpreting the gradient of these colors.
Uses: to show the distribution of data across different categories or dimensions and identify where values are concentrated and where they are more sparse; to visualize the relationship between two or more variables, helping to identify correlations and potential areas of interest.
Examples: analyzing user behavior, engagement, and conversion rates for social media marketers; visualizing user behavior and interaction with website elements such as buttons, links, and forms for website traffic analysis; visualizing the performance of players or teams for sports analysis.
Dimensions and Measures: 2 dimensions with 1 measure only.
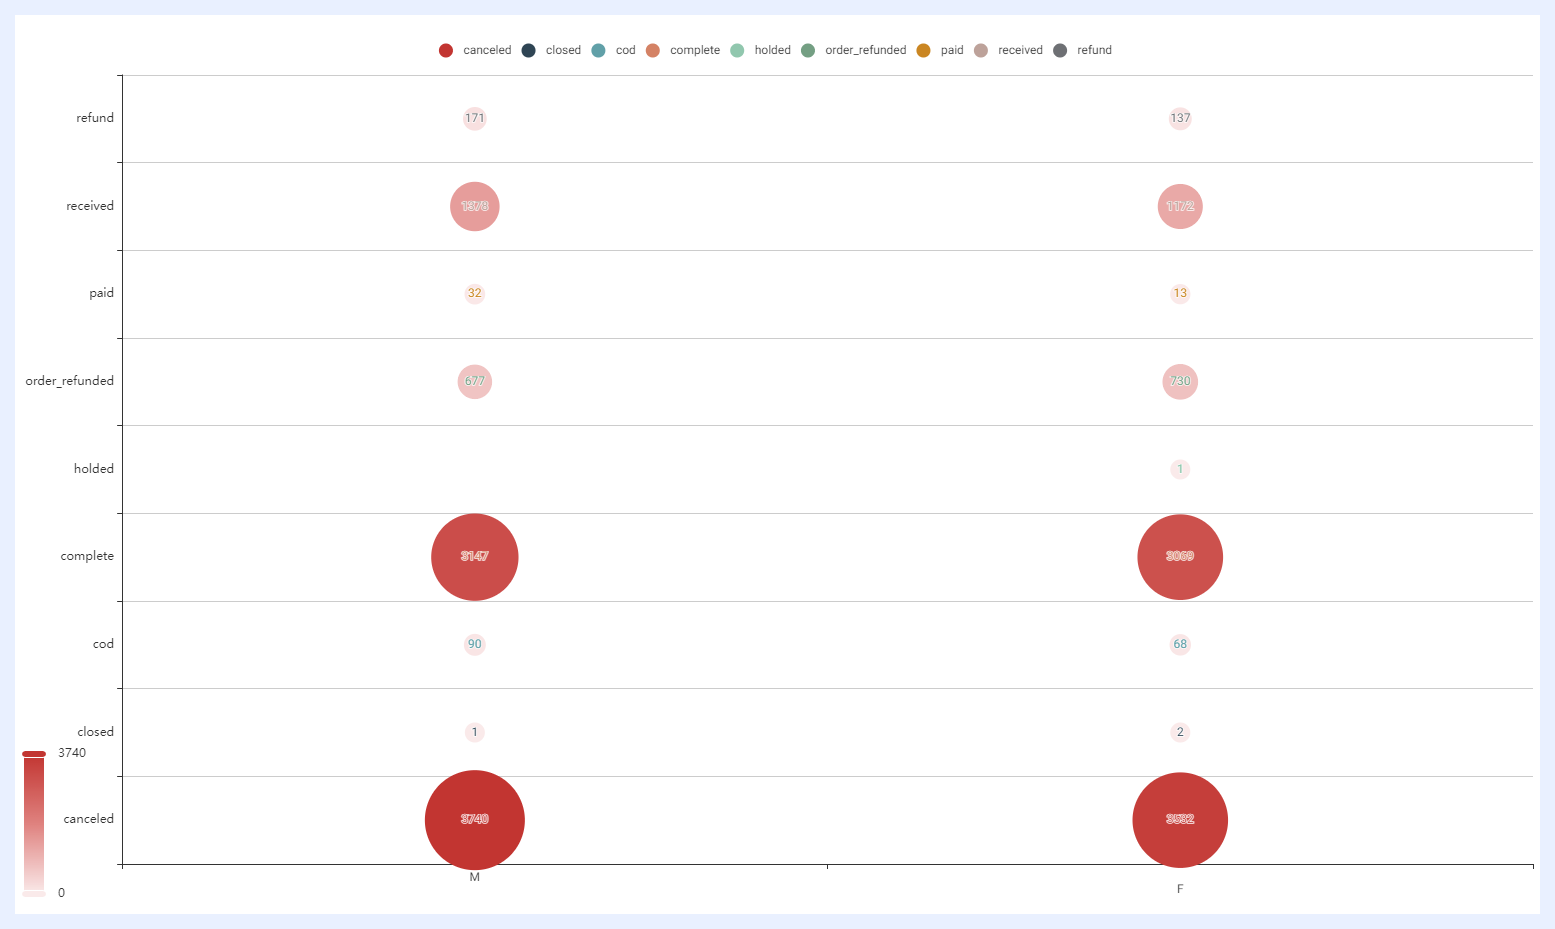
Punch-card Chart
Definition: a visualization tool that uses a grid of small circles, rectangles, or other shapes to represent data values. Each circle can be “punched” or left blank to indicate whether a particular value is present or absent. They represent the count or frequency of a particular event or status associated with each data point.
Uses: to visualize categorical data and track the frequency or occurrence of specific events or statuses; useful for tracking data over time or for comparing different categories or groups.
Examples: tracking attendance; monitoring production output; monitoring voting results; monitoring inventory and stock levels; analyzing survey responses; monitoring the severity or frequency of patient symptoms.
Dimensions and Measures: 2 dimensions with 1 measure only.
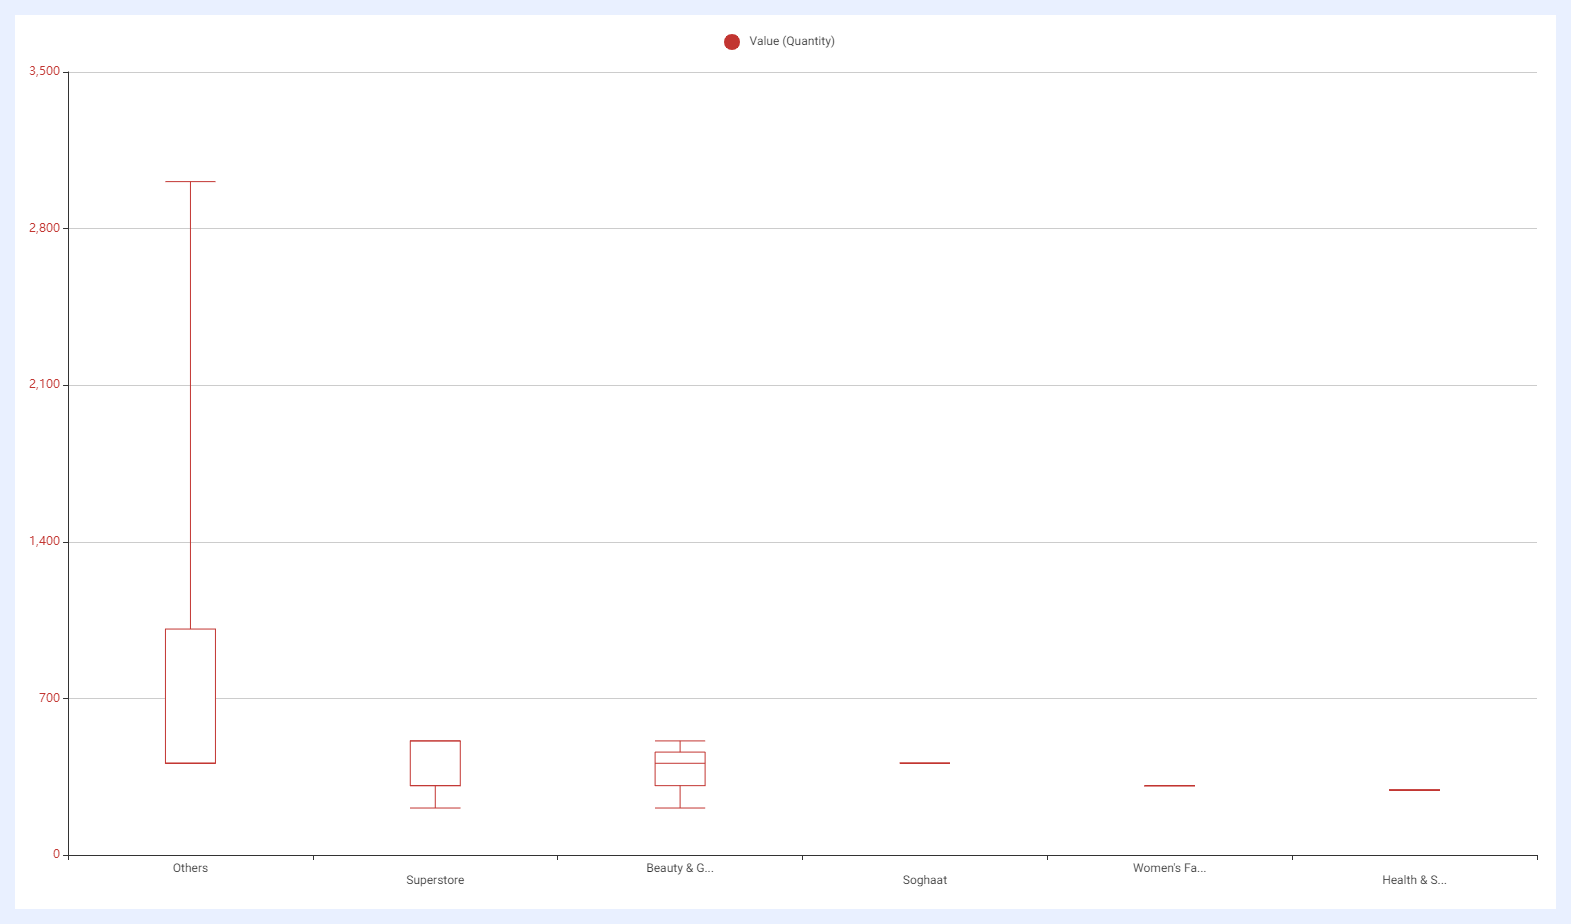
Boxplot Chart
Definition: a visualization tool that provides a visual summary of the distribution of a dataset. It displays a box with “whiskers” extending from the box to indicate the spread of the data.
Uses: commonly used to identify outliers, show the range of the data, and compare different datasets; particularly useful for displaying data with a large number of observations, or for identifying potential issues with the data, such as skewness or multimodality.
Examples: comparing the price range of different stocks, with each box representing a specific stock and the whiskers indicating the spread of the data; distribution of temperature or precipitation data over a given time period, with the box representing the interquartile range (IQR) and the whiskers indicating the minimum and maximum values; comparing the distribution of test scores for different groups of students, such as males vs. females or students from different schools.
Dimensions and Measures: 1 dimension only and several measures.
Variances: Horizontal Boxplot.
Scatter Chart
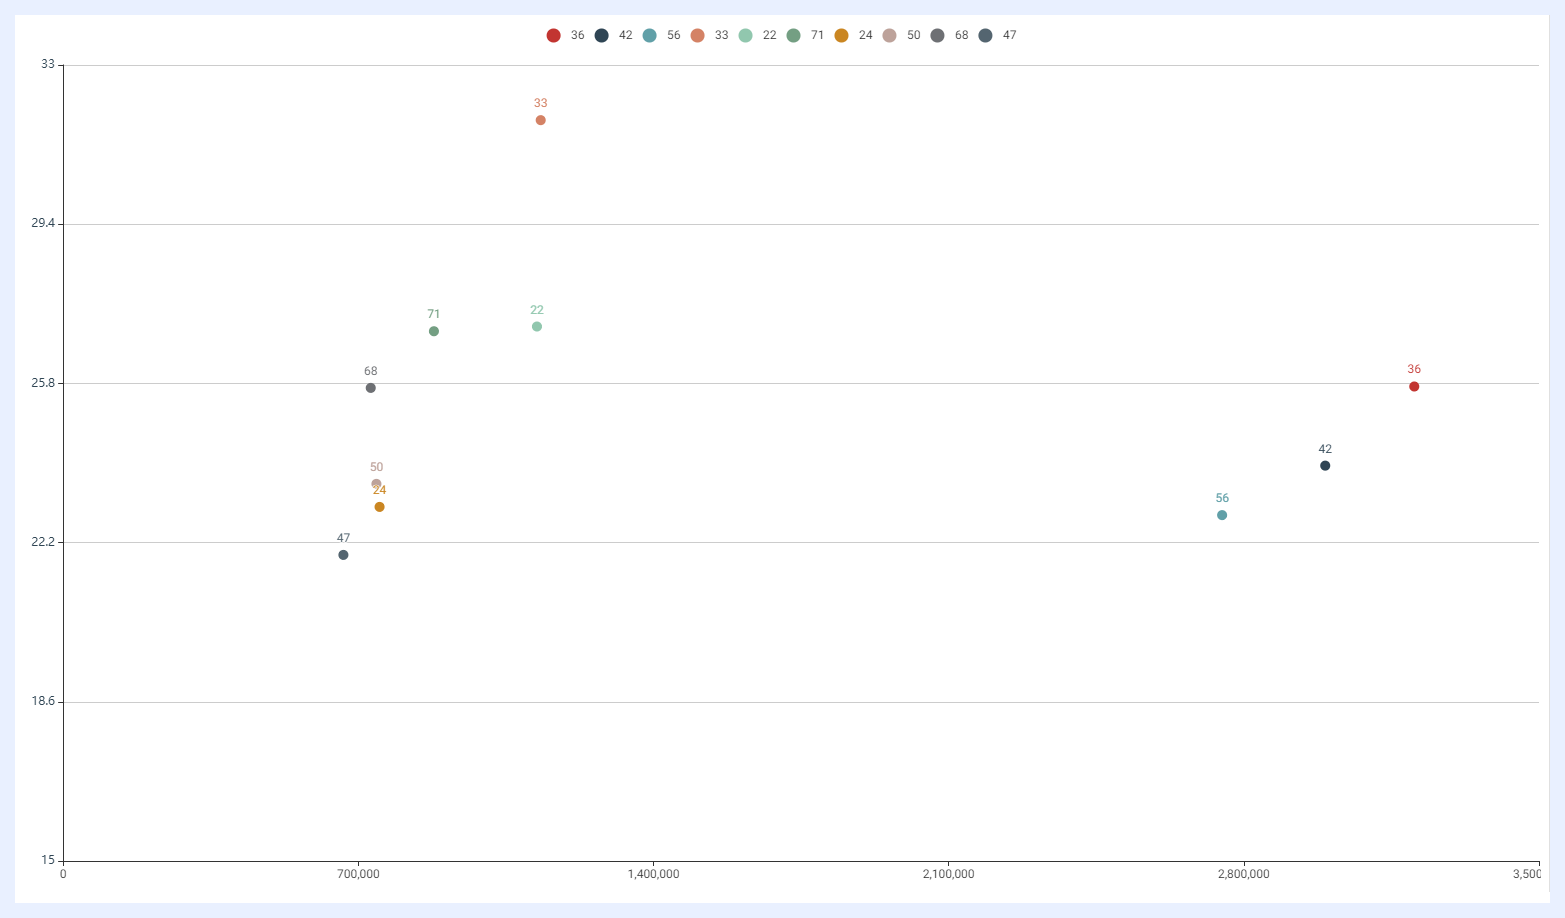
Definition: a diagram in which the values of two variables (2 measures) are plotted along two axes, the horizontal x-axis and the vertical y-axis. Each point on the scatter plot represents a pair of (x, y) values, where x is the value of one variable and y is the value of the other variable.
Uses: to understand or reveal the relationship between the two variables; to show how a change in one variable affects another; to reveal outliers and anomalies in the data. The two variables shall be continuous, i.e. can take on any value within a certain range unlike discrete or categorical that can only assume specific values or categories.
Examples: correlation analysis as in analyzing the relationship between a student's study time and their test score or the relationship between temperature and product defects for quality issues, or the relationship between revenue and expenses for financial analysis, or the relationship between a person's age and their income.
Dimensions and Measures: 1 dimension and 2 measures only.
3D Scatter Chart
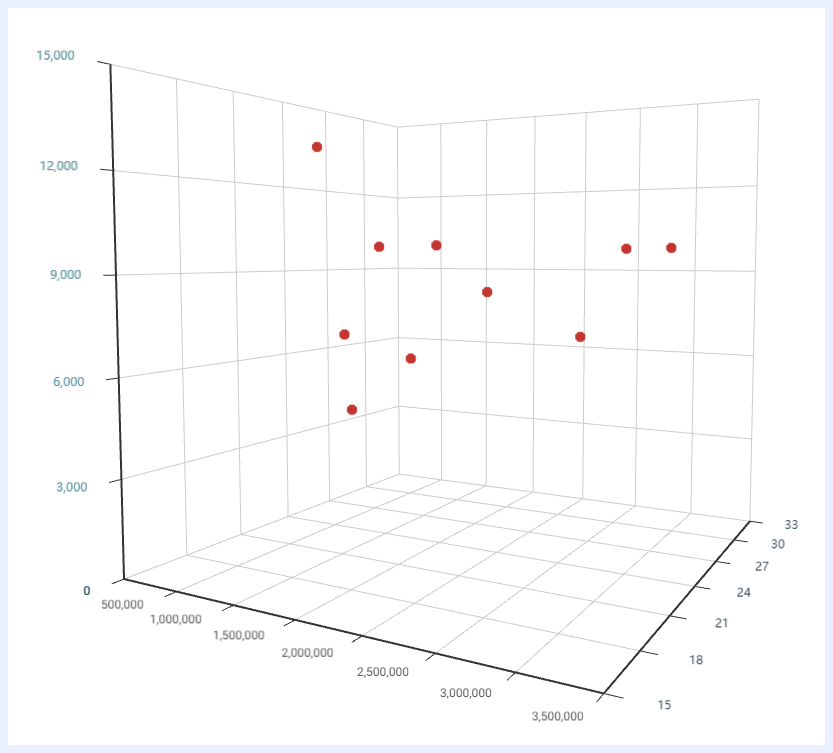
Definition: instead of just two variables as in a scatter chart, a 3D scatter plot displays values for three variables (3 measures) where the third variable is represented by the size or color of the points. This allows showing the third variable and its relation with the other two by adding a visual depth to the plot.
Uses: to understand or reveal the relationship/correlation between the three variables; to show how a change in one variable affects another; to reveal outliers and anomalies in the data. The three variables shall be continuous, i.e. can take on any value within a certain range unlike discrete or categorical that can only assume specific values or categories.
Examples: engineering analysis to help optimize the performance of mechanical systems by visualizing the relationship between three variables, such as speed, torque, and power; environmental analysis to help develop appropriate interventions by visualizing the relationship between three variables, such as temperature, humidity, and air pollution levels; medical research to identify risk factors for certain health conditions and to develop appropriate treatment plans by analyzing the relationship between three variables related to patient health, such as age, blood pressure, and cholesterol levels.
Dimensions and Measures: 1 dimension and 3 measures only.
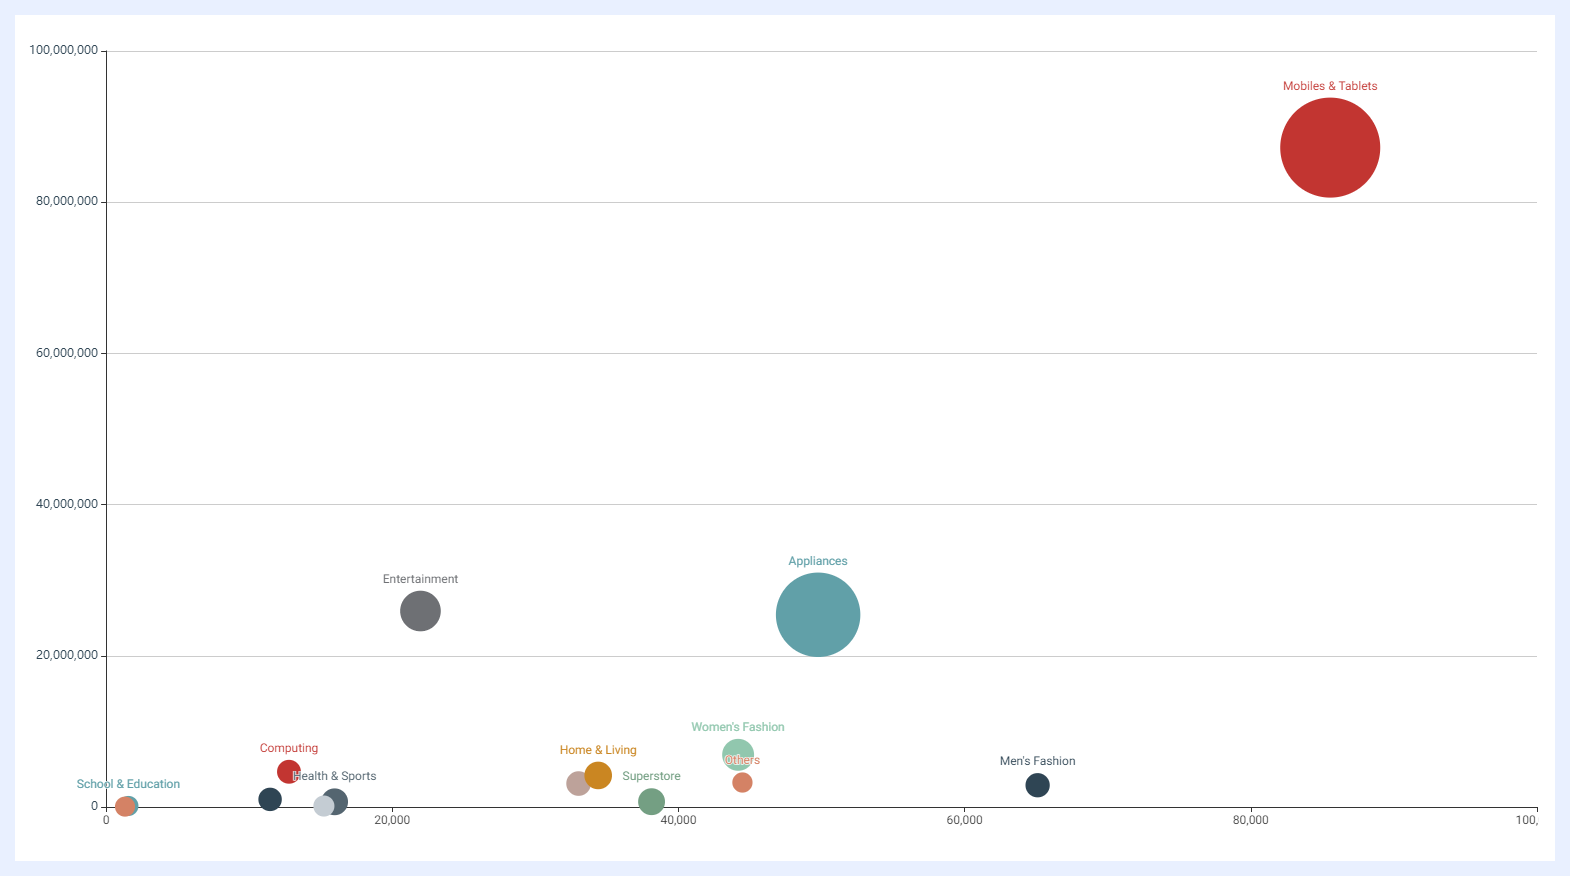
Bubble Chart
Definition: a visualization tool that displays data points as bubbles, with the size and color of the bubbles representing additional variables beyond the two plotted on the x and y axes. The dimension is represented by the x-axis, and three measures are represented by the y-axis, the size of the bubbles, and the color of the bubbles. The x-axis represents the primary variable being compared, while the size and color of the bubbles provide additional context and information about the data points being displayed.
Uses: often used to display complex data with three variables, such as market share or population data as they are particularly useful for comparing large numbers of data points and identifying patterns or trends within the data.
Examples: displaying the population of different countries, with each bubble representing a specific country and the size of the bubble representing the population size; comparing the market share of different companies, with each bubble representing a specific company and the size and color of the bubble representing additional variables such as revenue or profit; displaying demographic data for a geographic region, with each bubble representing a specific area and the size and color of the bubble representing different demographic variables such as age or income.
Dimensions and Measures: 1 dimension and 3 measures only.
Opacity: for Bubble, Scatter, 3D Scatter, and 3D Column charts, opacity can be set to Auto (adjusts dynamically based on data density) or Manual (a fixed value for cleaner visuals in dense or overlapping data scenarios).
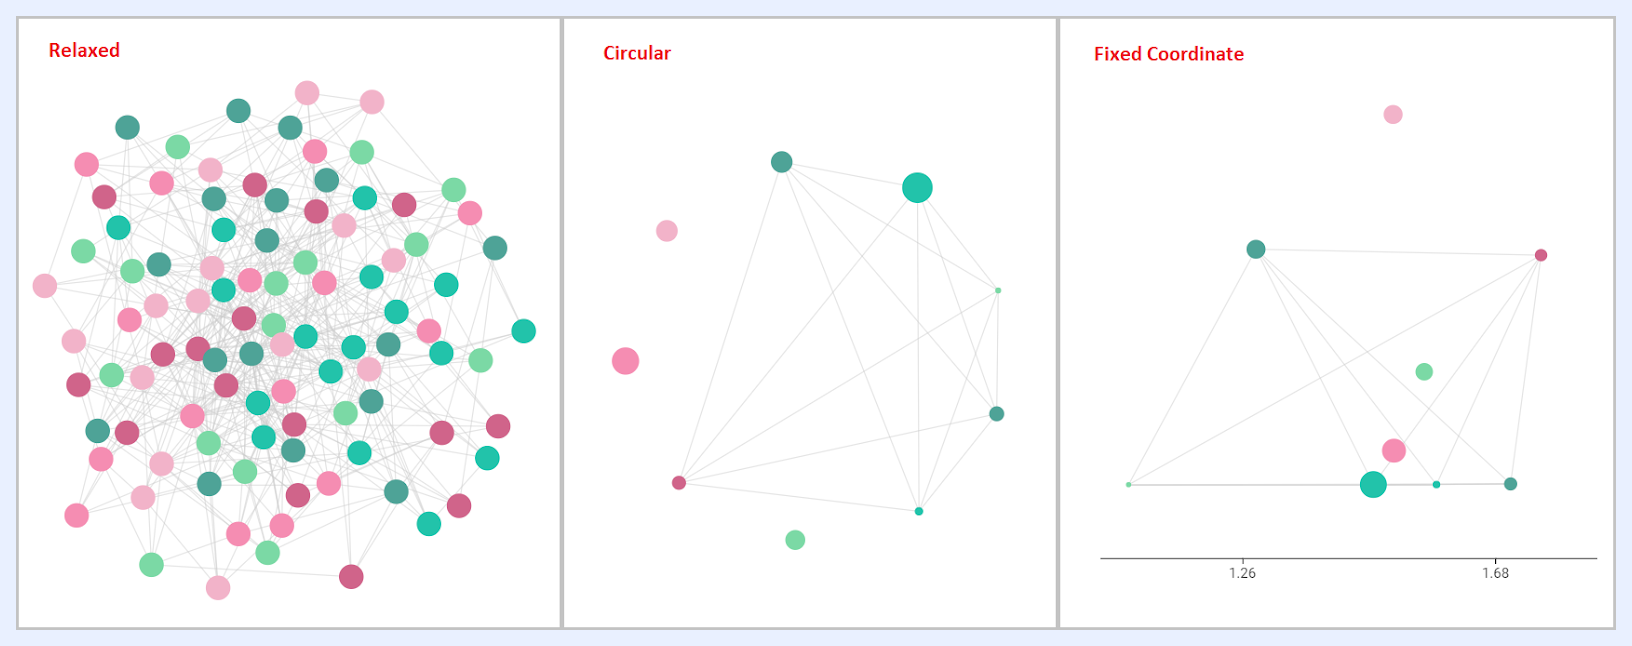
Graph Chart
Definition: a visualization tool that represents connections between entities. It is also known as a “Network Graph” and offers three view options: fixed coordinates, relaxed, or circular layouts. In a Network Graph, nodes represent entities, and edges represent the connections between them. The layout options help visualize the relationships between entities in different ways, allowing for better analysis of complex networks.
Uses: commonly used to visualize relationships and connections between entities, such as social networks, organizational structures, or any interconnected data. It is particularly useful for identifying clusters, communities, or central nodes within a network.
Examples: visualizing the relationships between products or branches of a company. Each node represents a product or branch, and the edges represent the connections between them. The layout options can help identify clusters of related products or branches, as well as central products or branches within the network.
Dimensions and Measures: 1 dimension only and 2-3 measures.
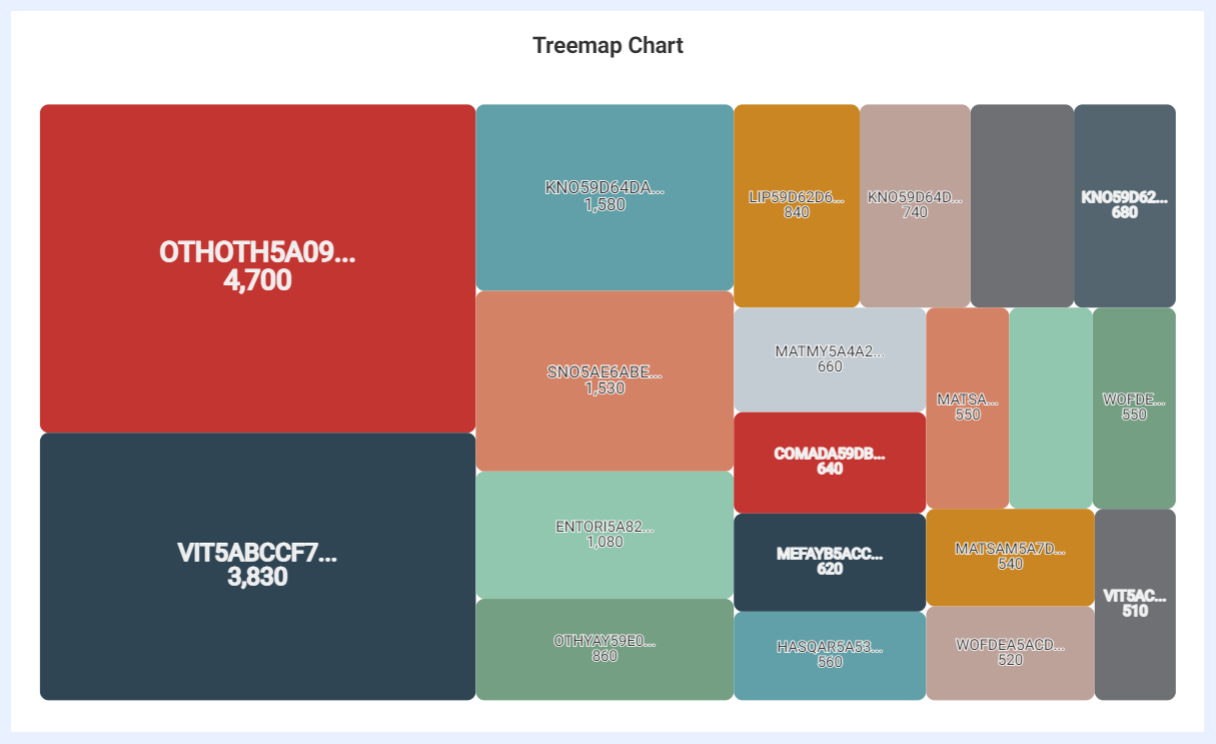
Treemap Chart
Definition: a chart that displays a wide range of hierarchical data as nested rectangles, where each rectangle represents a group or category of information, and its size is proportional to the data they represent to immediately perceive which categories are the most significant or insignificant.
Uses: useful for displaying large amounts of data in a compact, space-efficient way, while still allowing viewers to easily compare and understand the relative sizes of different categories; particularly effective for displaying data with many levels of hierarchy in a clear and concise way.
Examples: visualizing market share data to quickly see which companies or products dominate the market and which are smaller players, visualizing financial data (such as portfolio allocations or budget breakdowns) to see the proportions of different investments or expenses and how they are distributed across different categories, displaying geographic data, where each rectangle represents a region or country and its size represents a statistic such as population, GDP, or energy consumption.
Dimensions and Measures: up to 2 dimensions with 1 measure only.
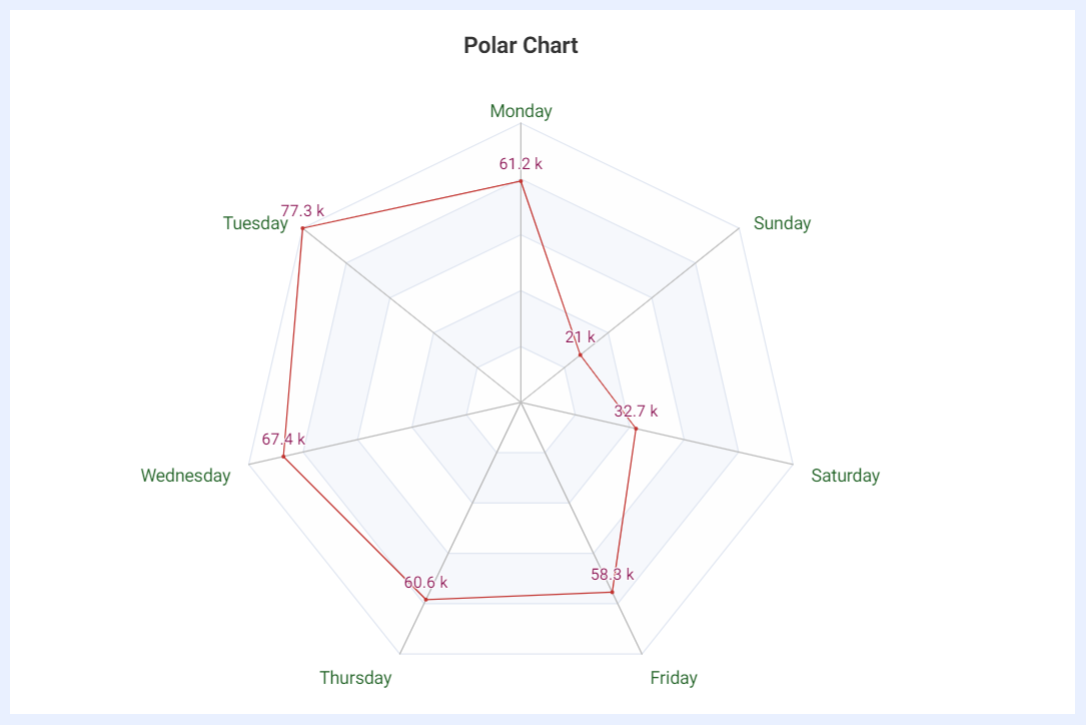
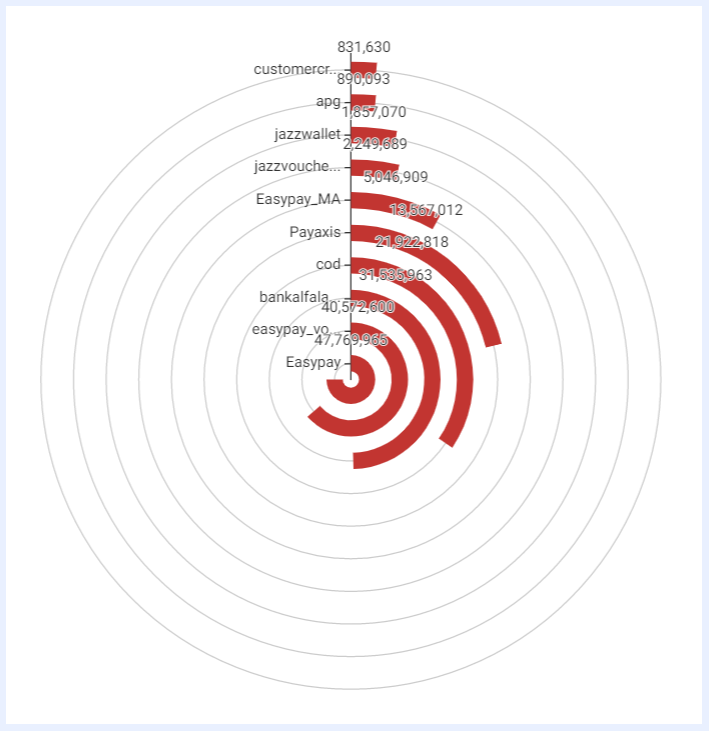
Polar Chart
Definition: a chart that displays multivariate data on dimensions with three or more quantitative variables using axes that start from the same point, arranged in a circular manner around the center, resembling a compass or radar screen.
Uses: comparing multiple variables and seeing how they relate to each other, as well as identifying patterns and trends in the data.
Examples: for quality control by comparing multiple production lines or factories on different performance indicators; for market research by comparing the distance of multiple data points for each brand or product; for performance evaluation to compare the performance of departments or employees by plotting different performance metrics on separate axes.
Dimensions and Measures: 1 dimension and 1 measure only.
Multilayered Donut Chart
Definition: a type of donut chart that displays multiple datasets in layers, each represented by a different ring within the chart. Each layer represents a percentage or proportion of the total dataset, and the size of each ring is proportional to the data it represents.
Uses: to visualize complex datasets with multiple categories or subcategories as they can effectively convey how each category or subcategory contributes to the overall dataset.
Examples: visualizing sales by product category with each layer of the chart representing a different category; displaying the effectiveness of different marketing campaigns with each layer representing a different campaign.
Dimensions and Measures: 1 dimension only and several measures.
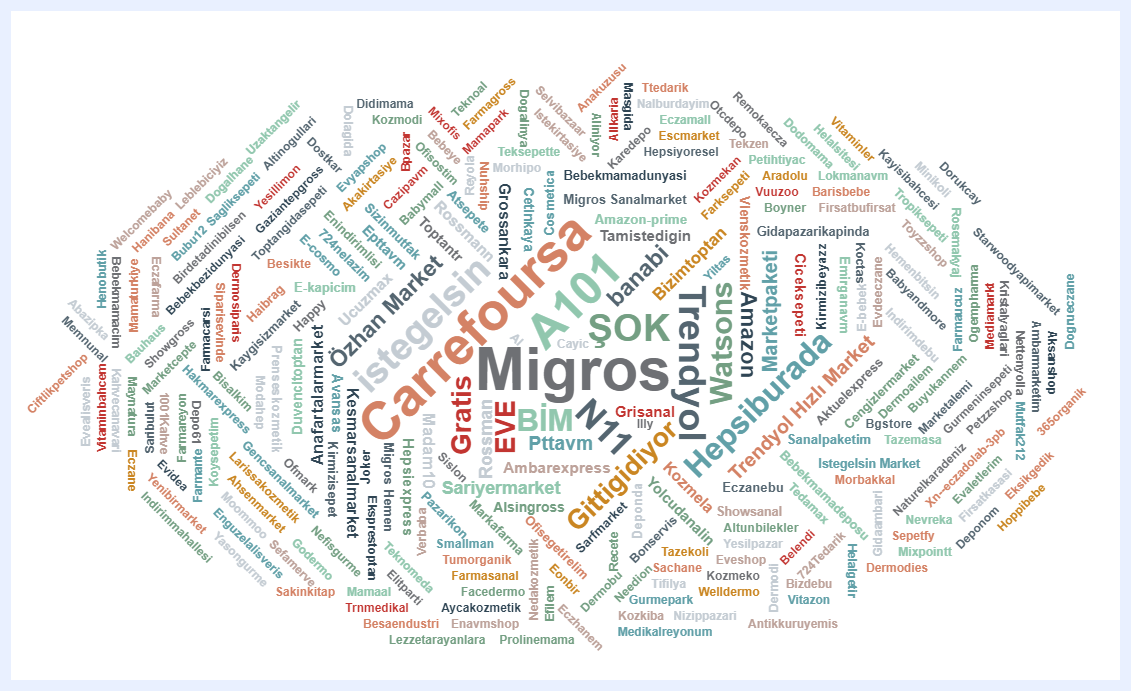
Word Cloud Chart
Definition: a visualization technique (also known as a “Tag Cloud”) that represents text data in a visual format. The words in the text data are arranged in a cloud-like shape, with the most frequently used or prominent words appearing larger and bolder than less frequently used words.
Uses: often used to analyze large volumes of text data and identify the most commonly occurring words or themes.
Examples: analyzing customer feedback and identifying the most commonly mentioned topics or issues; analyzing social media posts and identifying the most commonly used hashtags or keywords; analyzing survey responses and identifying the most commonly given answers or themes.
Dimensions and Measures: 1 dimension and 1 measure only.
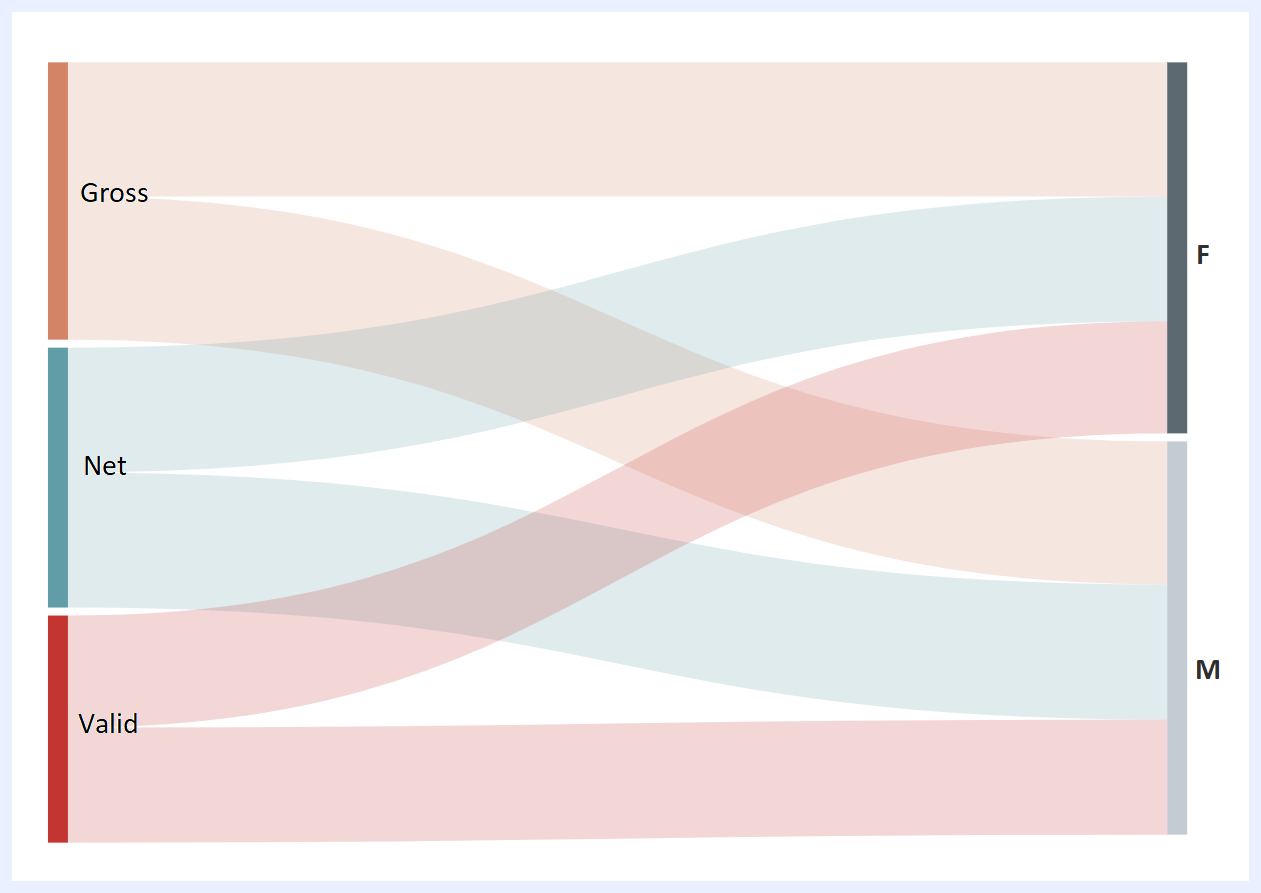
Sankey Chart
Definition: a type of visualization (also known as a “Flow Diagram” or a “Process Map“) that represents the flow of data, information, or materials through a system. The chart uses a series of arrows or flow lines of varying widths to show the direction and magnitude of the flow. It helps examine the correlation of flow type data. Sankey charts typically have two dimensions: a source dimension and a target dimension, which represent the origin and destination of the flow. They also have one measure, which is the magnitude of the flow. The width of the flow lines in the chart represents the magnitude of the flow with wider lines indicating a larger flow.
Uses: often used to analyze and visualize complex systems, such as supply chains, energy usage, or customer journeys. They can help identify inefficiencies, areas for improvement, and opportunities for optimization within a system.
Examples: visualizing the flow of energy through a building or a city, showing how energy is produced, distributed, and consumed; visualizing the flow of materials, products, and information through a supply chain, showing where delays or bottlenecks occur; visualizing the flow of customers through a website or an app, showing how they move from one page or feature to another.
Dimensions and Measures: 2 dimensions and 1 measure only.