TURBOARD Overview
Intended Use
TURBOARD is a Business Intelligence platform that enables businesses to connect to their data, integrate it from its various sources and locations, visualize and analyze it in a unified interface to gain insights on their performance, make informed decisions, apply informed strategies, drive better outcomes, identify follow-on actions, and improve efficiency.
TURBOARD provides a plethora of BI tools and a rich library for building custom visualizations, including 25+ chart types, embedded analytical formulas, extended slicing and filtering, automatic reporting and alarms, and much more. It is a self-service integrated BI solution for all types of users in all business sectors and industries. Click here to learn more.
Additional companion modules are available and can be configured with the main BI interface. They allow additional features to be utilized as part of the platform’s BI capabilities, such as additional mapping, GIS visualizations, and data collection.
Who Can Use TURBOARD
TURBOARD aims at increasing analytical literacy and democratization of data access and utilization as a self-service Business Intelligence solution. Therefore, it can be used by any user in any business as it doesn’t require programming experience nor technical knowledge to be fully utilized.
It can be highly interesting for IT managers, data analysts, information analysts, consultants, business architects, business information managers, business analysts, marketing and sales managers, project managers, and financial analysts. Furthermore, it also plays a significant role for users in top management positions and critical decision-makers.
User Interactivity
TURBOARD dashboards are designed to address user interactivity as it is a must-have feature in any BI platform. Dashboards are remarkably interactive to allow end users to explore the data on a deeper level and make well-informed, data-driven business decisions through various interactive features and tools.
Multiple and custom filters, click-to-filter, drill-downs, drill-throughs, charts’ interval navigators, dynamic dimensions and measures, cloning dashboards for side-by-side comparisons and what-ifs scenarios are self-service data management tools that enable end users to answer any question that arises during the analysis process, mix and compare real-time and past data, view and play with data from multiple data sources in a centralized dashboard, and much more.
Platform Deployment & Installation
TURBOARD can be deployed as an independent platform, or whitlabelled under the using business name and brand, or embedded as part of another platform. It can be installed on public/private cloud or on-premise devices, and it is mobile-compatible.
For filter and cache performance, filter value storage is held in RedisSearch indexes, which keeps filter dropdown loading responsive. Enterprise deployments can also use Redis Sentinel for high availability, so that if the primary Redis instance goes down, a replica is promoted automatically without manual intervention.
TURBOARD Terminology
The table below explains the key terms used within TURBOARD platform. These terms are essential for understanding and effectively utilizing the general visual and data elements and functionalities of TURBOARD. Each term is defined to provide clarity on its role and usage, ensuring you can navigate and make the most of our powerful data management and business intelligence tools.
| TURBOARD Key Terminology Explained | |
|---|---|
| View: | A “View” is a set of data that is used for the required visualization and/or analytics. It may consist of a set of tables, an Excel/CSV file, or an SQL query. |
| Dashlet: | A “Dashlet” is a unit/component of visualization and/or functionality. It can be a chart, a pivot table, an SVG or GIS map, an infocell, or a gauge. |
| Dashboard: | A “Dashboard” is a collection of dashlets. It is a container consisting of multiple dashlets that provides you with a centralized view of information and insights. |
| Showcase: | A “Showcase” is a collection of dashboards and is shared with end-users. |
| Clone: | The “Clone” feature is TURBOARD’s patented solution to easily compare changes in dashboards’ visualizations by presenting these changes side-by-side with synchronized vertical scrollbar only (no horizontal scrolling). By cloning a dashboard vertically within the same interface/medium, it significantly eases the process of comparing the changes on different criteria and directly exploring the effects of different filters. |
| Playground: | The page where the dashlet is configured is called a “Playground” or a “PG”. |
| Datacell: | The “Datacell” is the column of the records hitting the query of the dashlet. |
| Filtret: | “Filtrets” are filters in dashboards to enable data filtering on the dashboard level rather than only using the filters available in the filters pane for each dashlet. |
| HTMLet: | “HTMLets” are components that are used to add HTML content. They can be added to dashboards and dashlets alike. |
For a comprehensive, alphabetical directory of all platform concepts, and advanced technical terms, refer to TURBOARD Glossary of Terms.
Users & Roles
User Types
There are three main types of users with different roles and permission levels in TURBOARD:
1. Viewer User:
Viewer users are the end recipients, the data readers and the consumers of the insights and data analytics that have been prepared by Designer users and presented to them in a digested summarized form – i.e. a digital e-mailed report, a dashlet, a dashboard or an entire showcase. Such users can be anyone in a decision-making position such as top managers, department managers, board members, customers, stakeholders, and/or business partners. So generally, they perform the largest portion of TURBOARD users, and are the ones who are attentive to receiving their reports and insights in a timely manner. A Viewer user is also referred to as “PRO-U” in TURBOARD’s terminology, and is basically the end user who observes TURBOARD’s rendered visualizations (reports, dashlets, dashboards and showcases) that a Designer user shares with him/her. As an advanced authorization feature for Viewer users, the data that is viewed can be restricted to certain values, or certain fields can be hidden in the shared visualizations for any selected user. This means that a Viewer user, with such restrictions, will only see the selected values in the shared visualizations, and/or prohibited from viewing the selected data cells. All such permissions and restrictions are determined by a Super Admin user.
2. Designer User:
Designer users’ main goal is to extract value from the data they have by conducting data analysis and data discovery to better understand the business and help decision-makers make better-informed decisions. They are the ones who are slicing and dicing the data and drilling down into dimensions to obtain valuable information and share it in time with Viewer users. So their interaction with the Viewer users are direct and they may receive feedback from them every now and then on how a dashboard can be improved as an example. Designer users can be data analysts, business analysts, project managers, business architects, business information managers, marketing or sales managers, or financial managers and analysts. A designer user is also referred to as “ENT-U” in TURBOARD’s terminology, and is basically the user who can create visualizations – i.e. prepare views, design dashlets, dashboards and showcases, then sharing them with other users, in addition to generating reports from the data sources shared with him/her.
3. Super Admin User:
A Super Admin user is responsible for developing and managing the framework within which TURBOARD operates. He/she is the backbone of the deployment and the one who ensures that the environment is set up correctly for other users. In other words, a Super Admin user manages the admin features, system settings and preferences, determines other users’ permissions and other setups under the “Administration” section, in addition to establishing the data connections. Such a user can be an IT manager, the server/s administrator, or the data warehouse responsible. This user is also referred to as “DSC-U” in TURBOARD’s terminology, and is called “Super Admin” as he/she also has designer/editor permissions as well (by default).
User Permissions and Authorizations
| Permission/Role | Super Admin DSC-U | Designer ENT-U | Viewer PRO-U |
|---|---|---|---|
| Add/Edit/View users, groups and their permissions | Yes | No | No |
| Add/Edit/View all settings and configurations under “Administration” section | Yes | No | No |
| Add/Edit/View/Share data sources | Yes | No | No |
| Add/Edit/View/Share data views, dashlets, dashboards, and showcases | Yes | Yes | No |
| View/Share dashlets, dashboards, and showcases | Yes | Yes | Yes |
| Export dashlets, dashboards, and showcases to external files such as (xlsx., pdf., docx., e-mail, etc.)✱ | Yes | Yes | Yes |
✱An optional permission that can be granted to/revoked from all types of users.
User Journey & Workflow Architecture
| Super Admin Users🔻🔻 | ✅ Apply configurations, settings and determine preferences to control how TURBOARD platform shall generally work and look like, such as the general layouts (logos, themes), users’ permissions, system configuration settings, etc. ✅ Prepare data connections (data sources) and share them with Designer users. ✅ Can have a Designer user role as well. |
|---|---|
| Designer Users🔻🔻 | ✅ Prepare data views from the shared data sources. ✅ Prepare dashlets from views, and share them with other Designer/Viewer/Public users. ✅ Prepare and design dashboards from prepared/shared dashlets, and share them with other Designer/Viewer/Public users. ✅ Prepare and design showcases from prepared/shared dashboards, and share them with other Designer/Viewer/Public users. ✅ Can view all shared visualizations as a Viewer user as well. |
| Viewer Users | ✅ View shared dashlets, dashboards and showcases.✱ |
✱Viewed data can be restricted to certain fields/filters, or certain data cells can be excluded from view according to given authorizations.
Start Page
General Features of the Start Page
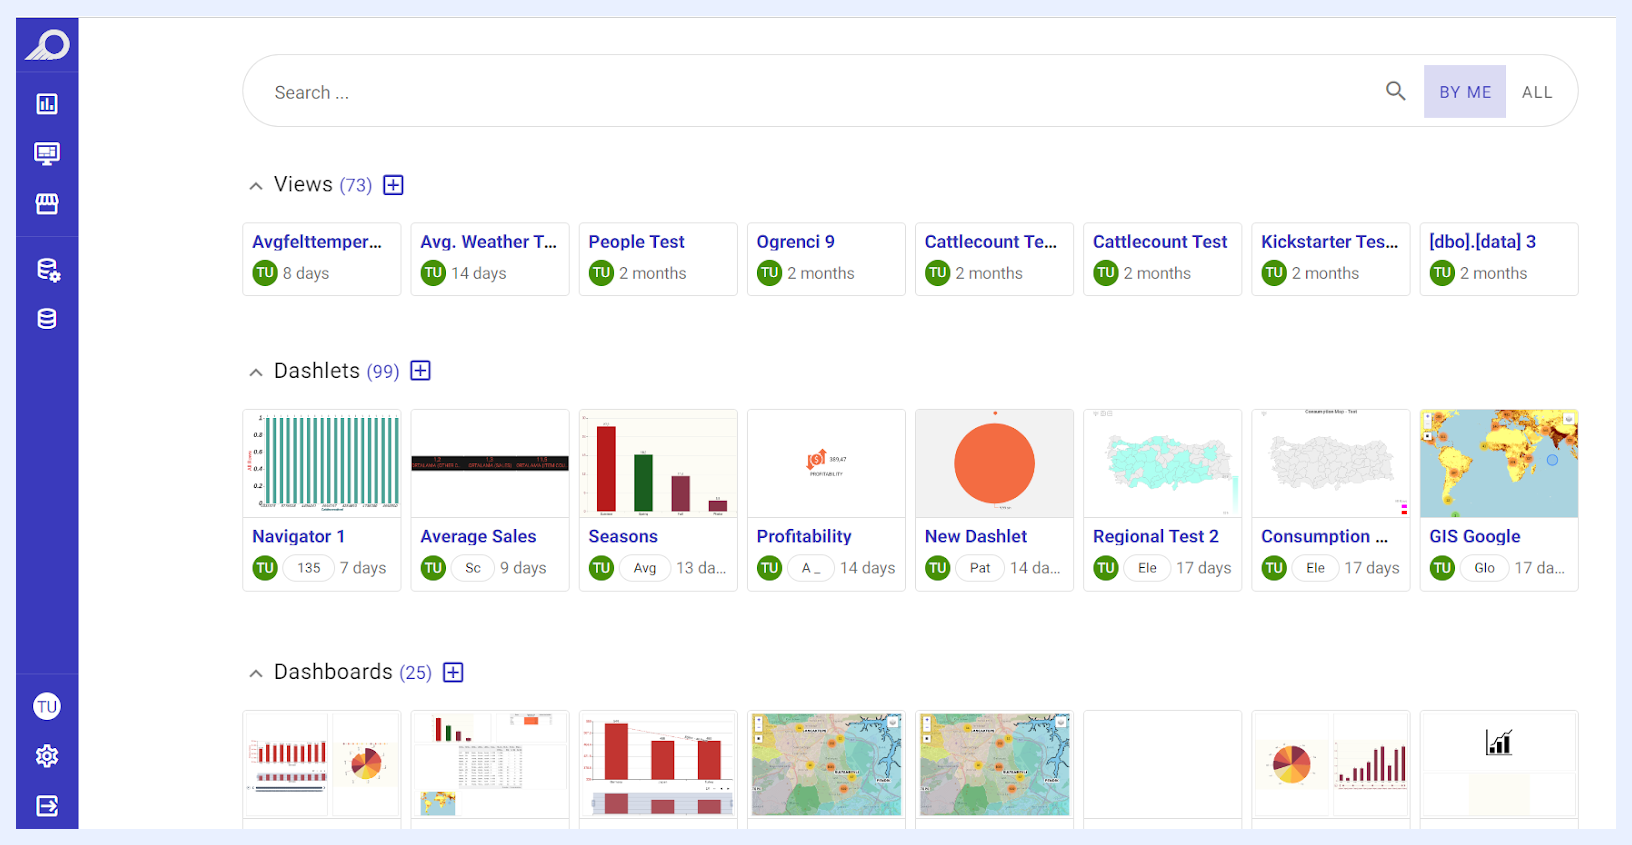
When a user successfully logs into TURBOARD, he/she will be directed to TURBOARD’s main interface, namely “Start Page”. It generally consists of:
A “Search” bar that enables the user to browse and locate any view, dashlet, dashboard, or showcase that they have access to – whether it was shared or created by them.
The shared views and visualizations, which include dashlets, dashboards, and showcases, are displayed as clickable elements listed under each respective element type in accordion menus.
Navigation Sidebar Menu
The Navigation Sidebar Menu is a menu feature that appears with a fade-in and fade-out animation and is available on all TURBOARD main screens. It provides quick access to TURBOARD's main functions and screens, which include:
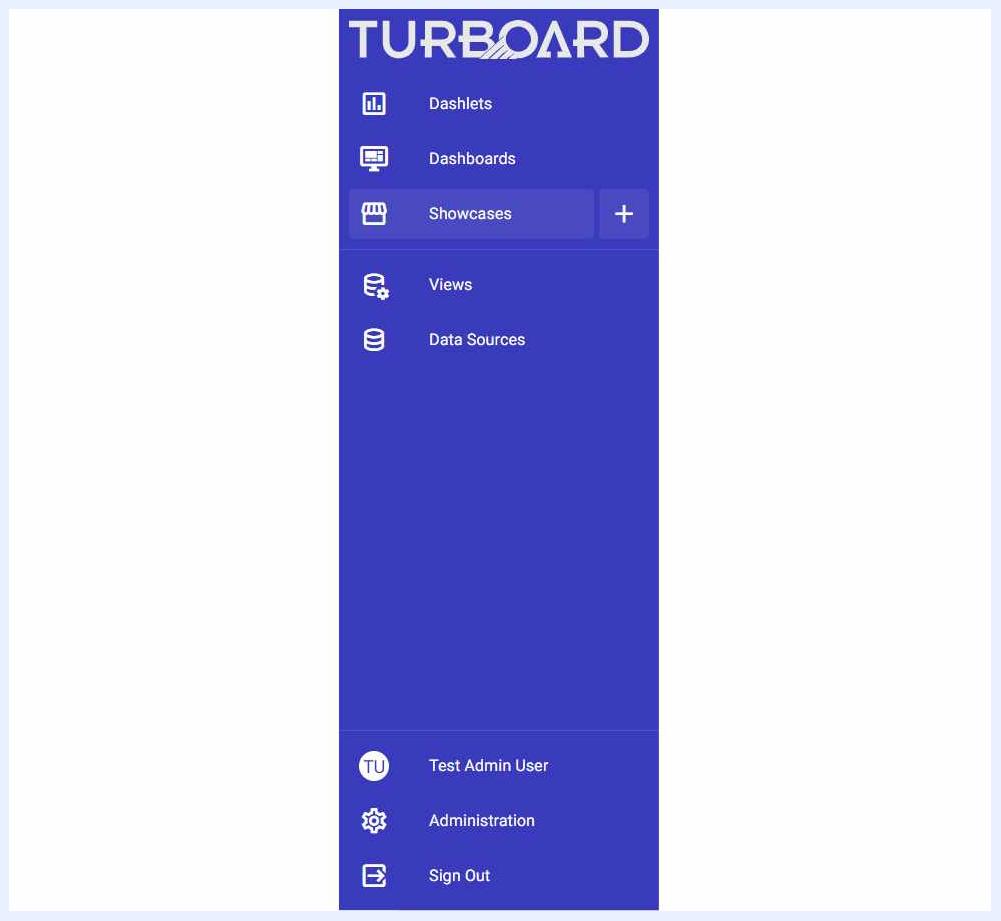
Data Sources: users can navigate to the connected Data Sources screen or connect to a new Data Source via the + icon. Creating a new data source is only available to Admin users, while navigating to the relevant screen listing all connected data sources is available to all users.
Views: Users can navigate to the Views listing screen or create a new View (set of data) via the + icon. Creating a new view is only available to Admin and Designer users, while navigating to the relevant screen listing all shared views is available to all users.
Dashlets: users can navigate to the Dashlets listing screen or create a new Dashlet via the + icon. Creating a new dashlet is available to Admin and Designer users, while navigating to the relevant screen listing all shared dashlets is available to all users.
Dashboards: users can navigate to the Dashboards listing screen or create a new Dashboard via the + icon. Creating a new dashboard is only available to Admin and Designer users, while navigating to the relevant screen listing all shared dashboards is available to all users.
Showcases: users can navigate to the Showcases listing screen or create a new Showcase via the + icon. Creating a new showcase is only available to Admin and Designer users, while navigating to the relevant screen listing all shared showcases is available to all users.
Administration: users can navigate to the Administration panel to manage and edit the system's configurations and settings. This option is available only to Admin users.
JAS — AI Assistant
JAS is TURBOARD's built-in AI assistant. Rather than a separate add-on, it is integrated throughout the platform and appears as a pane that can be opened from the interface toolbar. From this pane, users can create dashlets by describing what they want in plain language, get natural-language summaries of dashboards and data tailored to different audience types (AI Personas), generate SQL for views from a plain description, and ask how to use a feature to receive guidance within the context of the current screen.
Note
Older material may refer to JAS as “TURBot”. The current name is JAS throughout the platform.
User Profile
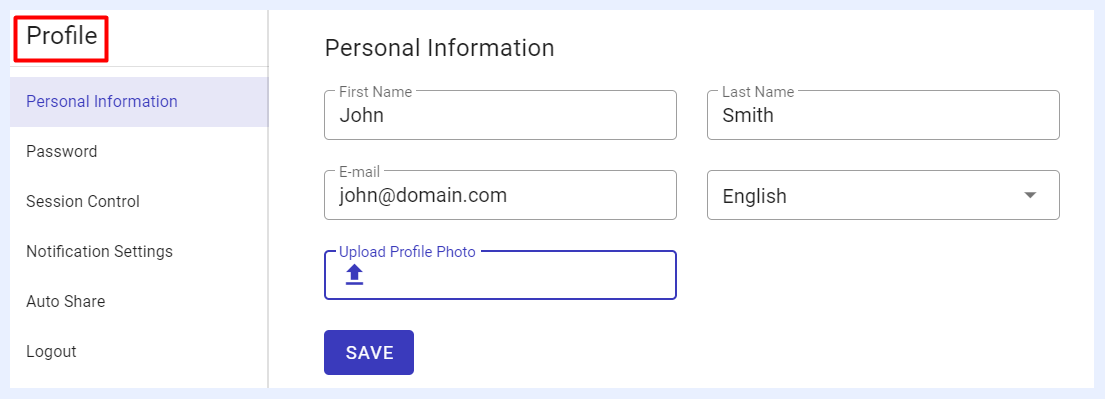
The User Profile section allows users to manage their account settings. Upon clicking on the user’s profile icon/name from the Navigation Sidebar Menu, a side window appears with several sub-menu options:
Personal Information: The user can update first name, last name, email, interface language, and upload a profile photo.
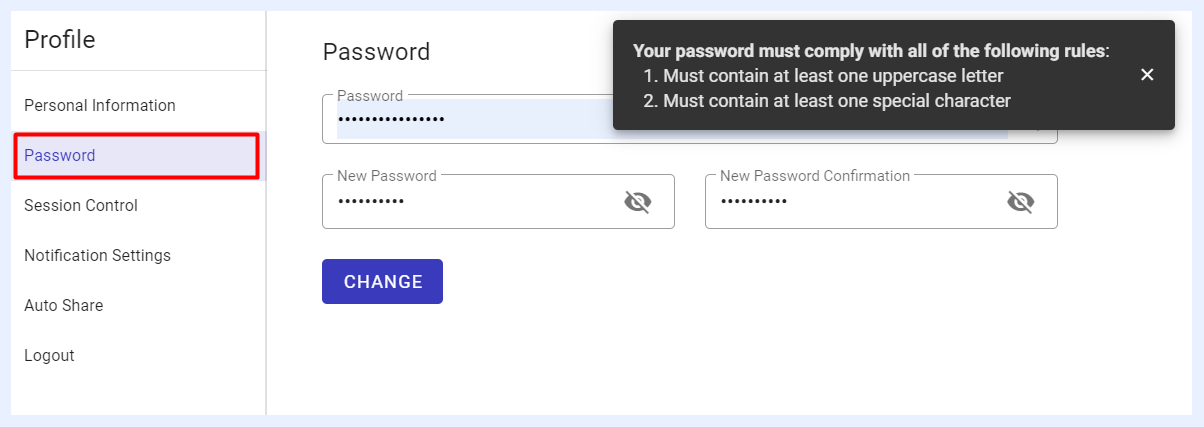
Password: The user can change their password by entering the current password, then specifying and confirming a new password that complies with security guidelines (at least one uppercase letter, and one special character).
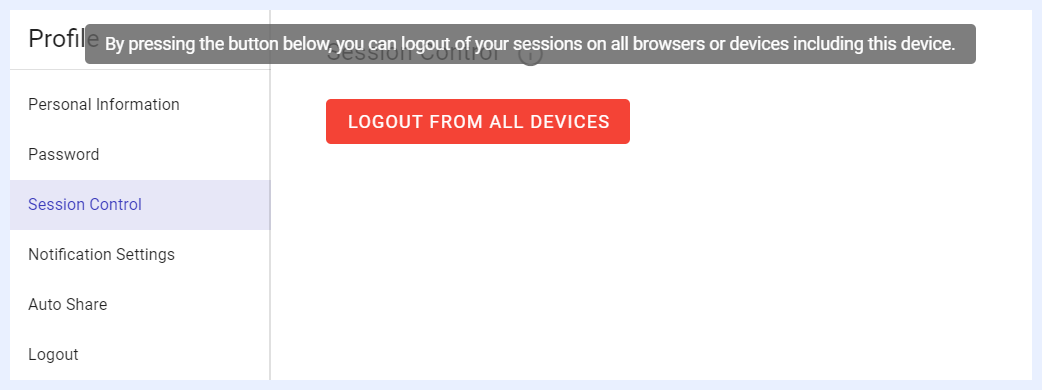
Session Control: The user can log out from all active sessions across devices.
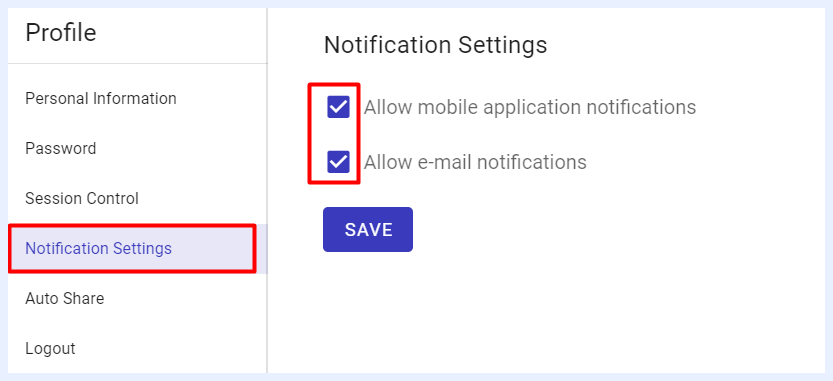
Notification Settings: By default, notifications are enabled when the user account is first created. The user can stop mobile app or email notifications by adjusting the checkboxes.
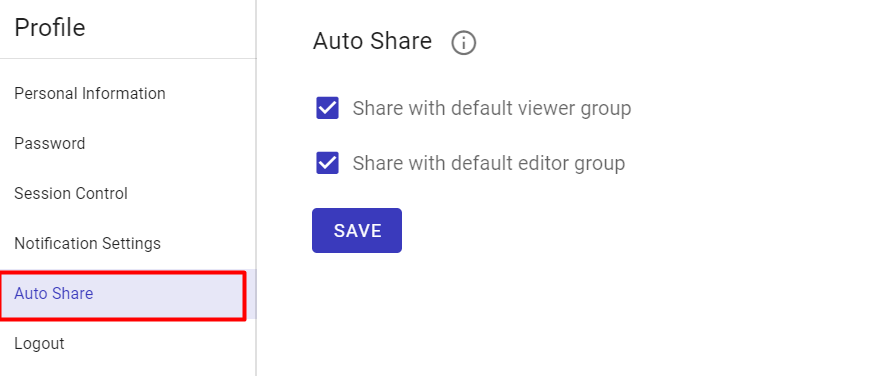
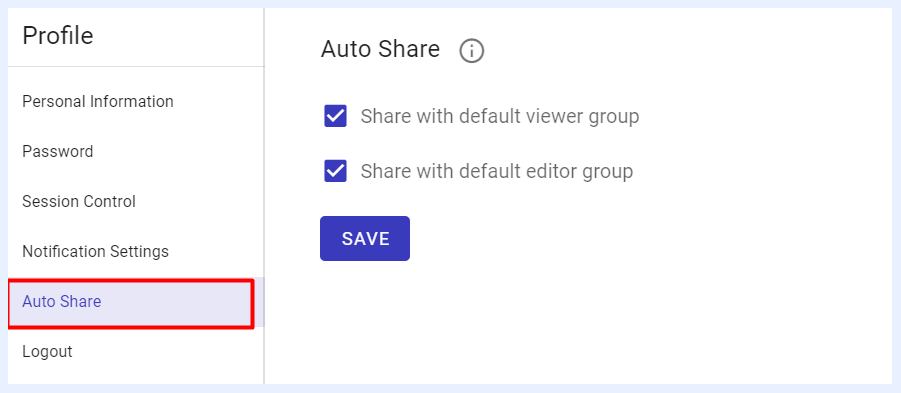
Auto Share: Preferences for sharing with default viewer and editor groups are auto-selected based on the settings configured by the Admin when the new user account was created. The user can modify these preferences as needed.
Logout: The user can log out through the profile section or the Navigation Sidebar Menu. It is recommended for users to sign out of TURBOARD when done working on the platform for the day, especially if the Session Timeout is not activated in Administration > Session Settings, for better security.
Contact Us, Support Center
- For further assistance, contact us at: support@turboard.com
- For product related inquiries, contact us at: contact@turboard.com
- For urgent support requests, call us at: +90 312 210 15 12