Data Sources
Connecting to Data Sources
According to TURBOARD terminology, any data source – either a database or a file – is called a data source. Data Sources contain digitized and formatted information. TURBOARD sends queries to databases according to the settings made in the view and uses the returned results to make the analysis.
TURBOARD mirrors the data source and creates queries using the dashlet. The data is never copied from the database, but the query is sent to the real data even if the schema is imported.
Supported Engines
Drivers for widely-used database engines are available at TURBOARD. They include: MySQL, Oracle, PostgreSQL, SQLite, Impala (Cloudera), MSSQL, Vertica, ClickHouse, and Snowflake, amongst others.
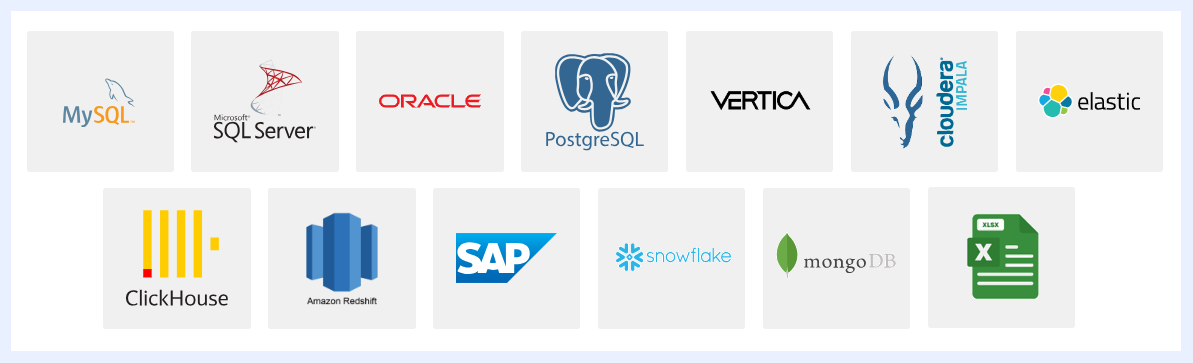
TURBOARD connects to these engines via ORM driver
How does TURBOARD connect to Data Sources?
TURBOARD can be directly connected to the database that is used for operational purposes. However, alternative options can be evaluated taking into consideration (1) the privacy and security of the data, (2) the possible additional burden that business intelligence screens may cause to the database, if used extensively for operational purposes.
Whether connecting directly to the data source, or via a data warehouse, or from excel files, there are considerations (pros & cons) to evaluate before deciding the connection as demonstrated below:
| Connection Type | Pros | Cons |
|---|---|---|
| Direct | ➤ Provides connection to live data with instant reflection of changes. ➤ Rapid progress as there is no data warehouse layer or excel automation process in between. |
➤ Cannot be recommended in case privacy criterion is of high priority. ➤ It may cause overload of sending high frequency select queries to the source database due to being a transactional medium. |
| Data Warehouse | ➤ A battle-proven method used when privacy is an issue. ➤ Has a direct driver of TURBOARD for widely used data warehouses: big data (Hadoop Impala), Vertica, Elasticsearch, and columnstores, etc. ➤ Ability to produce screens with much higher performance results as ETL processes will be built in parallel with the increase in analysis needs. ➤ Ability to schedule in a way that does not create a load on the source database. ➤ Does not include the data that is not needed for analysis, as it uses only tables and columns that will be the subject of analysis. |
➤ It provides close to live reflection depending on the data volume and the performance of the queries, yet it is still not 100% live. |
| Excel | ➤ No privacy/security barriers. ➤ Ability to update data with minimal effort when the data is transferred to the same excel format. |
➤ Inability to analyze with live data. ➤ There will be a continuous need to transfer the data from its database to excel files, and then to TURBOARD. ➤ Some problems may occur during the transfer process. |
Note
A data warehouse can be created with the fast ETL (Extract, Transform and Load process) tool within TURBOARD platform. It is necessary to provide a connection to the source database for this ETL process, which also allows setting up the process at regular intervals. For information on alternative ETL tools, contact support@turboard.com.
How to Add a Data Source?
1 Make sure that you are connected via the internet and logged into TURBOARD as a Super Admin user with admin permissions.
2 From “Data Sources” section under the Navigation Sidebar Menu, click + Create a New Datasource icon to open the “Create a New Datasource” overlay window.

Data Sources – Add New
3 Select (click on) the database that you will connect to, then fill the required information in the related fields:
-
Alias: give a name to the new data source.
-
Provide the connection properties and authentication information: database name, server host, port, username, password, etc.
-
“Activate caching for this database connection” check box: checked by default so that the data of the dashlets that will be created from this data source will be cached. This will prevent unnecessary queries to be sent to the database and will enhance the overall performance. Unless the data in the database is updated within short periods of time and instantly changes and you want to continuously query the database, keep this check box checkd.
-
“Use SSH Tunnel” checkbox: for added security, you may want to use an SSH tunnel to connect to your database. This is especially useful when connecting to a remote server or when your database is behind a firewall. To enable this, simply check the 'Use SSH Tunnel' option. You'll then need to enter additional details such as the IP address or host name, port, username, and SSH password.
4 Click CREATE button.
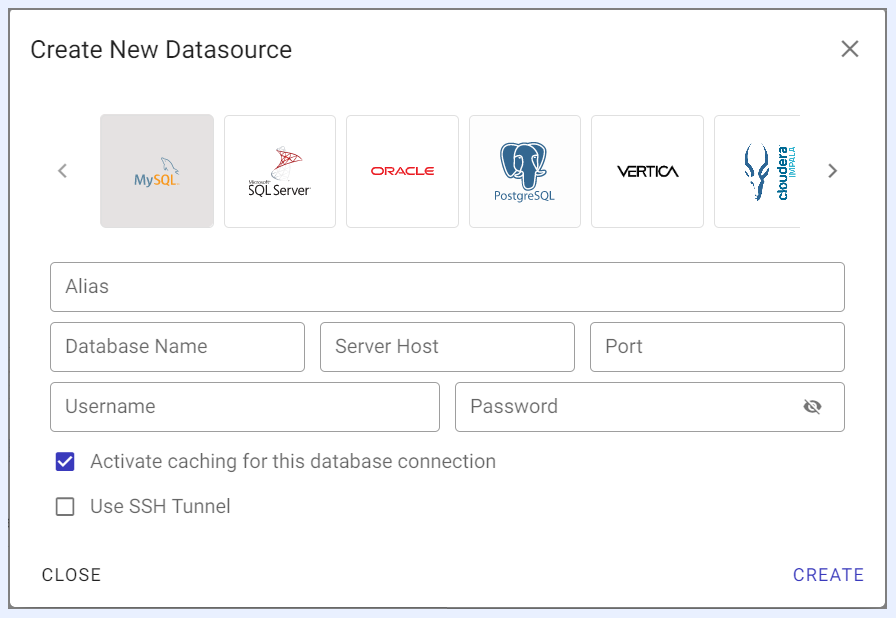
“Add New” Data Source Window
Note
Upon clicking CREATE button, the connecting process will start automatically and its completion time may vary depending on the schema size of the database.
5 Once the connecting process is completed, the relationships between the tables in the data source are automatically detected and made available under “CONNECT TABLES” tab.
6 Go to “CONNECT TABLES” tab and select the data tables that you want to connect to from their list, then click Add Selected Table/s icon.
7 The added data tables will be automatically listed under “CONNECTED TABLES” tab and ready to be used for creating “Views”.
Note
Only Super Admin users can add new data sources to TURBOARD, while both Admin and Designer/Editor users can edit, delete and manage the data tables of an added/existing data source.
Managing Data Sources
When a new data source is added and its data tables are connected to TURBOARD, it will be listed under “All Datasources” left-side menu. You may at any time click on it to open the “Edit” mode in order to manage its settings, add more data tables or delete some, and/or customize the relationships between the connected data tables, etc.
“DB CONNECTION” Tab
From this tab, you can:
-
Update the DB login and access credentials (if changed),
-
Edit the name of the data source connection (Alias),
-
Change caching settings,
-
Delete the data source connection from TURBOARD.
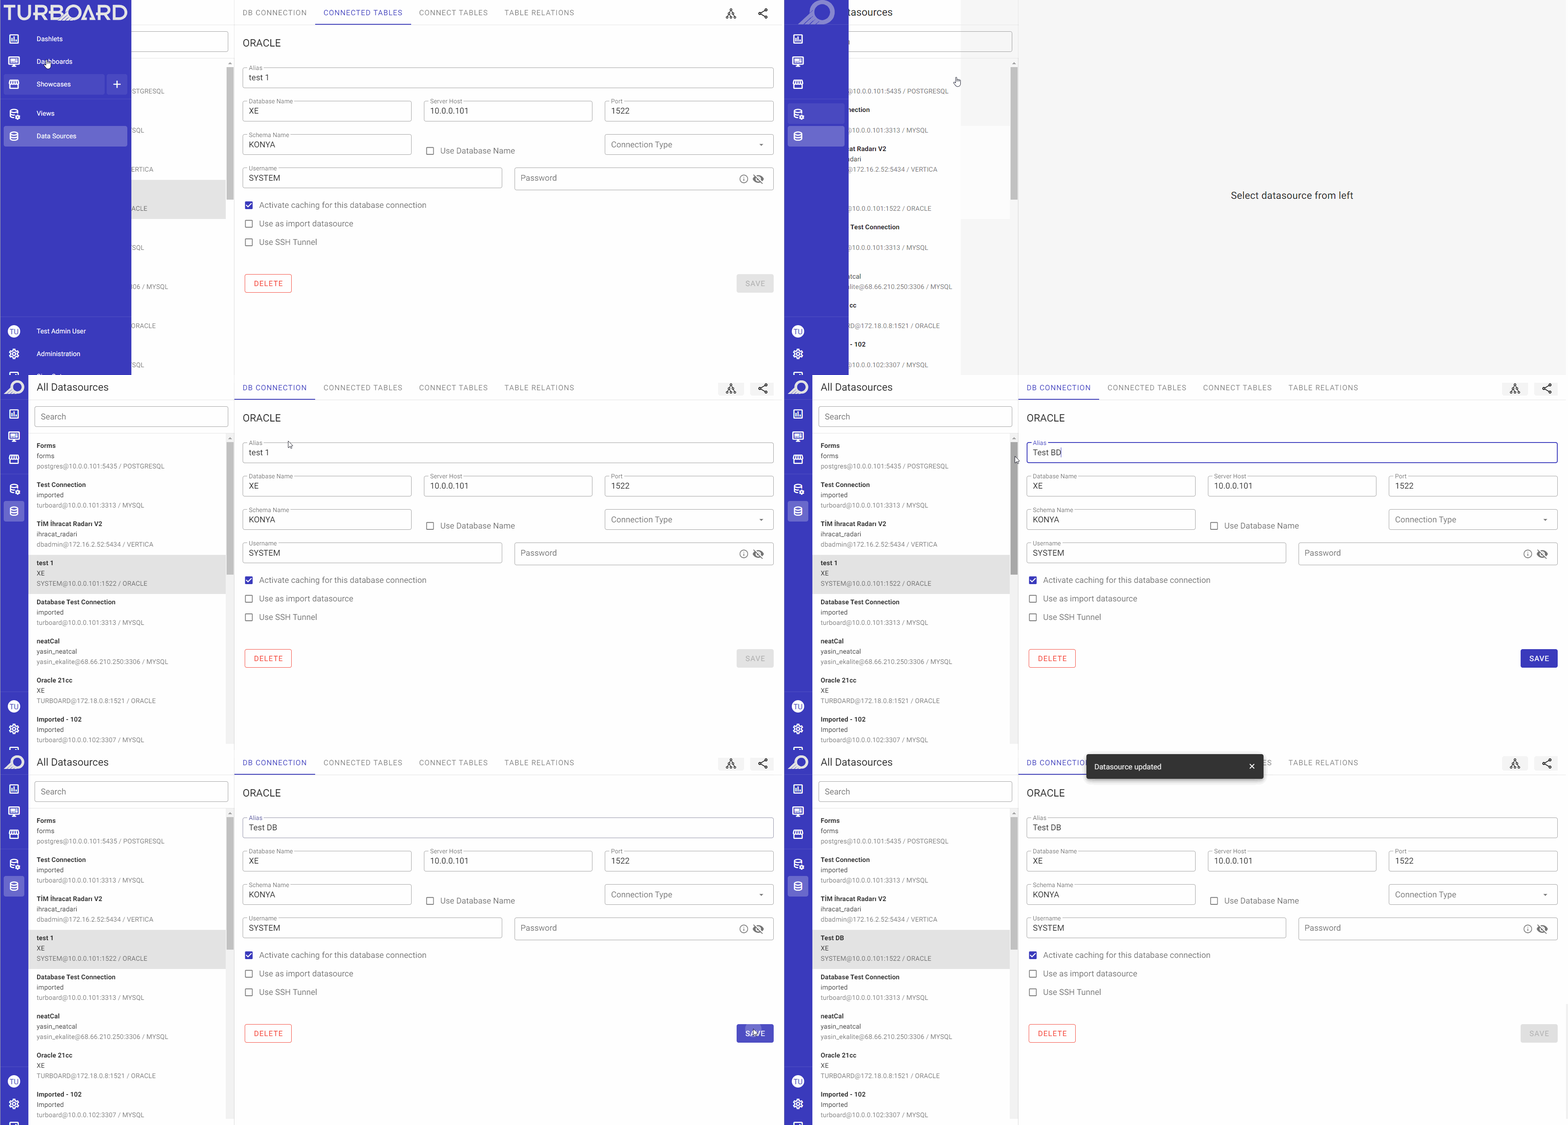
“CONNECTED TABLES” Tab
The added tables to the selected data source will be listed in this tab as below:
-
Name: the name of the data table (as imported from the data source), hyperlinked and clickable to allow the user to manage its fields.
-
Fields: displays the count of existing fields for the table as automatically detected when the data source connection was configured.
Auto remove not existed fields icon: this icon is activated when selecting its table from the tables’ list. When clicked, any fields (or columns) in the table that no longer have corresponding values or data in the data source are automatically deleted to help keep the data table clean and organized, by removing any unnecessary fields that are no longer needed.
Delete Data Cache icon: this icon is activated when selecting its table from the tables’ list. When clicked, the cache of the data in the relevant table will be cleared and the table will be re-populated with data from the original source.
Delete Table icon: this icon is activated when selecting its table from the tables’ list and it allows the user to delete the selected table if it is no longer needed for analysis.
Managing Fields in “CONNECTED TABLES” Tab
When adding a new data source, its tables and their fields are automatically added and listed in TURBOARD’s interface. However, if within time the structure changes, users can manage such changes.
By clicking on the required table in “CONNECTED TABLES” tab, its fields are automatically listed from which the user can click on the required field to edit its properties. The user can:
-
Add/remove fields from the selected table,
-
Remove data cache of the selected field,
-
Assign Primary Key (PK), and/or
-
Assign Cache Trigger. Click here to learn more about trigger and cache mechanisms.
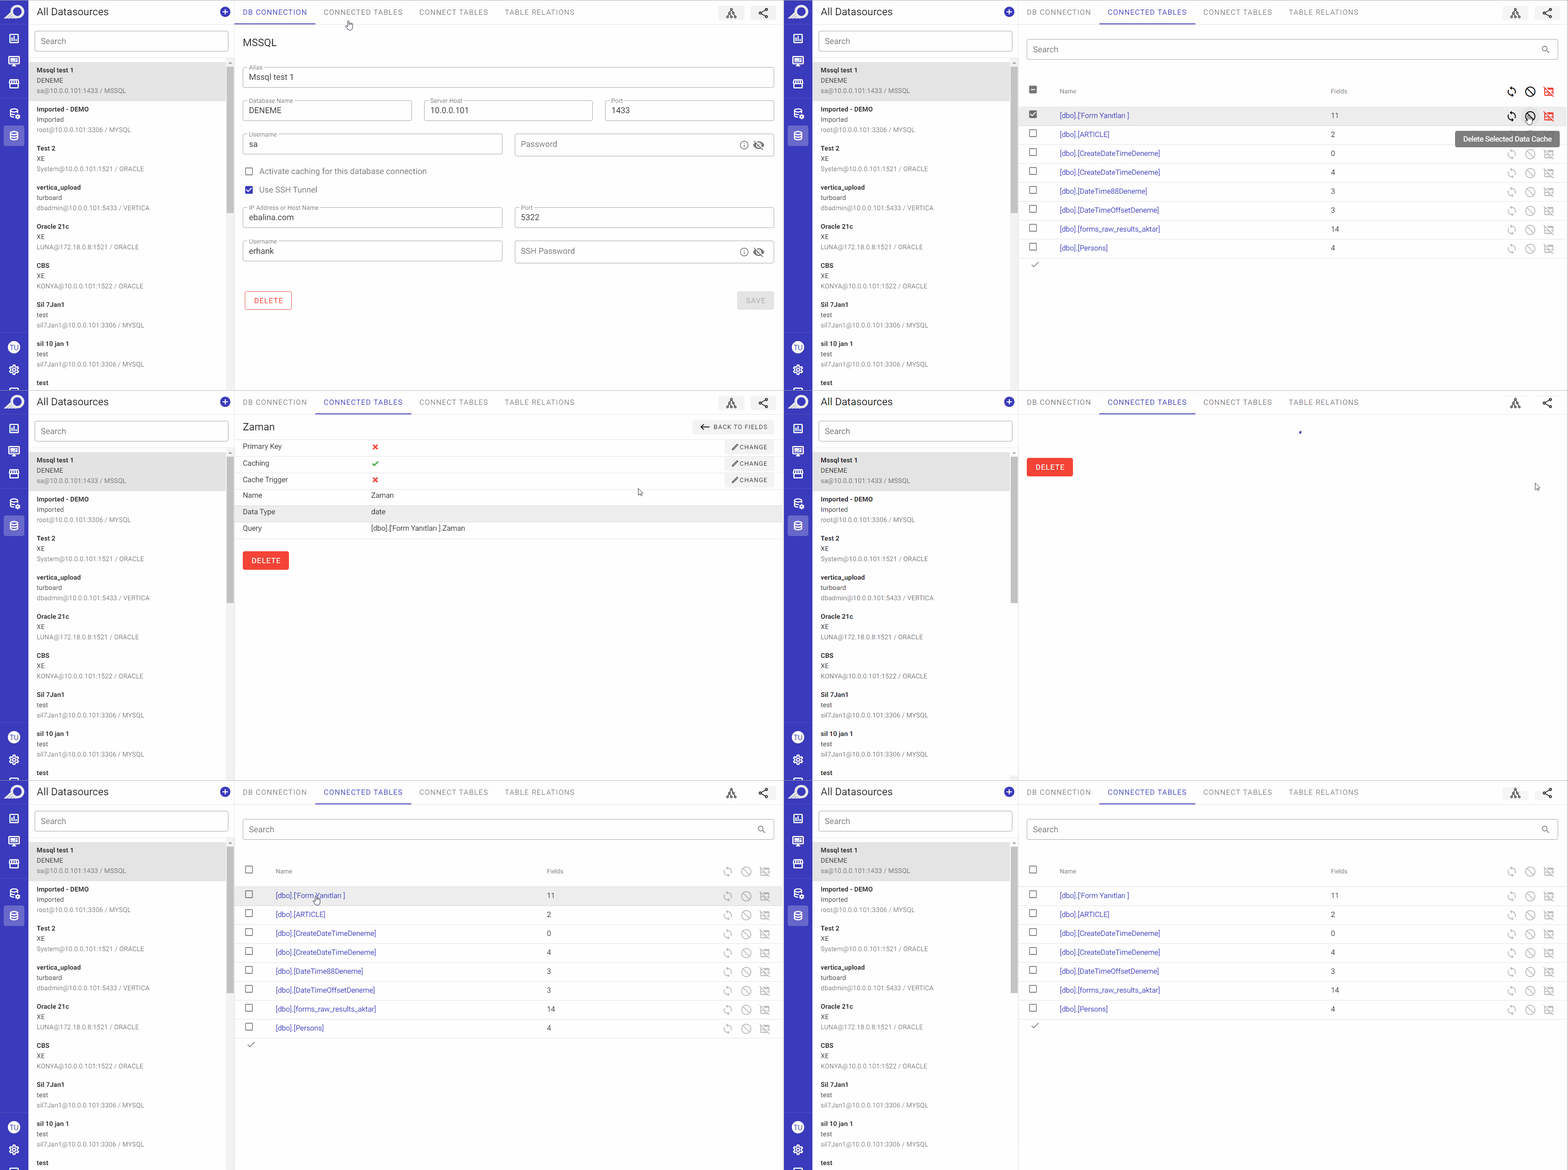
“CONNECT TABLES” Tab
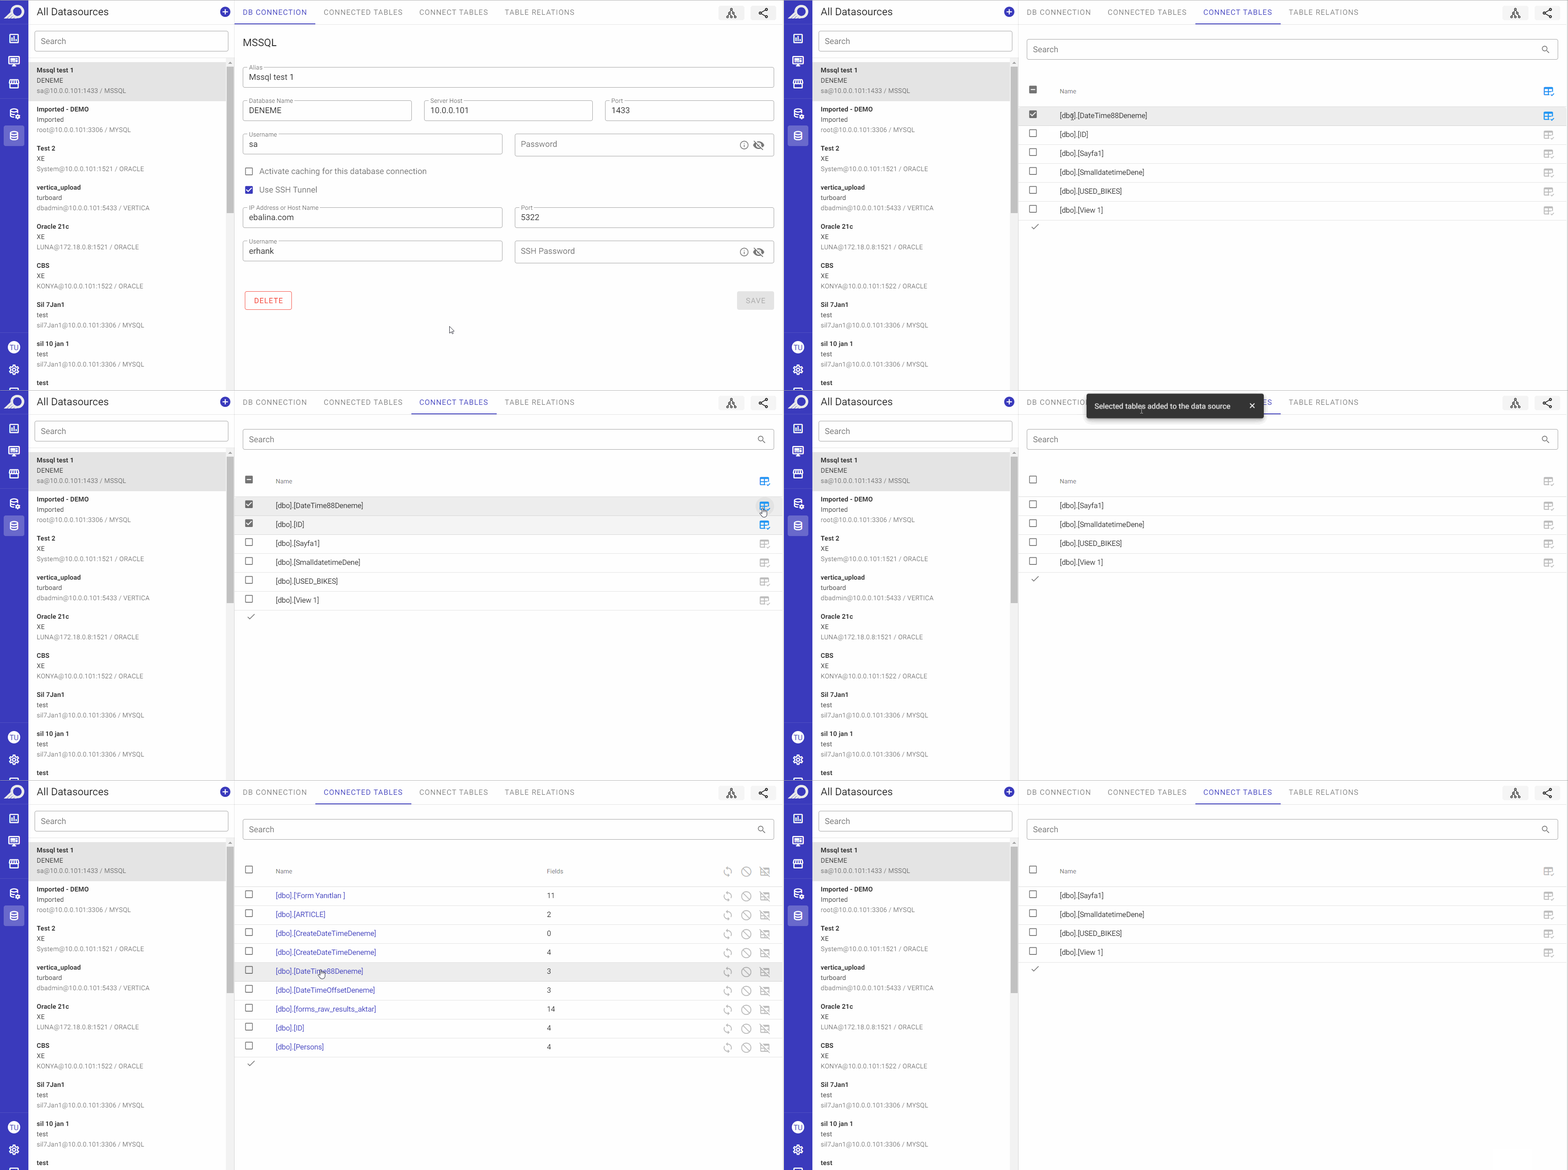
When adding a new data source, the data schema and the tables structure are automatically detected and listed under this tab from which the user selects the required tables and adds them to the new data source connection.
If the user has chosen some (not all) tables to be added to the new data source connection and/or if the structure in the original data source changed with time, the remaining/new tables will be listed in this tab, and can be added to the data source any time later on by selecting the required table and clicking Add Selected Table icon.
“TABLE RELATIONS” Tab
TURBOARD automatically finds the relationships between the tables in the data source and makes them available, but sometimes the user can create his/her own relationship(s) and create foreign keys between the data tables. In this case, the data source shall be refreshed after the relationship is created. Refresh process is described in “Views” section.
Creating User-Defined Relationships
User-defined relationships can be used in TURBOARD. A new relationship can be created by following the steps below:
1 When you click on the connected table/s listed in this tab, they will be displayed with their fields at the left-side of the window.
2 Select the required tables and apply your connections by choosing the required fields and drag-drop the connection using the mouse.
3 When done, click the Save icon at the right-top of the page.
4 You can use the Undo Changes icon to remove the connections before saving, or if you need to remove a connection/relation that was added previously, click on the connection line and click the Delete key on your keyboard.
5 You can use the Database Foreign Key Relations icon to automatically refresh the foreign key relations from the related database/data source – if any.
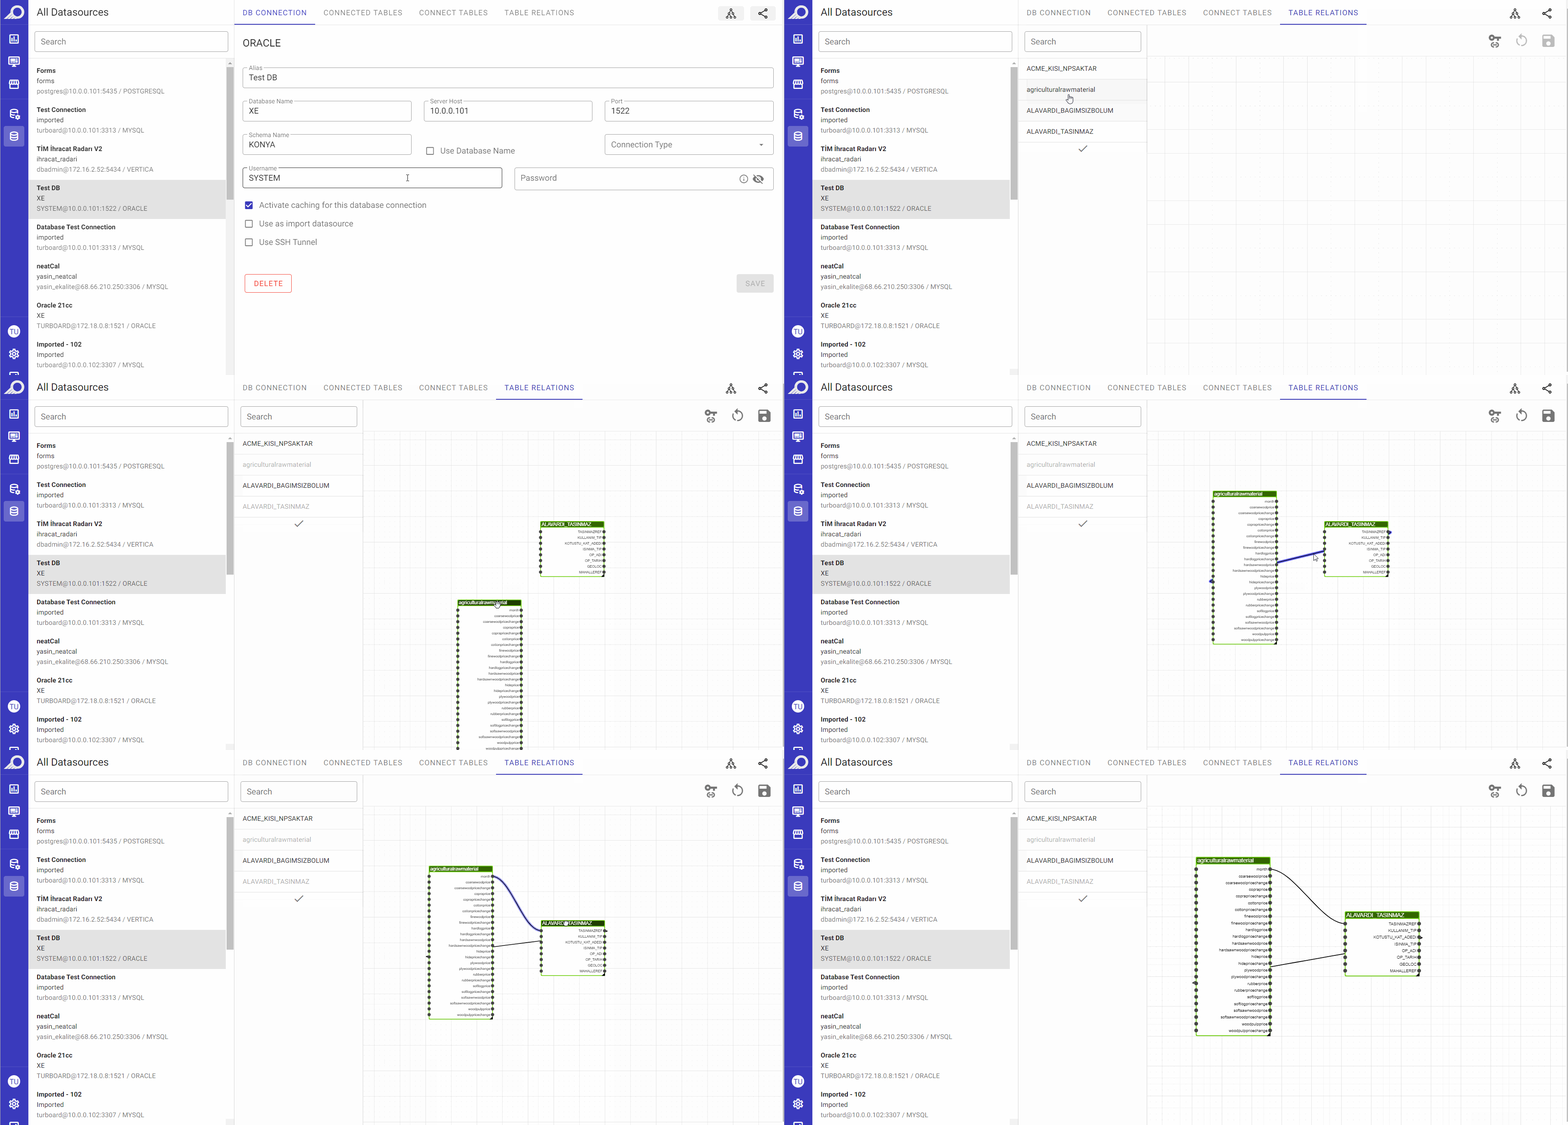
TURBOARD Foreign Key Management (Entity – Relationship)
Data Sources Meta Info
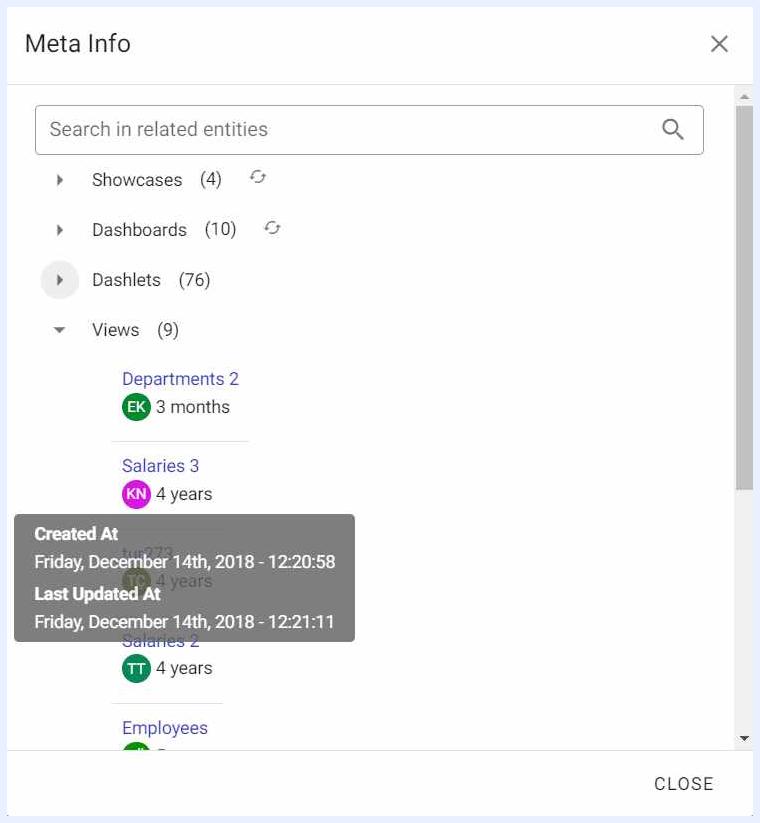
When clicking the Meta Info icon, an overlay window will open where all the views, dashlets, dashboards and showcases whose data are fetched/used and analyzed from this data source are listed as below:
In tree view order, i.e. hierarchical collapsible tree.
In a meta info format displaying the name of the entity, the name of the user who created the entity, creation and last update dates.
The dependent entities (views, dashlets, dashboards and showcases) are hyperlinked and can be opened/accessed by clicking the link.
Sharing Data Sources
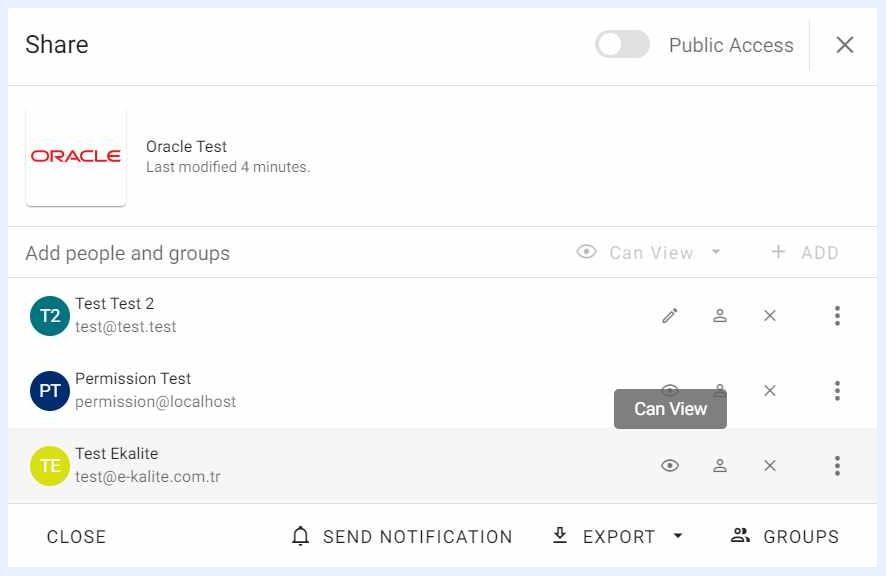
Using the “Share” icon, the added tables can be shared with other users or groups. When a data source is shared with “Can View” privilege, shared users may create any object ranging from views to showcases from the tables and fields in this data source. When it is shared with “Can Edit”, in addition to what is allowed with “Can View” privilege, the user may also apply changes like adding or removing fields, changing data types of fields, assigning PK's, assigning triggers, removing the table and/or removing the table cache.
RAM & Disk IO Optimization by Trigger
RAM and Disk IO Optimization refers to the process of improving the performance of a computer system by optimizing the usage of Random Access Memory (RAM) and disk Input/Output (IO) operations. This can be achieved through various techniques such as caching and reducing disk IO operations by using triggers – both are techniques used in TURBOARD to improve overall performance.
Triggers are a set of instructions that automatically execute in response to specific events, such as changes to the data in a database. By using triggers, the frequency of disk IO operations can be reduced.
Admin users can set triggers when managing the fields in data tables. The data source connection can also have cache enabled when established.
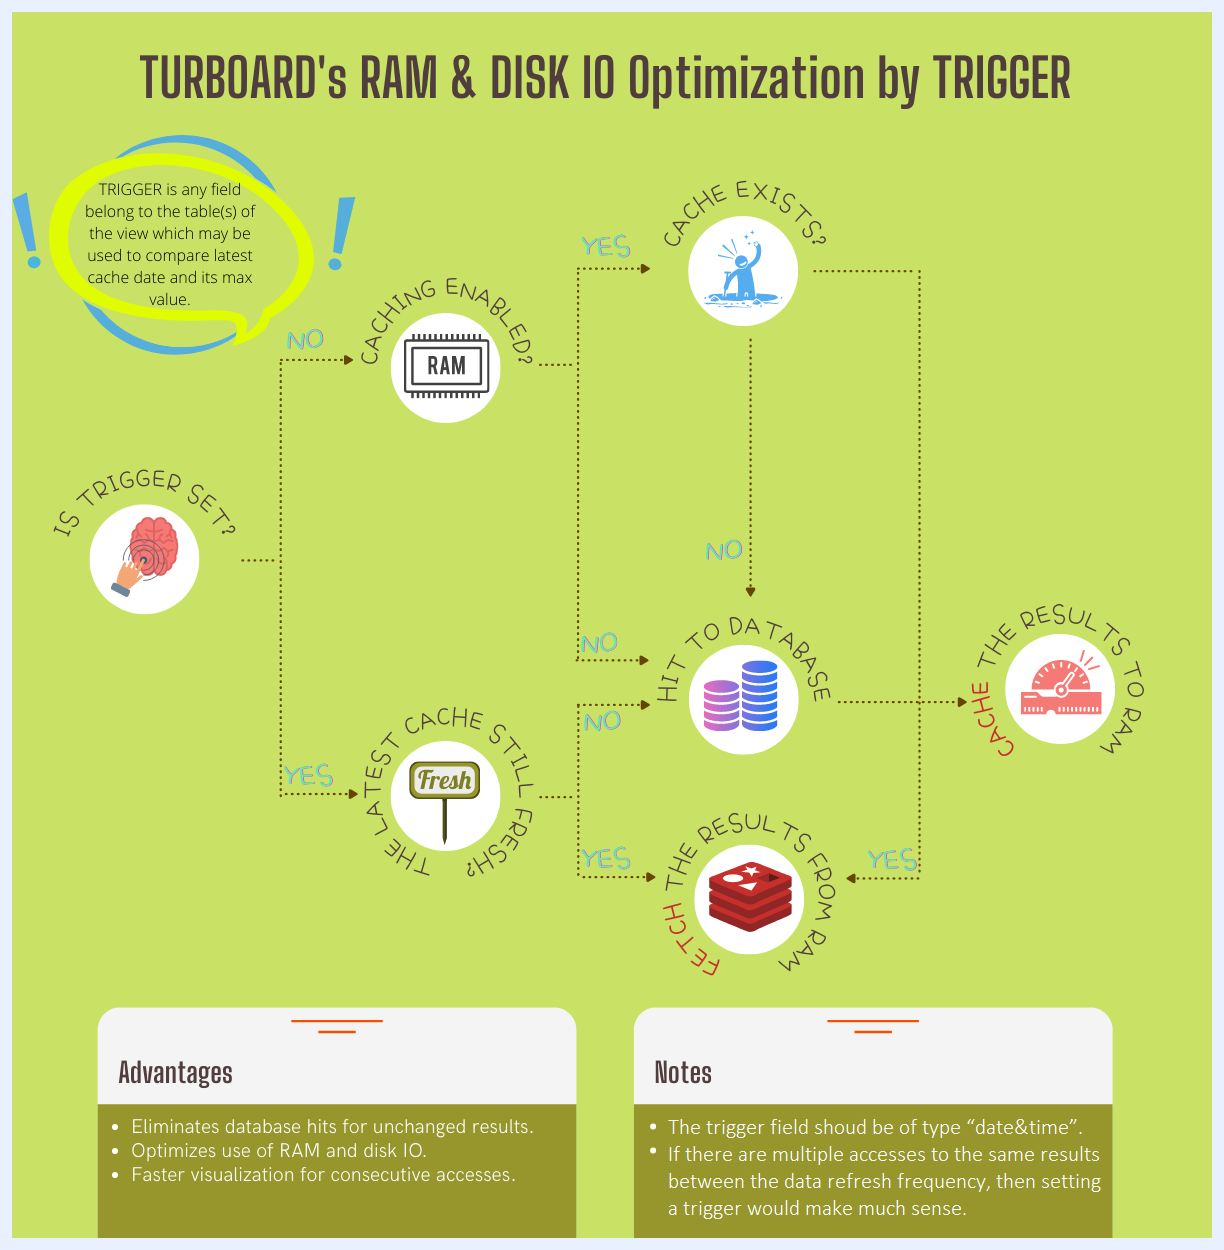
TURBOARD's RAM & Disk IO Optimization Strategy
The above flowchart demonstrates the optimization strategy for enhancing performance and resource utilization by using a combination of caching and triggers within TURBOARD's platform. This strategy is designed to efficiently manage and utilize system resources, thereby improving the overall performance of the platform.
Trigger Mechanism
The trigger is a critical component in this optimization process. It is defined as any field belonging to the table(s) of the view, which can be used to compare the latest cache date and its maximum value. This comparison helps in determining whether the cached data is still valid or if it needs to be refreshed. By setting a trigger, the system can intelligently decide whether to use the existing cache or to fetch new data from the database, thus minimizing unnecessary database hits.
Caching Enabled
When caching is enabled, the system first checks if a cache exists. If a cache is found, it then verifies whether the cached data is still fresh based on the trigger field. If the cache is fresh, the results are fetched directly from the RAM, significantly reducing the time required to retrieve the data. This process ensures that frequently accessed data is readily available, thereby speeding up query responses and enhancing the user experience.
Cache Freshness
The concept of cache freshness is pivotal in ensuring data integrity and performance optimization. The system continually monitors the cache's freshness against the trigger field. If the cache is deemed fresh, it is used for data retrieval; if not, the system performs a database hit to obtain the latest data. This dynamic approach ensures that the data presented to the user is both current and quickly accessible.
Database Hits and Result Caching
In scenarios where caching is not enabled or the cache is not fresh, the system performs a database hit to fetch the required data. Once the data is retrieved, it is cached in RAM for future access. This dual approach ensures that while the latest data is always available, repeated database hits for the same data are minimized, thus optimizing disk IO and reducing latency.
Advantages of RAM & Disk IO Optimization Strategy
Implementing this optimization strategy offers several advantages. It eliminates unnecessary database hits for unchanged results, optimizes the use of RAM and disk IO, and provides faster visualization for consecutive accesses. By intelligently managing data retrieval and caching, TURBOARD ensures that system resources are used efficiently, leading to improved performance and a better user experience.
Note
Trigger Field: The trigger field should be of the “date & time” type to accurately track data changes and cache validity.
Multiple Accesses: If the system experiences multiple accesses to the same results within the data refresh frequency, setting a trigger becomes highly beneficial. It ensures that the cached data is used effectively, reducing the need for repeated database queries.
Tables & Data Source Connections
As TURBOARD has the ability to connect to multiple data sources seamlessly and at ease, it simplifies the process of cross-analysis and helps users get insights faster as it can run multiple queries on multiple data sources and/or datasets for the same dashlets and/or dashboards.
-
Users can connect different data tables from the same data source together in order to create multiple datasets and analyze data in dashlets from multiple tables.
-
Users can connect nodes from different views (datasets) and different data sources to be analyzed in the same dashlet.
-
Users can merge filters in a dashboard to allow comparing and filtering data from different datasets and different data sources through a single filter that can be applied to the different dashlets in that dashboard.
| CONNECTED TABLES | CONNECTED NODES | MERGE FILTERS | |
|---|---|---|---|
| Connection | Star Schema | DATABASE-to-DATABASE | TABLE-to-TABLE or DATABASE-to-DATABASE |
| Requirement | Dashlet from multiple tables at the same database. | Dashlet from multiple databases. | Dashboard from either multiple tables or multiple databases. |
| Limitation | Tables are connected with inner join. | Field values should match. | Field values should match. |
| How to? | 1 Make sure the tables are connected at the datasource.2 Create a “View” using all the tables included in the star schema. |
1 Go to any of the views that have a common field with another datasource.2 Select the node (it should be a dimension).3 Select the connected view and the field at the other datasource on the right handside of the node details page.4 Multiple connections from one node is possible.5 Adding the connection to one of the views is enough. |
1 Create a dashboard.2 Add dashlets from different datasources.3 Go to “Filter” settings and click on “Add merged filters”.4 All the nodes that belong to different views will be listed and grouped by their views.5 Select the nodes that are common and save. |
| Process | Inner join select query from multiple tables at the datasource. | Multiple select queries run on the connected datasources. | Multiple select queries run on the connected datasources. |
| Result | ✅ Data from multiple tables in the same dashlet. | ✅ Data from multiple datasources in the same dashlet. ✅ Eliminates the need for ETL to cross multiple databases. |
✅ Data from multiple tables or datasources in the same dashboard. ✅ Eliminates the need for ETL to cross multiple databases. |