Views
What is a View in TURBOARD Terminology?
In TURBOARD, a “View” is a curated dataset specifically prepared for analysis and visualization. It serves as an intermediary layer between the raw data sources and the final dashlets (charts, maps, graphs, or infocells) that present the analyzed data.
Views are essential for transforming raw data from various sources into a structured format suitable for analysis. This transformation process includes customizing data selection, applying filters, and performing calculations to meet specific analytical needs.
Why Prepare Views?
The preparation of views is crucial for several reasons:
1 Reduce the Burden on Data Sources: By aggregating and processing data within the view, TURBOARD minimizes the need to repeatedly query the original data source, thereby reducing the load and potential performance impact on the source system.
2 Speed Up Analysis: Aggregated and processed data allows for faster analysis, as the view contains pre-processed information that can be quickly accessed and visualized in dashlets.
3 Optimize Data Storage: Instead of storing or analyzing all the original data, TURBOARD focuses on the relevant subset, ensuring efficient use of storage and computing resources.
By carefully aggregating and processing data, TURBOARD ensures that views provide a balanced and efficient foundation for analysis, without overloading the data source or causing delays in query execution.
For a deeper understanding of the performance optimizations and data handling strategies employed in TURBOARD, you may read this blog for more details on how TURBOARD's advanced data management features enhance both the efficiency and the effectiveness of your business intelligence solutions.
Options TURBOARD Offers to Prepare Your Views
When creating a new view in TURBOARD, you are presented with three main options depending on the source from which you wish to fetch and prepare the data.
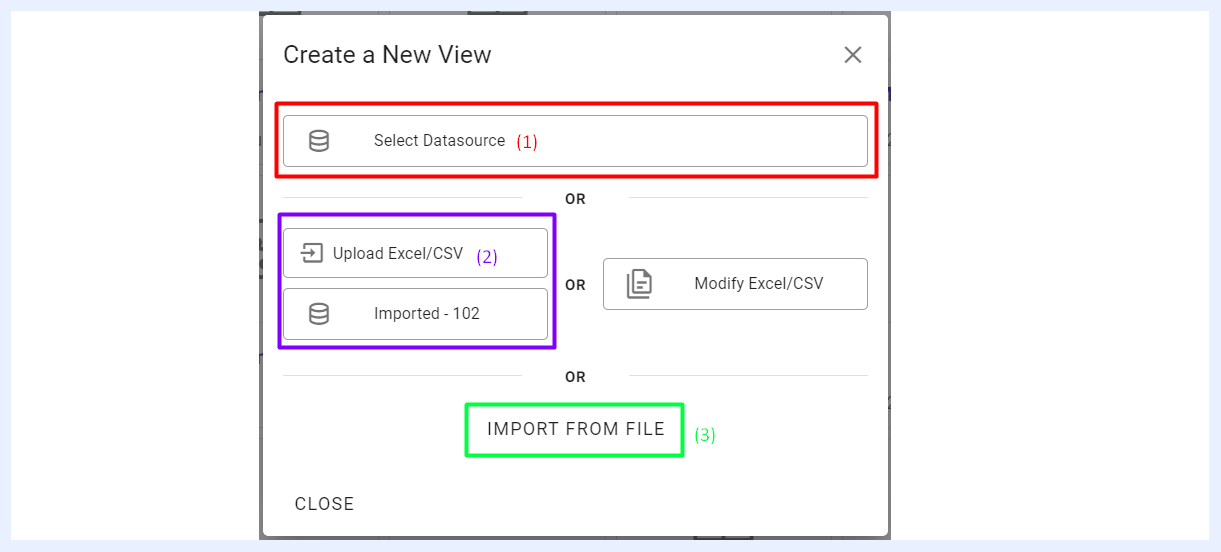
Create New View Overlay Window
Creating a View From a Connected Database
If the dataset you wish to prepare is sourced from a connected database, select the desired source from the “Select Datasource” dropdown menu. This displays all the data sources that have been configured and added to TURBOARD.
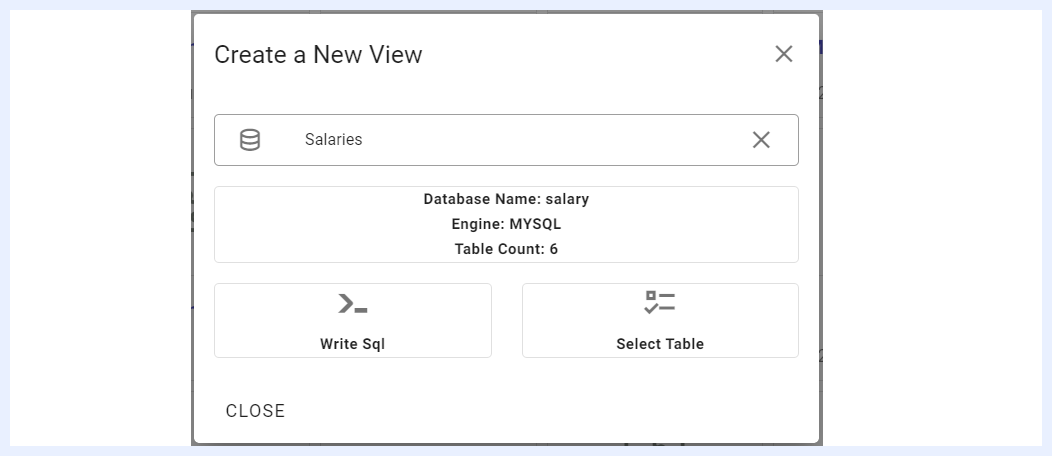
Upon selecting the desired database, two options will become available in the “Create a New View” overlay window:
-
Write SQL: This option allows you to craft an SQL query to fetch the data from the selected datasource. The result of the query is stored in TURBOARD’s database (MariaDB or Vertica is the default database included with the TURBOARD installation). Click here to learn how.
-
Select Table: This option allows you to fetch and prepare your view directly from the connected tables of the selected datasource. Click here to learn how.
Creating a View From an Excel/CSV File
-
Upload Excel/CSV: If you need to generate analysis and visualizations from an Excel/CSV file, you can select the datasource into which it will be imported, then upload the desired file. Click here to learn how.
-
Modify Excel/CSV: Use the “Modify Excel/CSV” dropdown for views that were initially created from an Excel or CSV file to either update the view—which is necessary if the original file has changed—or to adjust its attributes. Click here to learn how.
Duplicating a View From Another TURBOARD View
If you want a view that mirrors another from a different data source, you can use the “IMPORT FROM FILE” button. Click here to learn how.
Differences When Creating a View from Different Options
| View Creation Option | Description & Usage | Query Execution | Data Refresh Policy |
|---|---|---|---|
| From a connected datasource through “Select Table” option | Used for direct data access from connected databases without intermediate storage. Ideal for real-time data analysis and immediate access. | Original Database | If caching is enabled and the data is available and up-to-date in the cache, it is used directly; otherwise, queries are sent to the original database to refresh the data. |
| From a connected datasource through “Write Sql” option | Suitable for custom data handling scenarios where SQL queries are used to fetch and process data before analysis or visualization. | Column-Store DB in TURBOARD Docker | The frequency of data refresh is set at the query interface, which can be adjusted based on operational needs. This setup, part of TURBOARD’s periodical batch connection strategy, schedules batch data retrievals to efficiently manage the data load on the source, optimizing system performance and reducing database strain. |
| From an Excel/CSV file through through “Upload Excel/CSV” option | Ideal for situations where data is static and updated periodically from Excel/CSV files. Useful for data outside the primary management systems. | Column-Store DB in TURBOARD Docker | Data is refreshed whenever the file is reloaded - through the ‘Modify Excel/CSV’ option. This is suitable for data sources that do not require real-time updates, such as periodic reports or historical data analysis. |
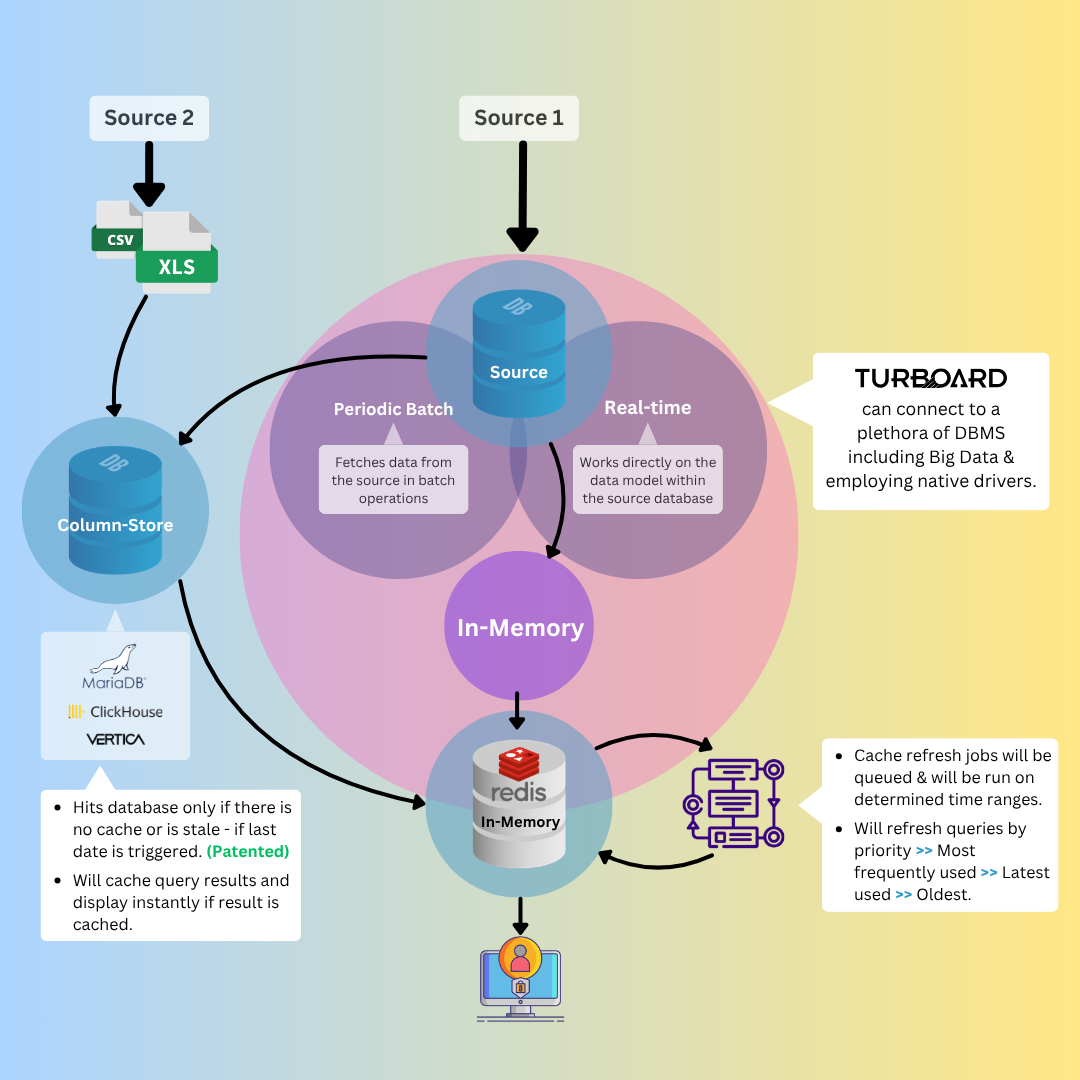
The diagram above depicts TURBOARD’s approach to data connectivity, showcasing how data from two sources ‒ Excel/CSV files and a connected database ‒ is handled. Excel/CSV files are imported directly into TURBOARD’s Column-Store, such as Elasticsearch, Vertica, or Snowflake, where data is cached and displayed instantly if already present, or fetched from the database if the cache is stale. Data from original databases can be connected in real-time, directly interacting with the source, or through periodical batch processes that store data for batch analysis. Both methods utilize Redis In-Memory for caching, optimizing data retrieval through scheduled cache refresh jobs prioritized by usage frequency and recency, ensuring efficient data management and speedy access.
Preparing Views
How to Create a View?
1 From Views section under the Navigation Sidebar Menu, click + Create New View icon.
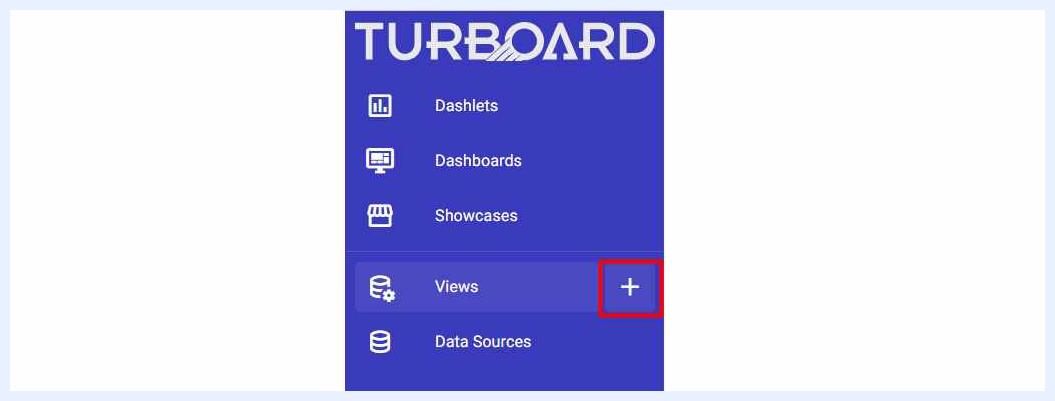
Views – Add New
2 In the overlay window that opens, you are presented with different options in which your view can be fetched and prepared from. Each option is described in detail in the sections below.
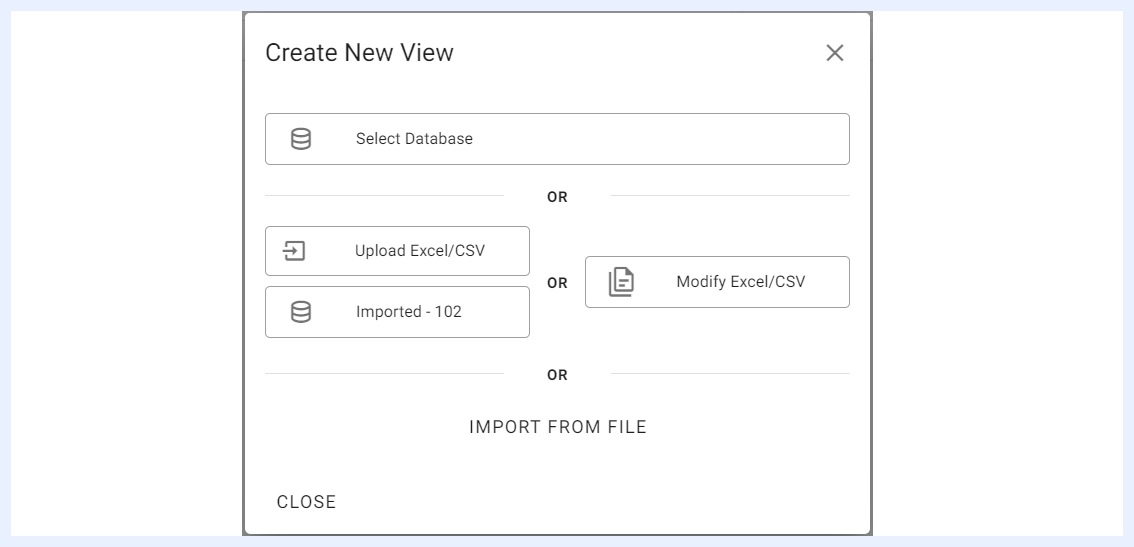
Create New View Overlay Window
Creating a View From Table(s)
1 Go to Views > + Create New View > select the relevant database from Select Database combobox > click Select Table option.
2 A new window will open in which the tables, their schema, fields and the relations between them for the selected data source are automatically detected by TURBAORD as below:
-
Data Source Tables: all the connected tables are listed under this menu. The user shall select/click the table(s) that will create the view(s) from. TURBOARD assigns a gray circle to the tables that are related to other tables in the list.
-
Selected Tables: when a table from “Tables” list is clicked, it will be listed under this section. When a table is clicked, other tables (under “Tables” list) that have relations to it will be automatically marked with circled R.
-
Tables Fields: when a table is clicked from “Selected Tables”, its fields will be displayed under this section.
3 If several tables were selected in which some of them are related, you may determine the main data table for the related tables by selecting it from “Selected Tables” and clicking SET AS BASE button.
4 For each selected table, you may select the fields that you want to be added to the created view, unselect the ones that you want to delete from the created view. The fields that have relations with the base/main table will be auto-selected and cannot be removed from the created view.
5 Click CREATE DATA VIEW button.
Note
When clicking CREATE DATA VIEW to create a new view, each group of tables that are related to each other will be created in one view. This means that several views might be created depending on the selected tables’ relations.
Creating a View From Query (Express ETL)
TURBOARD’s SQL import process relies on optimized integrity checks to provide fast and reliable imports for SQL-based views, with native support for a range of databases including MariaDB, Vertica, Clickhouse, and TimescaleDB.
To create a view from an SQL query in TURBOARD, follow these steps:
1 Navigate to View Creation:
-
Go to
Views>+ Create New View. -
Select the relevant database from the
Select Databasecombobox. -
Click the
Write Sqloption.
2 Write and Validate the Query:
-
On the left side of the querying page, write your SQL script.
-
Click the
► DRY RUNbutton to check the validity of the query. -
Once the query is successfully validated, give a name to your new data view at the top left corner of the window by replacing “Untitled View” with your chosen name.
-
Set or adjust the Automatic update frequency at the bottom of the window.
-
Click the
CREATE DATA VIEWbutton.
3 Result and Nodes Creation:
-
The result of the query is stored in TURBOARD’s database (MariaDB is the default database that comes along with TURBOARD installation).
-
The new view is automatically listed under the “Views” listing page.
-
Initially, the results fetched from the query are represented as Nodes under the Nodes tab in the View.
Incremental Loading for SQL Views
SQL-based views can be configured to load incrementally. When enabled, TURBOARD fetches only new or changed rows since the last refresh, using a selected date column to determine what has changed. This shortens refresh times considerably for large tables and reduces the strain on the source database. The option is available from the view settings when working with custom SQL views.
Indexes and Process History for SQL Views
For SQL-based views, all indexes defined on the view are visible in the view configuration and are protected during data refreshes. A process history is also kept for each view, providing a full audit log of the refresh status, run times, durations, and row counts for every past refresh operation, which is useful for diagnosing slow or failed refreshes.
Creating a View From File (Excel/CSV)
1 From the Navigation Sidebar Menu > Go to Views and click + Create New View.
2 Under Upload Excel/CSV option, determine the datasource where you want the file data to be imported to by selecting the desired datasource from the drop down list of datasources. The list displays all datasources that are marked as ‘Use as import datasource’.
3 Upload the required file by clicking the Upload Excel/CSV option. Note that the file name shall not exceed 100 characters long.
4 Prepare your view as below.
-
The header row can be set by clicking
Set this row as headericon. -
When clicking on columns pop-up menu, it will give you options to manipulate and change several details in the excel – if needed as follows:
-
The data type can be changed. For example, if the field is just 0 and 1, you may set it to “Boolean” instead of “Integer”.
-
Column names can be changed – if their naming does not reflect their purpose.
-
Any column can be removed – if its data is not needed.
-
Any column can be set as primary.
-
Any row can be removed – if its data is not needed.
5 The view will be renamed automatically as the uploaded file name, but you may change it if required.
6 You may undo the changes you applied to the file by clicking Return To Template icon to rearrange your data again before creating the view, or re-upload the file through Update Excel/CSV icon in order to refresh its fetched data – in case the original file is updated.
7 Click Create New Table/View icon at the right-top of the page to complete the process.
8 The data is fetched from the excel file and dumped to the selected datasource and listed as a new view under “Views” page.
Upon successful creation of the view, its “Edit” window will open automatically in order to manage its settings and features – if needed.
Refreshing a View through Modify Excel/CSV Option
For views created from Excel/CSV files, if the data in the excel file has changed with time, you can refresh the data by uploading the file again through the “Modify Excel/CSV” option.
1 Go to Views > + Create New View > click Modify Excel/CSV option.
2 Choose the view that you want to refresh from the drop-down menu. All views that were created from Excel/CSV files will be listed in the menu.
3 Upload the updated file again by clicking Update Excel/CSV icon. If the file name was not changed, its updated data will be automatically replaced in the same template.
4 By clicking Reset Template icon, it will reset the table of the view back to the excel file settings, and you may edit and change the settings of the template similarly as in Point No. 3 in “Creating a View From File (Excel/CSV)”.
5 You can change the data Insert Type from “Overwrite” (Default) to “Append” – if needed. Note that “Overwrite” will replace the existing data in the template with the updated data values from the uploaded file, while “Append” will add any new data values/rows without deleting any of the previous data.
6 Other options for managing the view are available as below:
Imported Table icon: upon click, it will open the related table of the view in “Edit” mode.
Imported View icon: upon click, it will open the view in “Edit” mode to manage its settings and features.
Delete icon: upon click, it will delete the view from MariaDB data source.
7 Once your view is set and updated as required, click Update table and go to view icon button at the right-top of the page.
Note
You may update the Excel/CSV file and refresh its related view data from the view “Edit” mode > Edit Imported File icon.
Creating a View from Imported File
In TURBOARD, users can export (through “Share” option) any TURBOARD element, starting from views, dashlets, dashboards and up to a whole showcase into an external file (a “.tur” custom file format specific to TURBOARD application) compressed inside a (.zip) folder.
This allows users to replicate such elements – instead of creating them from scratch, applying their analysis to another data source, and/or copy some elements into another TURBOARD PROD – through importing the same file into TURBOARD again.
Benefits of Importing/Duplicating a View
For views in TURBOARD, when IMPORT FROM FILE option is used, this allows you to:
-
Create a new view for a different data source as a replica of another view available at another data source. As you may prepare a view with several custom filters, user-defined expressions, parameters and other settings, the “Import” feature allows replicating all such user-defined settings automatically and connecting them to another data source without the need to set them manually again in the new view.
-
Another use case for this feature is to allow you to analyze historical data and compare it with the latest data if your historical data is stored in another data source or database.
-
It also allows you to copy a view into another TURBOARD product installation.
Conditions for Creating a View from Imported File
One condition is required to complete the creation successfully: the data tables in the new data source must have the same name and structure (fields/nodes) of those in the exported view file.
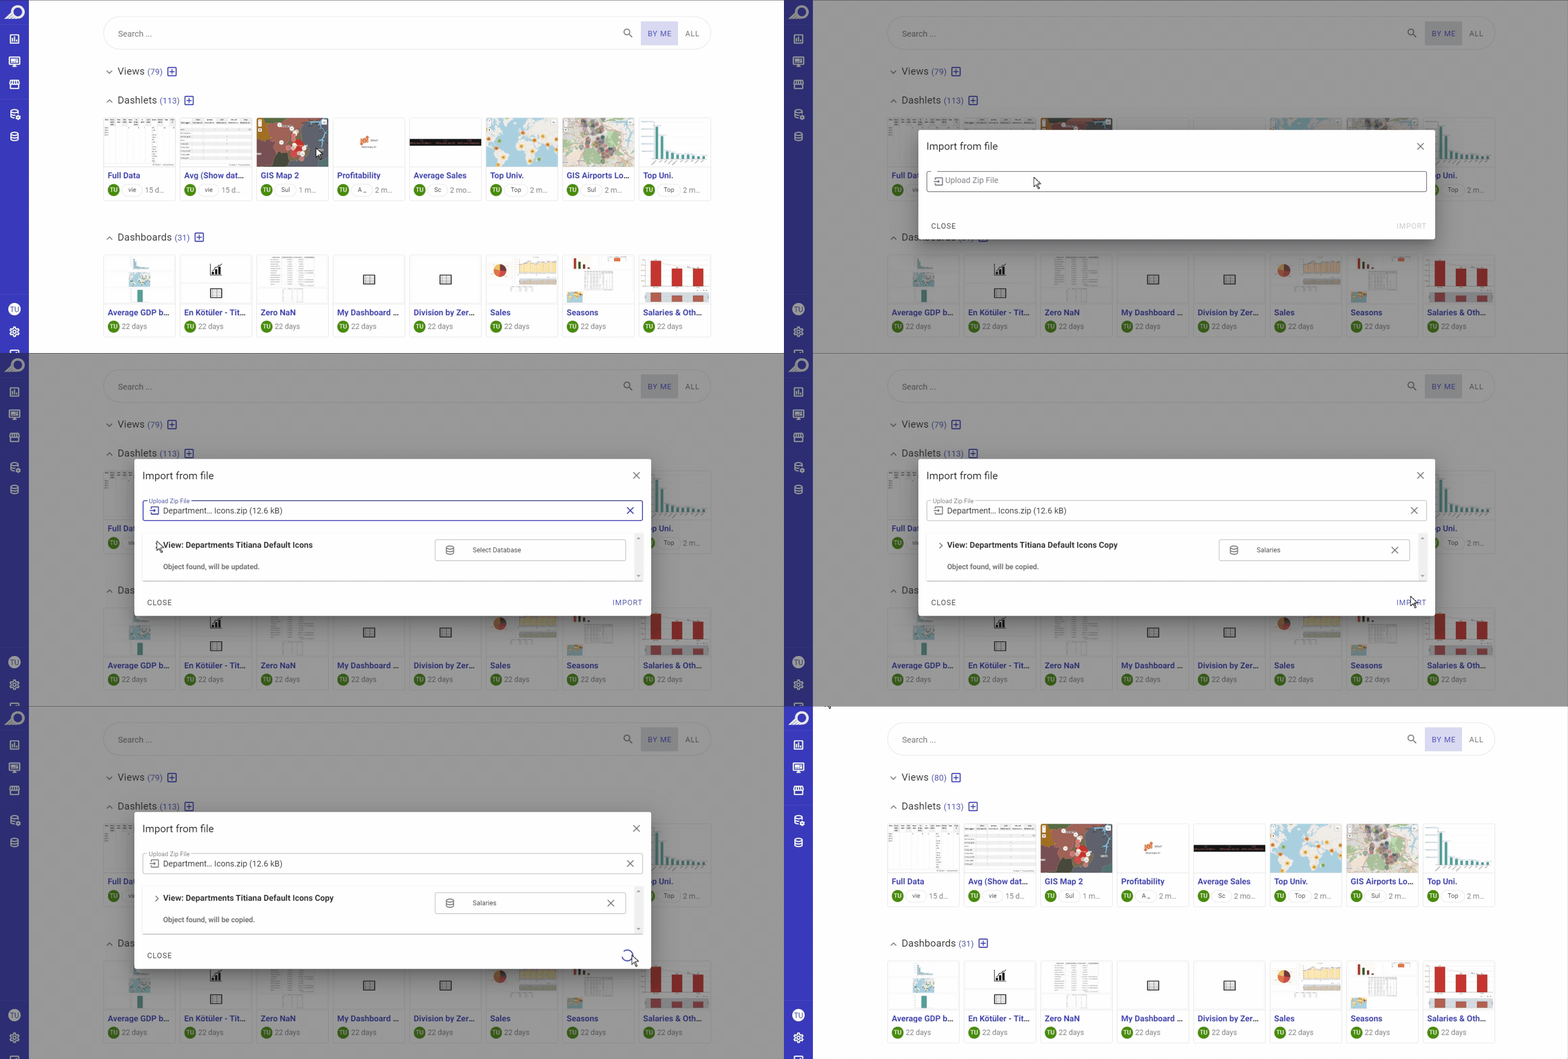
1 Go to Views > + Create New View > click IMPORT FROM FILE option.
2 Upload the exported (.zip) folder that contains the “.tur” custom file. TURBOARD will automatically detect the tables and the data structure in the file and will apply them to the new view. The structure and the detected elements (nodes, filters, restrictions, etc.) will be listed in the overlay window.
3 From “Select Database” drop-down menu, choose the target data source that you want to link the created view to. All the data sources that are added to TURBOARD will be listed in the menu.
4 Click IMPORT button. The new view will be created and connected to the target data source.
Managing Views
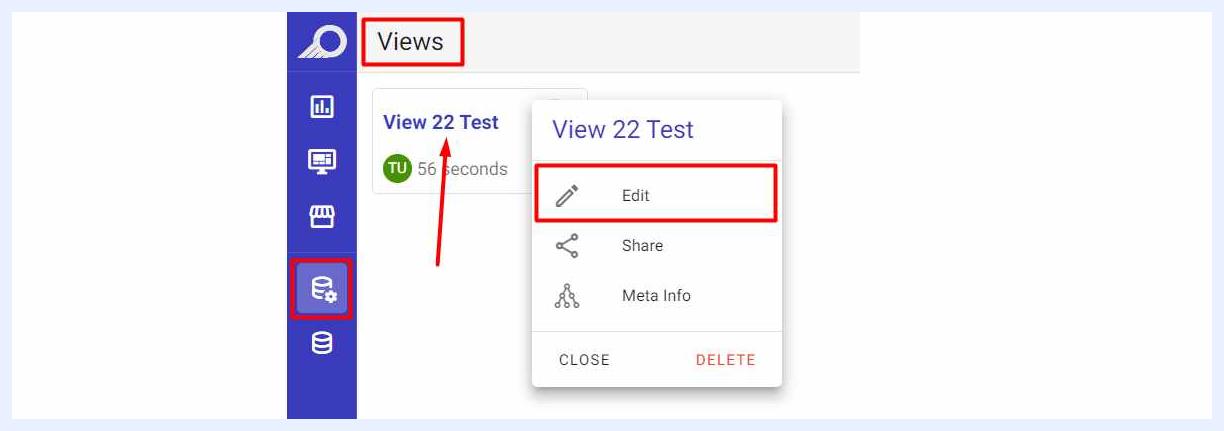
When a view is successfully created on the database, its “Edit” mode is automatically available to allow the user to manage and change its settings and features.
Any time later on, authorized users may edit/change views’ settings and features by clicking the name of the required view from “Views” main page or clicking on the right-side ellipsis menu of the view and choosing “Edit” option.
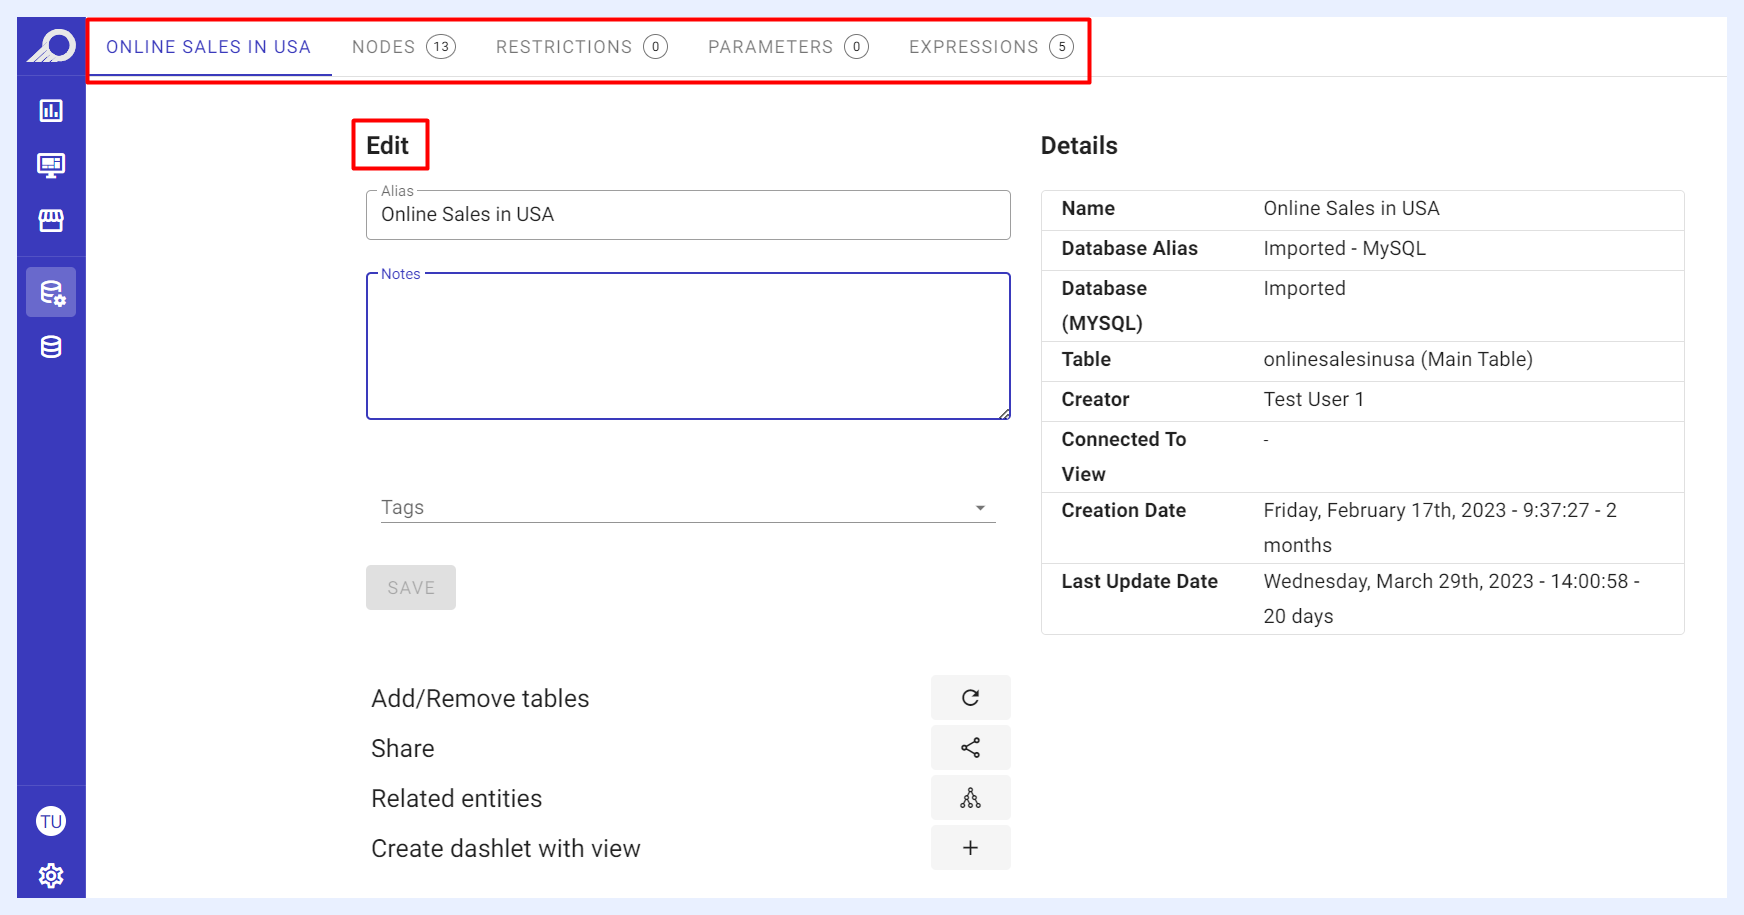
The page displays each feature and its settings in tabs located at the left-top side, in which the user can click on the required tab to manipulate its settings.
These settings are automatically recognized and determined by TURBOARD and are set by default when the view is created. Yet, the user can change them if certain business and/or end-user preferences are needed.
View General Settings Tab
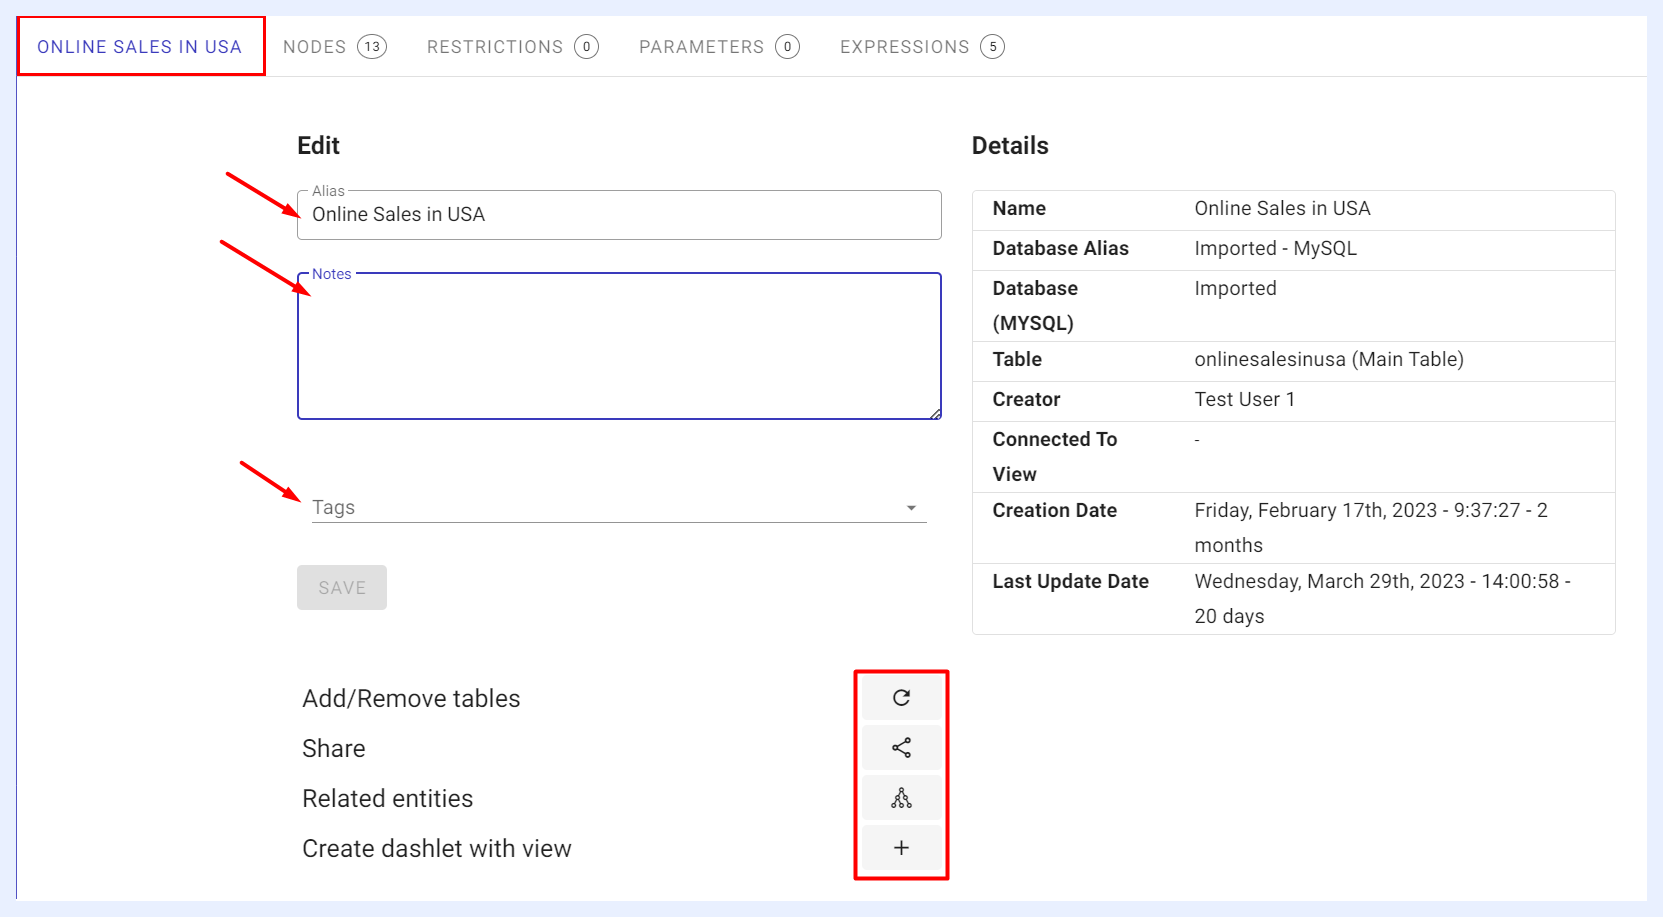
When the view is successfully imported/created, its alias is set by default according to its data source. However, the user can change the alias, add notes/description, and/or add tags to the relevant view.
Tags are useful for organizing and searching for content, as they allow you to quickly filter and find items that have been labeled with the same tag. When you label views with specific keywords or terms, it will help find them grouped together upon “Search” in their listing main page.
Other options/actions are available by clicking the related icon as below:
| View General Settings Actions Explained | |
|---|---|
| Add/Remove tables: | to refresh the data as it detects the changes in the data source and applies them by clicking “Refresh” icon button. |
| Share: | to share the view with other users or groups. When a view is shared with “Can Use” privilege, shared users may create any object ranging from dashlets to showcases. When it is shared with “Can Edit”, in addition to what is allowed with “Can Use” privilege, the user may apply changes to the view settings as well. This option can also be accessed from the View’s ellipsis menu in the Views’ listing window. |
| Related entities: | when clicked, a pop-up window opens listing all the related dashlets, dashboards and showcases that this view is used/depends on. This option can also be accessed from the View’s ellipsis menu in the Views’ listing window, namely the “Meta Info” option. |
| Create dashlet with view: | to create a new dashlet from this view. By clicking this button, the new dashlet creation page is opened with this view selected as its source by default. |
Nodes Tab
Nodes Settings
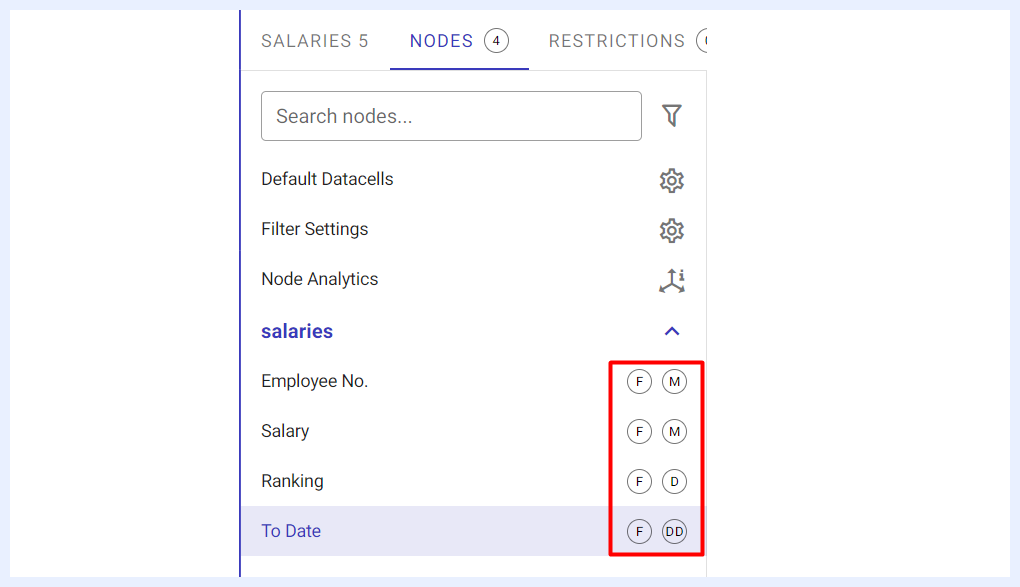
All nodes of the selected view are listed under this tab. Their types and settings are automatically detected and marked next to each node name accordingly.
| Node Type Icons Explained | |
|---|---|
F: |
indicates that this node is set as a “Filter”. |
M: |
indicates that this node’s type is a “Measure”. |
D: |
indicates that this node’s type is a “Dimension”. |
DD: |
indicates that this node’s type is a “Date Dimension”. |
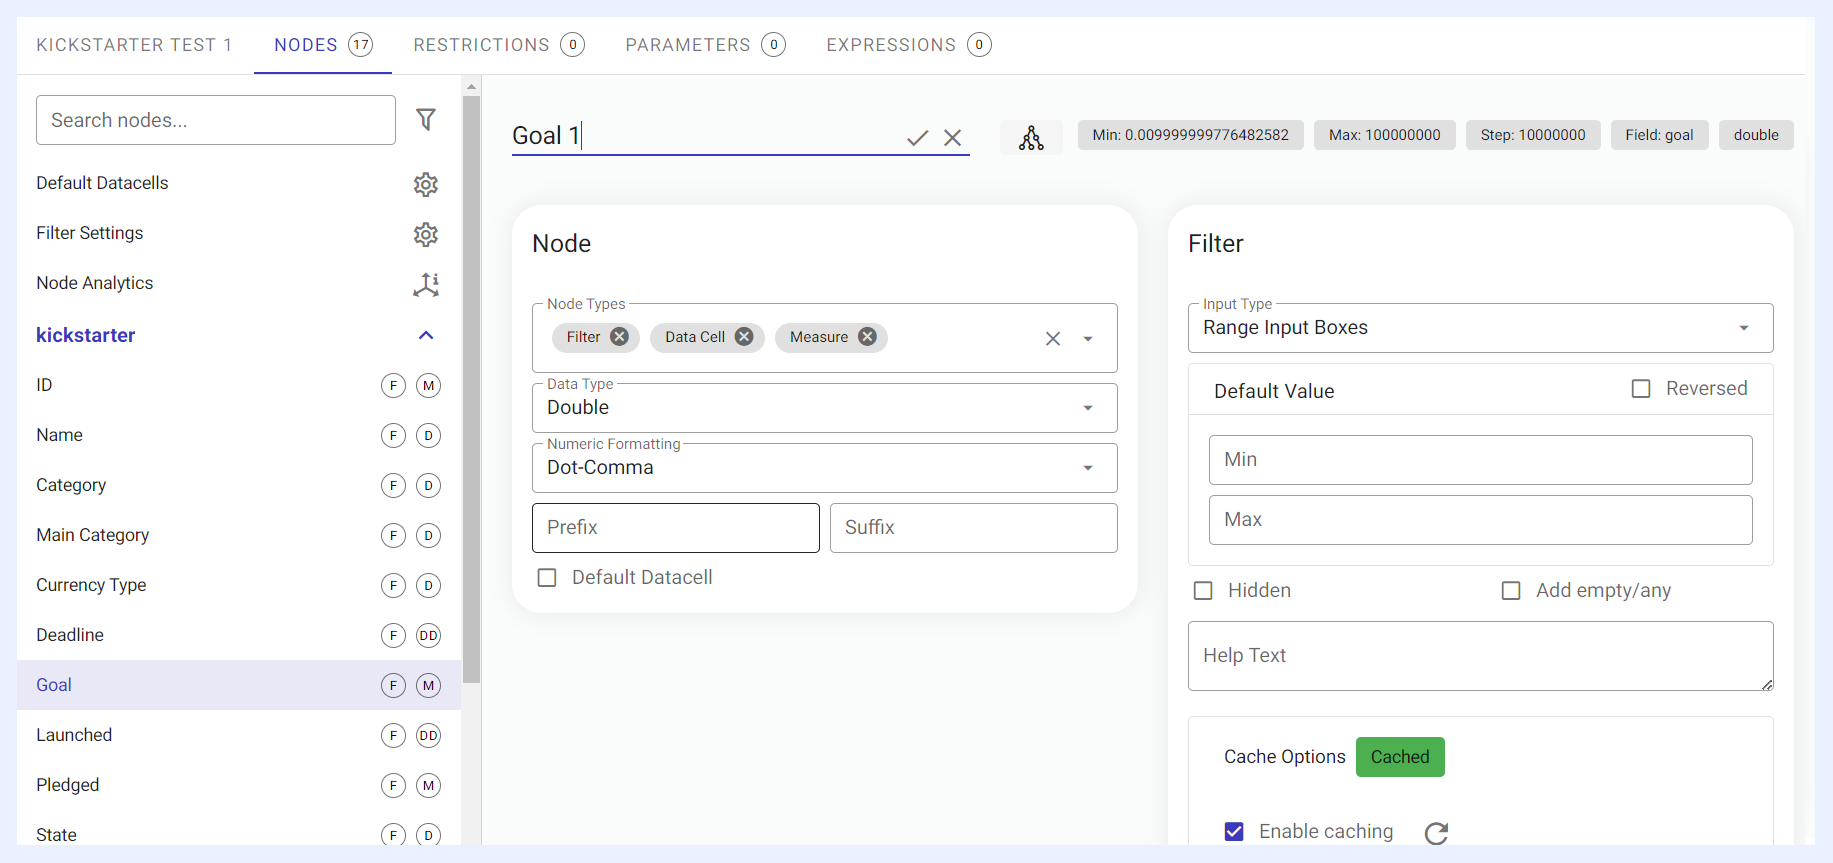
However, nodes’ settings can be changed/managed. As you select a node from the node’s list at the left-side of the “Nodes” tab window, its edit mode opens at the right as below:
Node Alias/Name
Field names are converted to human-understood format by default (Camel case or underscores are replaced by spaces for example), but further changes can be applied.
It is important to give a convenient alias to the node as the users will see the alias in the resulting visualization.
Although the alias may still be changed when preparing a dashlet (at Dashlet given alias level), the alias at view settings will be the default.
To change the alias/name of a node, select it from nodes’ list > click on the node’s name at the top of its edit window > change the name > click ✓ icon > click SAVE button.
Node Descriptions
Each node can carry a description that clarifies its business meaning. Descriptions can be written manually, and TURBOARD can also generate them automatically using RAG (Retrieval-Augmented Generation) technology, analyzing each node shortly after creation and populating its description field. A clear description (for example, “Net revenue after discounts, excluding returns”) helps JAS respond with more precise, business-aware answers when it works with the view.
Node Types
Nodes correspond to fields in the database. Each node has a type depending on the data type of the database field it is connected to.
Node types are assigned according to the data type by default. But in case the semantic meaning and the data type does not match, it may be changed in this field.
For example, if the gender is saved as integer (1, 2, 3, ...) rather than the string values (male, female, unknown, ...), then it should be set as a dimension instead of a measure since no aggregation would be applied for such a field.
Other examples include:
-
If the data view will be used in regional maps, “Territory” can be added or removed from the assigned “Node Types”.
-
To convert a node that was detected as “Date&Time” to “Date” only or “Time” only depending on the data analysis needs.
-
When a node containing only two values (positive and negative) is detected by TURBOARD as “Varchar”, it can be converted to the “Boolean” type if desired.
-
To disable the filter feature for the nodes that will not be used as filters. This will reduce cache times of the filters and will ensure higher performance for your dashboards and visualizations.
Node Types Options
Filter
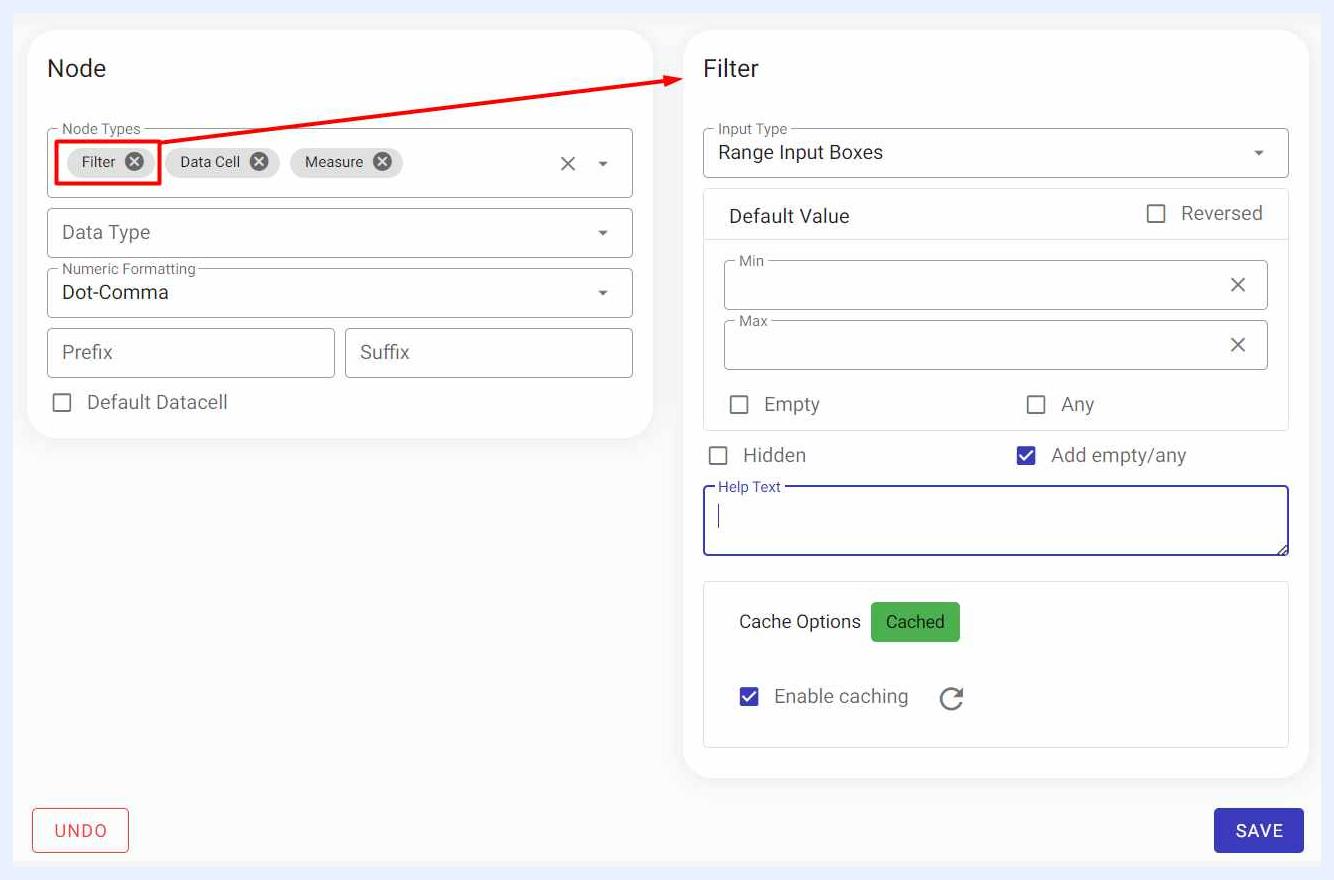
All the nodes (fields) of the created view are set as filters by default (marked with F icon), but it is sometimes needed to remove/disable the filter option for the fields that are not convenient for filtering or the granularity exceeds to billions in which caching all the distinct values will make no sense.
Designer and admin users can change/edit the configurations of any node that is set as a filter in “Filter” section that automatically appears at the right side of the node’s “Edit” window.
Dimension
Dimension fields are mostly of type “Varchar” and can be grouped. Note that in some database management systems, “Varchar” and “String” are used interchangeably for variable-length strings of characters, and in TURBOARD syntax, they are both referred to as “Varchar”.
A dimension is the categorical representation of the data such as customers, products, and time. Therefore, dates are always set as a dimension by default and are marked as DD.
Measure
A measure is a node type that depends on the area where the measurable values are located (for example data type).
The node of an “Integer” or “Double” field is marked when importing the data source as a criterion. The user does not need to select it. However, re-marking can be done in some cases.
For example, an “Integer” field containing only year data is marked as a measure in the system, the user has to re-mark this field as a dimension. Measures’ Settings and Preferences are set when creating the related dashlet.
Latitude
This node is connected to the area that contains latitude data. It must be selected by the user.
Longitude
This node is connected to the field containing longitude data. It must be selected by the user.
Territory
It is the size used in SVG maps and is determined by the user, not automatically.
This field contains the territory names, such as city, province/state or country names.
A different SVG map is needed for each territory type and they are configured by an admin user in Administration section > Maps > Regional Maps.
Geometry
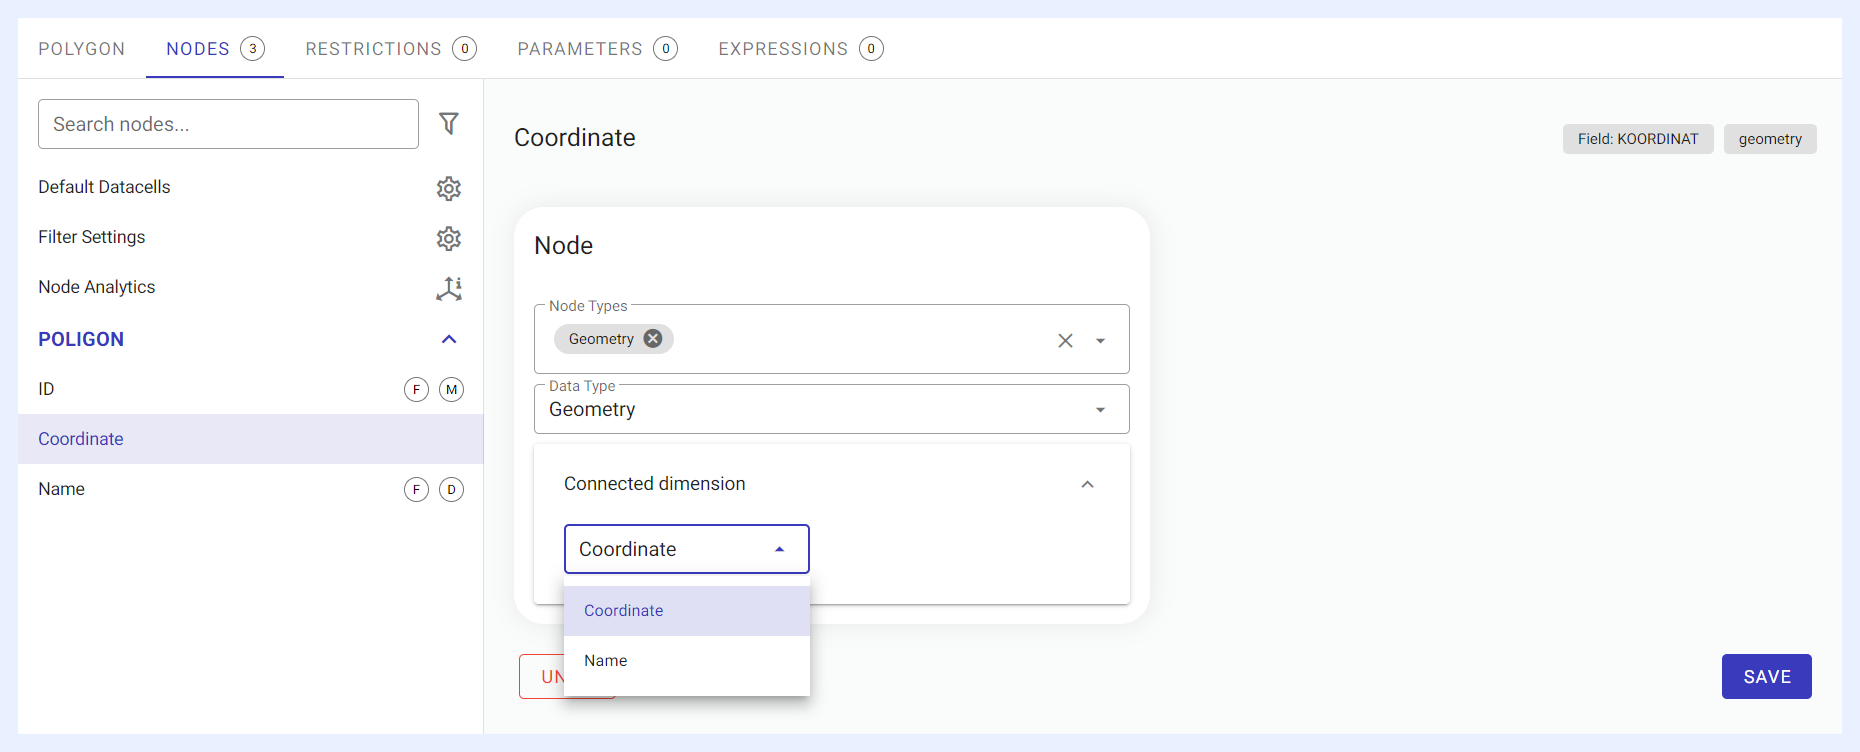
This node is connected to the area where the location information is stored. It is marked automatically. It does not need to be specified by the user.
The only important setting here is to choose the dimension to which the geometry field is attached in “Connected dimension” field. If this size is not selected, the Dashlet will not work.
Data Type Options
Data Type: for the same example in “Node Types”, if the gender is saved as “Integer” (1, 2, 3, ...) rather than the string values (male, female, unknown), it would be better to change its data type to “Varchar” so that the corresponding filter component may be changed to combobox, radio, check box and so on. Type conversion results in a cast or convert function at the database level.
Numeric Formatting (for Measures)
Numeric Formatting: for numeric fields, the default formatting is set here. Choices are:
-
No formatting: when selected, the resulting value of this numeric field in the related dashlet is displayed as-is.
-
Abbreviation: when selected, the resulting value of this numeric field in the related dashlet is converted to thousands, billions, millions abbreviated forms.
-
Dot-comma: when selected, the resulting value of this numeric field in the related dashlet is converted to 2 digits after the decimal comma.
-
Custom: when this option is selected, a pop-up window opens with other different formatting options. The user can select the desired formatting option then click
APPLYbutton to apply the changes.
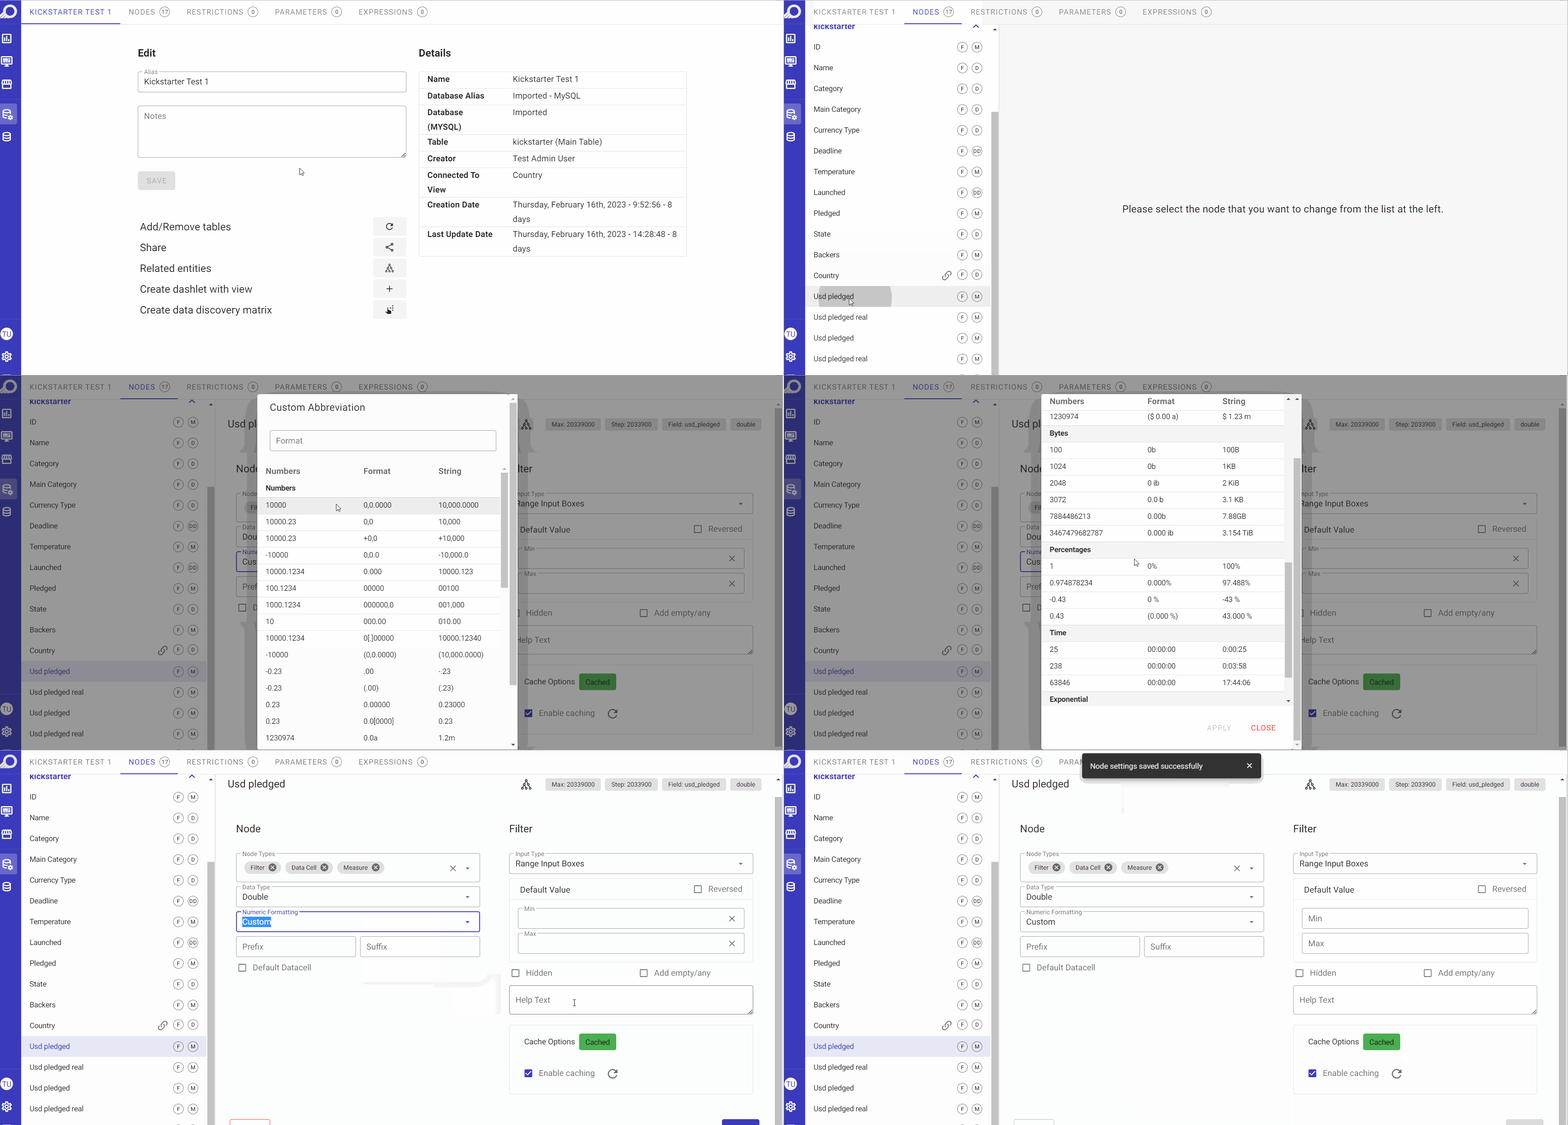
Custom Numeric Formatting
Determining Default Datacells
Except for the infocell and gauge, distinct rows in the result set of any dashlet is accessible via the “Detailed view” eye icon available at the dashlet menu (at the dashboard “View” mode).

The admin user can give access to the dashlet details page which contains:
-
The dashlet from which the details (eye) icon is clicked.
-
Dashlet's pivot version – if the original dashlet is not a pivot table.
-
The unpivoted table with all the rows in the result set of that dashlet.
Unpivoted table is the default dashlet which is auto-created in all views. Nodes with “Default Datacell” check box checked as “Yes” will appear by default at that unpivoted table.
Prefix and Suffix (for Measures)
For nodes/fields of type “Measure”, Prefix and Suffix options will appear automatically in order for the user to assign a prefix or a suffix to it, as sometimes suffixes and/or prefixes add more meaning to the measure and makes it more insightful. These options are mostly used for currencies or percentages (if the unit is known).
For example, if a temperature data is used as a measure, a Suffix can be added to indicate to the user that this data is displayed in °C.
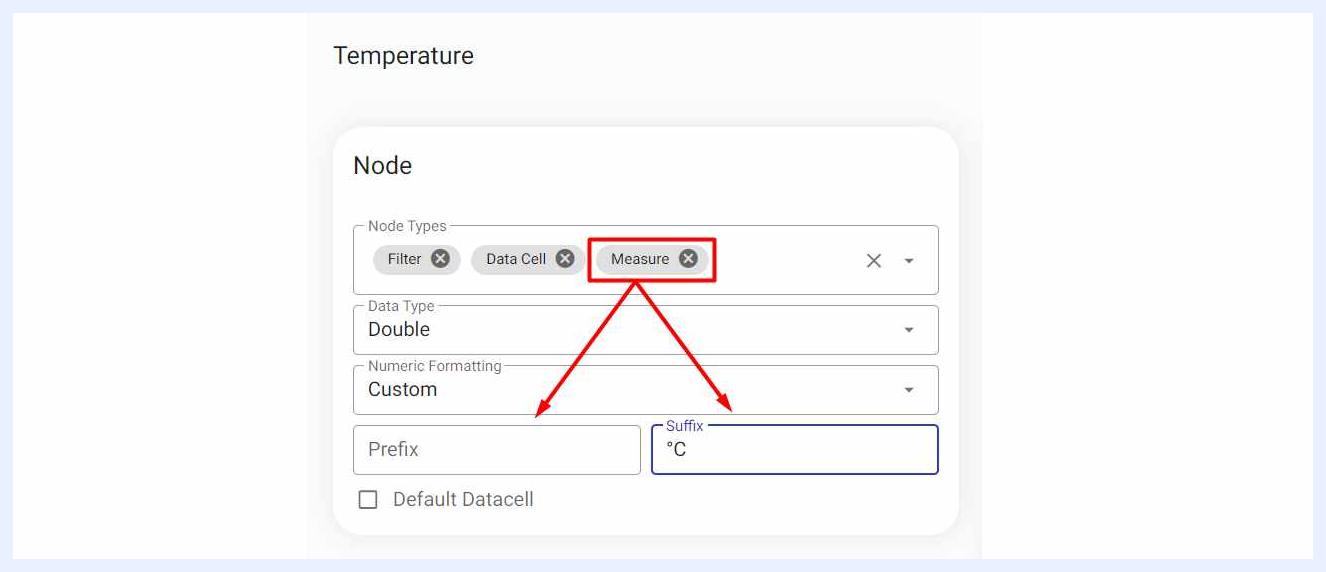
Sort Options (for Dimensions)
For nodes/fields of type “Dimension”, sorting options are available either in “Ascending” or “Descending” order. Value, alphabetical and custom sorting are the available choices.
The user shall be careful about using “Custom Sorting”. If “Custom Sorting” is selected, and not all the values are ordered, then the values that are not taken to the list won't appear in the created dashlets with that dimension.
Connected Dimensions (for Dimensions)
Most of the time, business needs and questions are not restricted to the same datasets. Through this option, TURBOARD users can drive fast analytics on ad-hoc requests by connecting different datasets from different databases to do cross dataset analytics as an advanced feature.
The user can select the other view to connect it to the current one, along with its node from the related drop-down lists.
There is no limit on the connection count, it is possible to add as many connections as desired, either to the same field or to other fields.
Once the connection is added, the other view will have the same connection automatically. Both dimensions under their related view will be marked with a Link icon. All related measures and of both connected dimensions will automatically be listed together and can be used to create dashlets.
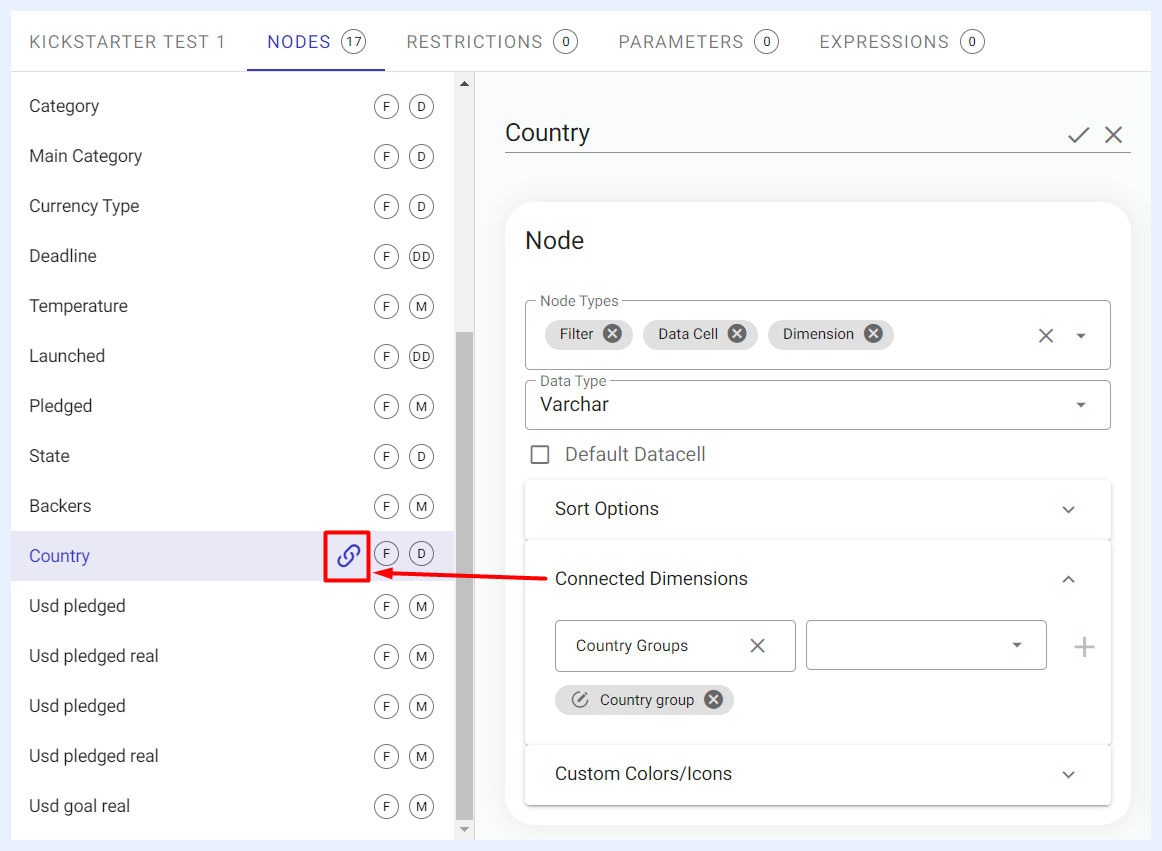
Customizing Colors/Icons for Dimensions on the View Level
For nodes/fields of type “Dimension”, the “Custom Colors/Icons” check box will appear automatically in order for the user to assign the required colors or icons that can be associated with the dimension values.
Triage values are red, yellow and green, so it is better to visualize those with their value colors.
If the same colors are to be used within multiple nodes, the color file can be exported and imported (in “.jason” file format).
You have the option to associate an image (by uploading it from your computer) instead of selecting an icon from the available ones in TURBOARD.
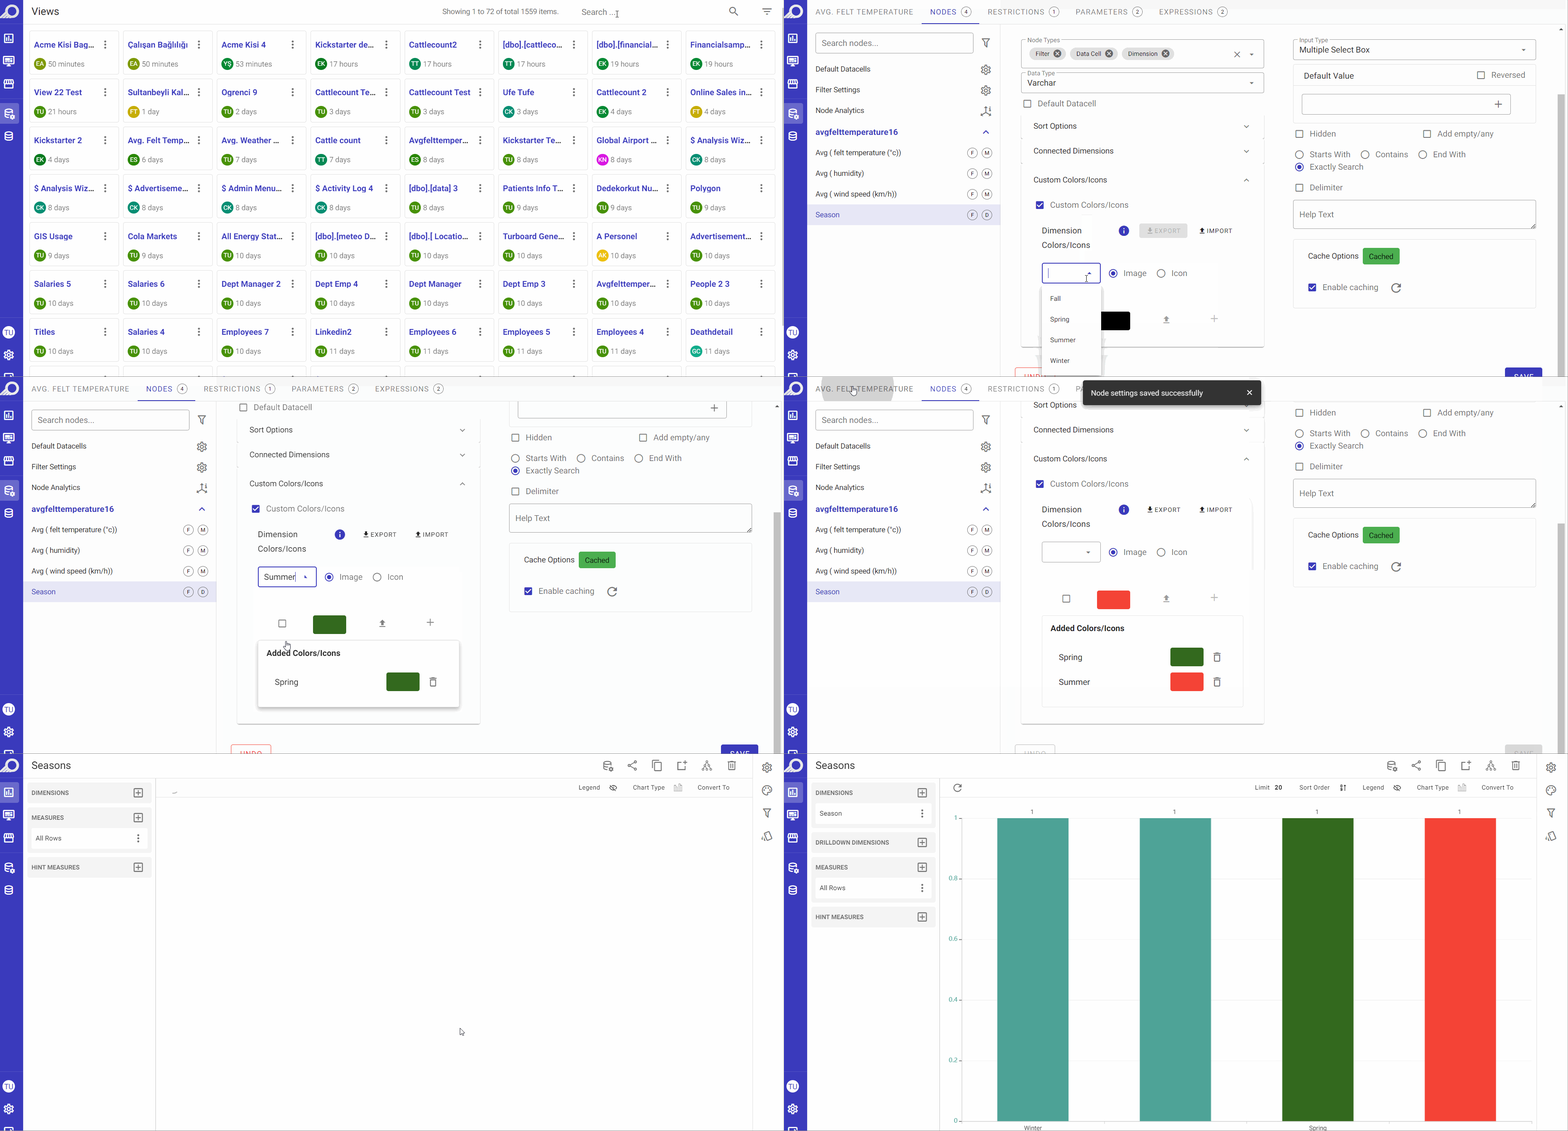
Custom Colors, Icons and Images
Filter Settings for Nodes
As all the nodes (fields) of the created view are set as filters by default, and unless the user did not disable/remove the filter from “Node Types” fields, the filter settings can be managed in the right-side panel named “Filter”. The panel auto-opens for any selected node that is marked as a “Filter” only.
- “Input Type” field: a drop-down menu listing the HTML components that can be used for the selected filter. It determines how the filter will look like on the visualization it is used in like a “Radio Button” or a “Check Box” or a “Multiple Select Box” and so on. According to the node type, its data type and count, TURBOARD will activate the options that are appropriate to be applied on the filter from which the user can select from.
Note
The “Input Type” field will appear for cached filters as the HTML component type can be detected and displayed after the process of storing the results of the filter and evaluating its components is completed. So it may not appear immediately on creating the view.
-
“Default Value” fields: if the default value (Min. and Max.) is set at the view page, it will be valid for all objects created from that view. In case of having different default values or no default at all, it should be customized at the dashboard's filter settings.
-
“Reversed” check box: if checked, it will exclude the selected default values instead of filtering them in the used visualization.
-
“Hidden Filter” check box: this option is used when, in some business cases, the filter is added but needs to be hidden from end-users.
-
“Add empty/any” check boxes: to allow searching for any or empty items instead of a value. This option can be considered an alternative of the null and not-null in an SQL.
-
“Help Text” field: the text inserted in this field will appear with an “i” icon next to the related filter name at the resulting dashboard and will be displayed as a hint/tooltip.
-
“Enable caching” check box: filter choices are the results of the min. and max. or group by/distinct queries. Since filter options are not changing very frequently, they are cached. “Cache Options” provides the configuration of caching.
Other Settings for Nodes Tab
Default Datacells PT Settings
By clicking “Default Datacells” option, a window will open listing all the datacell values in a non-pivoted table.
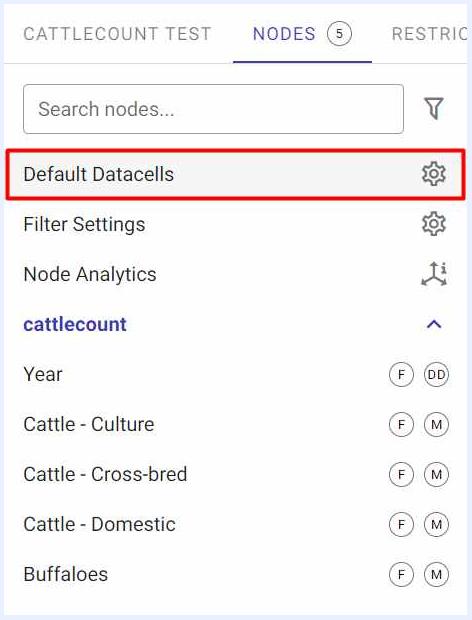
Through this option, you can set the default datacells and the pivoted table that will be created by default when a dashlet of type “Pivot Table” is added from this view. In other words, the table that you prepare and design in this section will be the default PT dashlet when created. Still, a Designer user can change those settings on the PT dashlet level.
Furthermore, the table that you prepare in this section will also be the default “Detail Table” when a dashlet is viewed in “Detail View” mode. i.e. from Detailed View option that is available for some dashlet types in dashboards “View” mode.
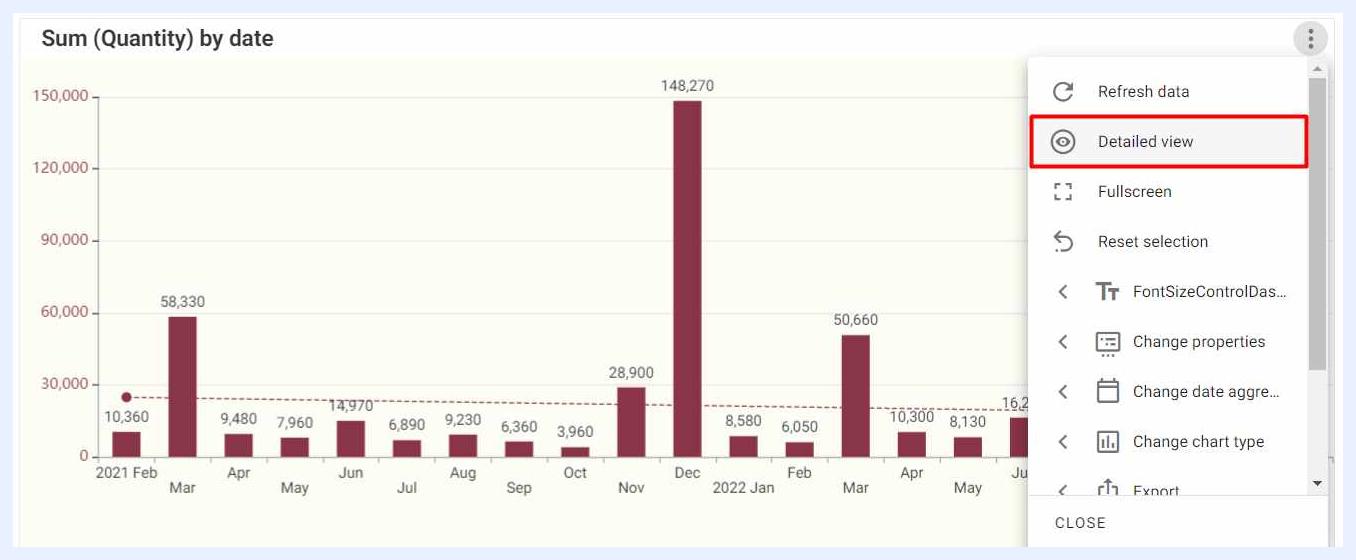
Also note that you may change the settings in this section any time needed. The latest changes will be automatically saved and displayed any time you click “Default Datacells” button again.
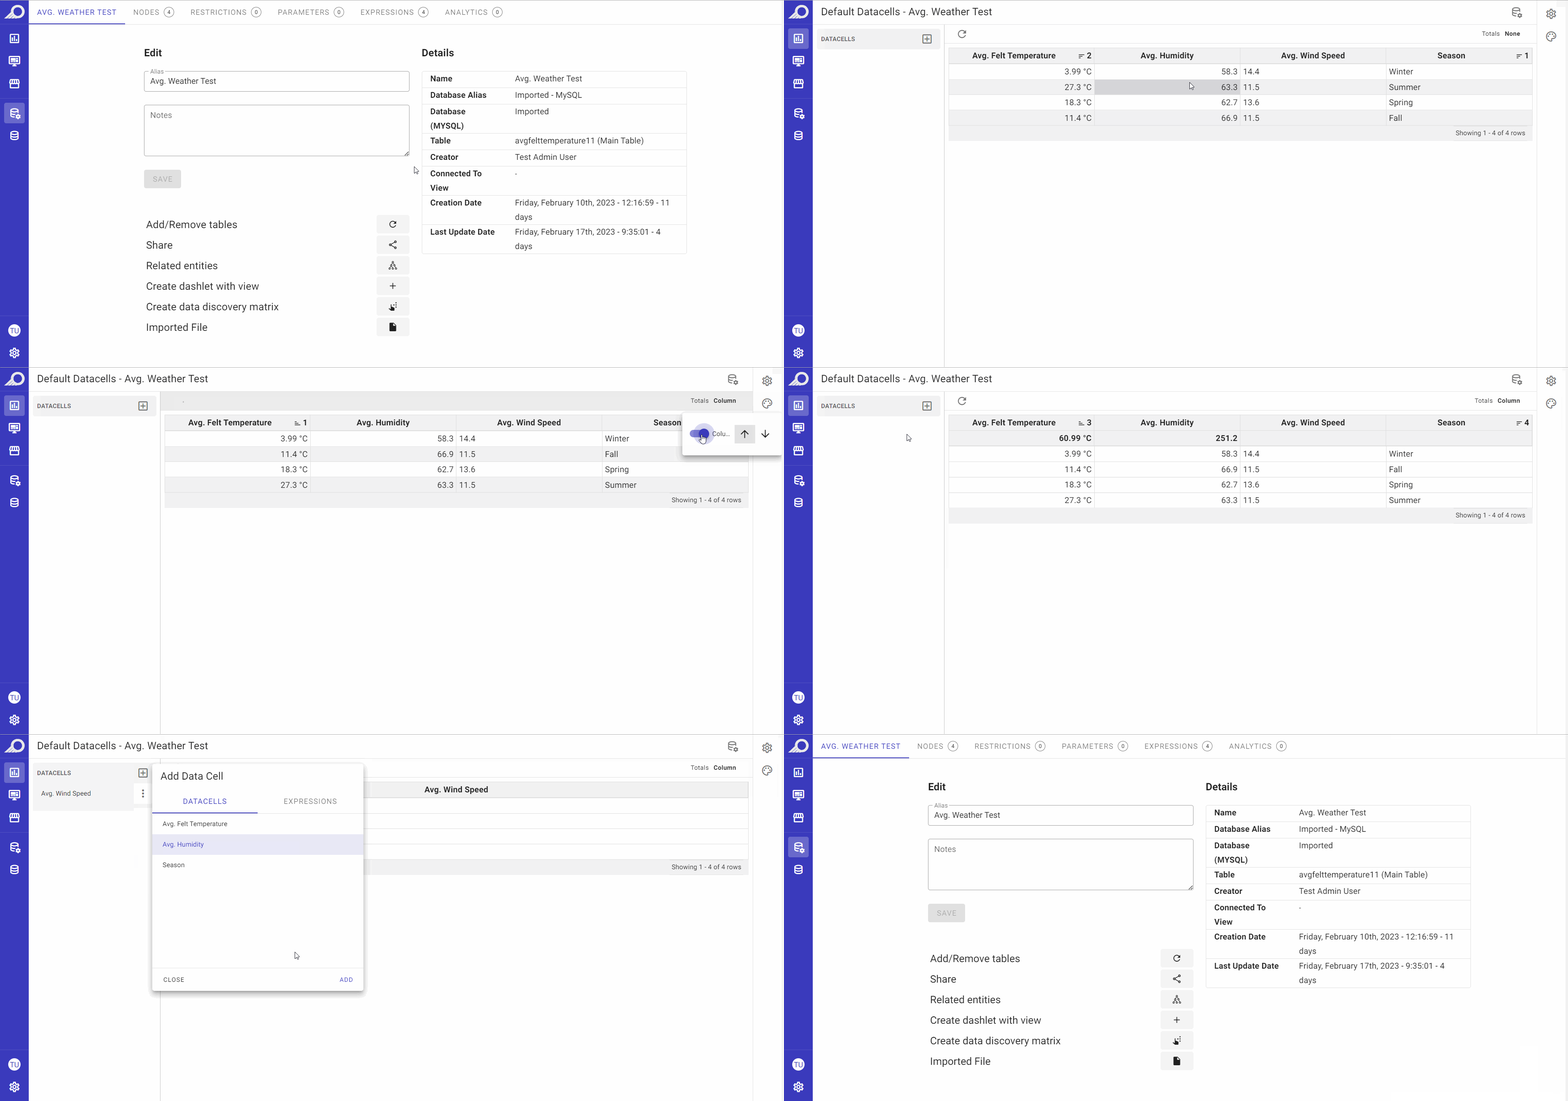
Additionally, while preparing your View (dataset), it is beneficial to be able to take a look at the data itself. This allows you to examine the data, identify missing values or outliers, spot errors or inconsistencies, and gain an understanding of the data distribution. By doing so, you can improve the accuracy, reliability, and suitability of the data for analysis, making it easier to draw meaningful insights from your analysis.
You can view and prepare the default table for new PT dashlets and/or detailed table views for other dashlets as below:
Rows can be sorted descending or ascending.
Totals of numeric data can be added to the top or the bottom of their related column/s using “Totals Column” button.
The data can be filtered and ordered as desired.
Other “Settings” and “Styling” options are available at the right-side pane. More details on how to use them can be found under Dashlets > Pivot Tables section.
Filters Settings
From Nodes tab > Filters Settings option, you may manage the general settings for all filters as below.
“Filter Caching” refresh icon: used to refresh cache of all filters in the relevant view.
“Auto Refresh” check box: if auto-refresh is needed/preferred for filter caching, its schedule is set on daily, weekly, monthly or yearly basis and the required date and time is determined as well.
“Default Filter Min-Max Dates” check box: the date field changes by its nature. If the data is live, having min. and max. dates enables playing with live data in the filter.
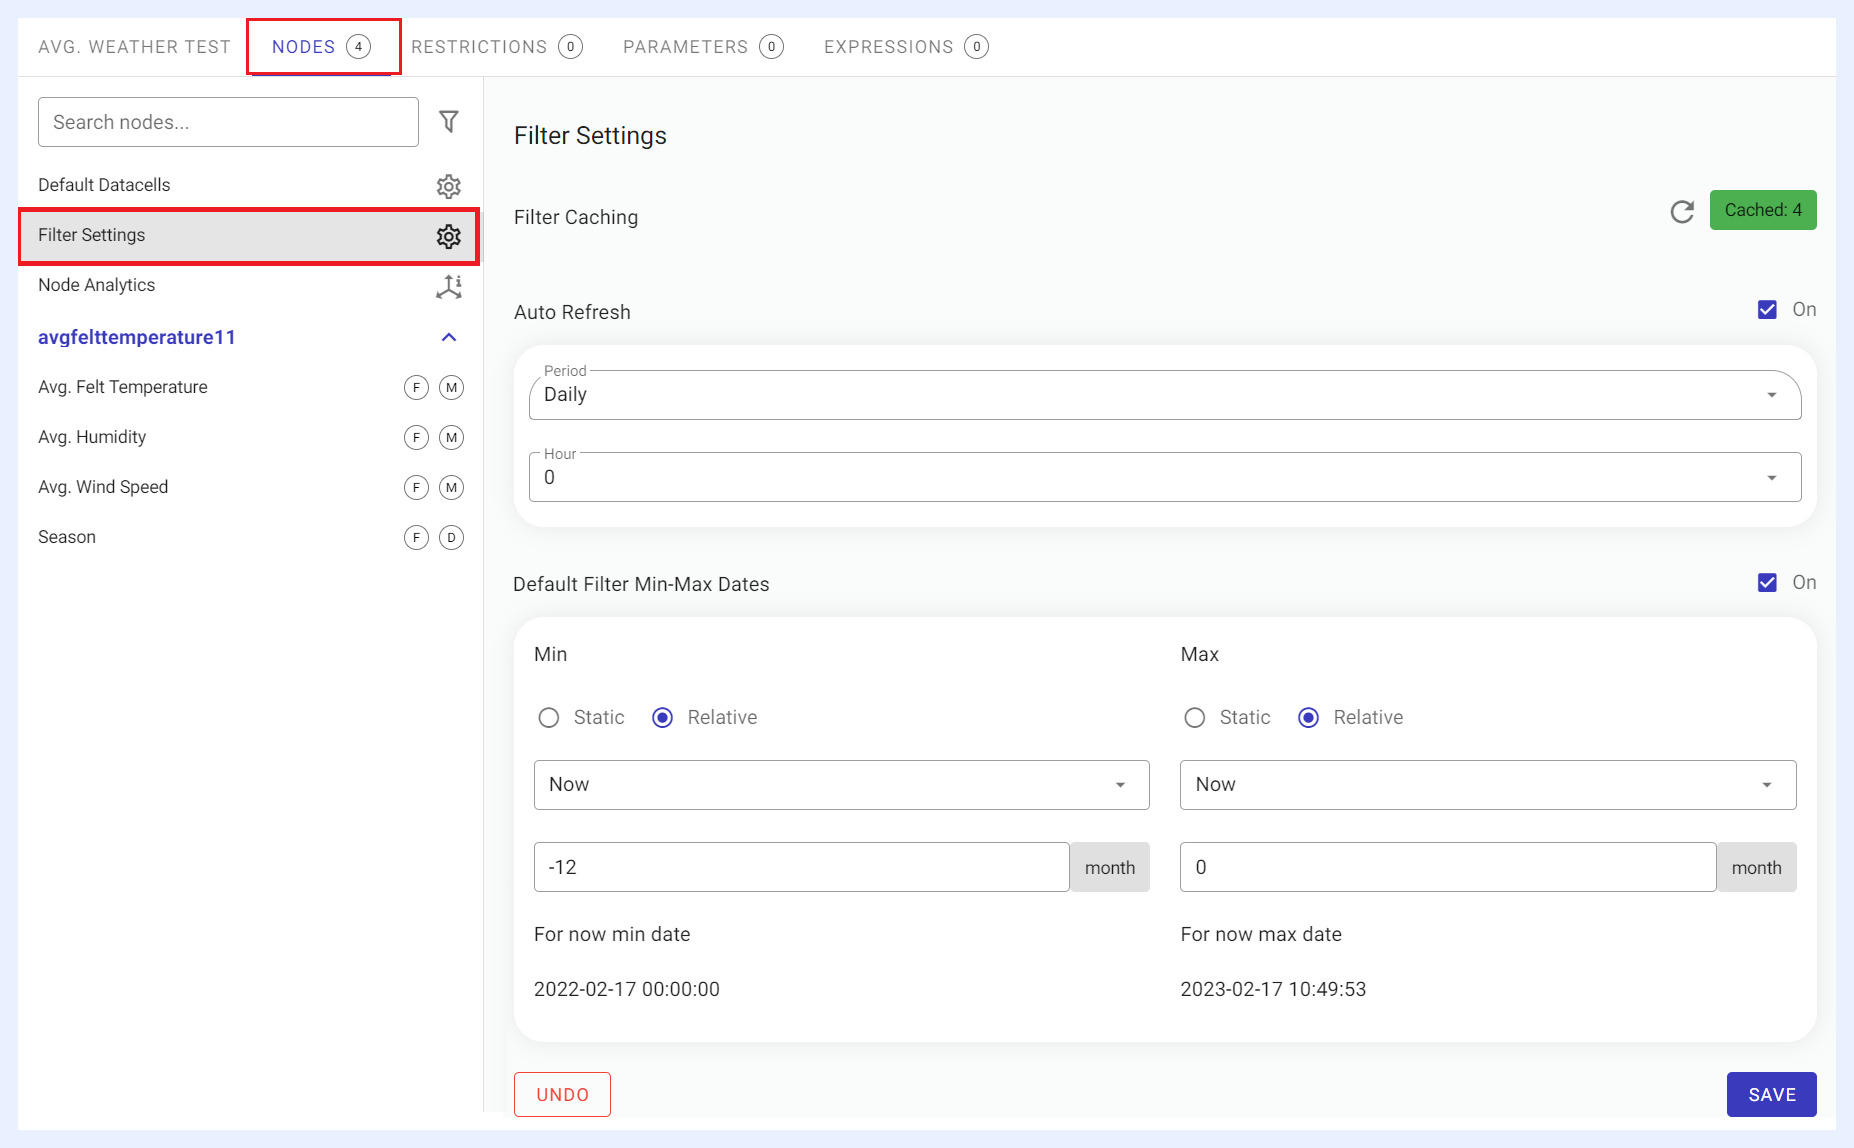
Filters General Settings
Node Analytics
Before using a view (dataset) in a dashlet, analyzing it can bring about several benefits. By selecting the “Node Analytics” option, TURBOARD generates a report that includes various statistics on the nodes' types, such as the minimum and maximum values, mean, standard deviation, count, not-null count, unique values, top values, and more. This information allows you to gain a deeper understanding of the data, and use it to create meaningful visualizations in a dashlet.
Through such analyses, you can identify any data quality issues, pinpoint the most critical data points, and gain insights into the data's distribution, which can help you manage its settings and features more effectively.
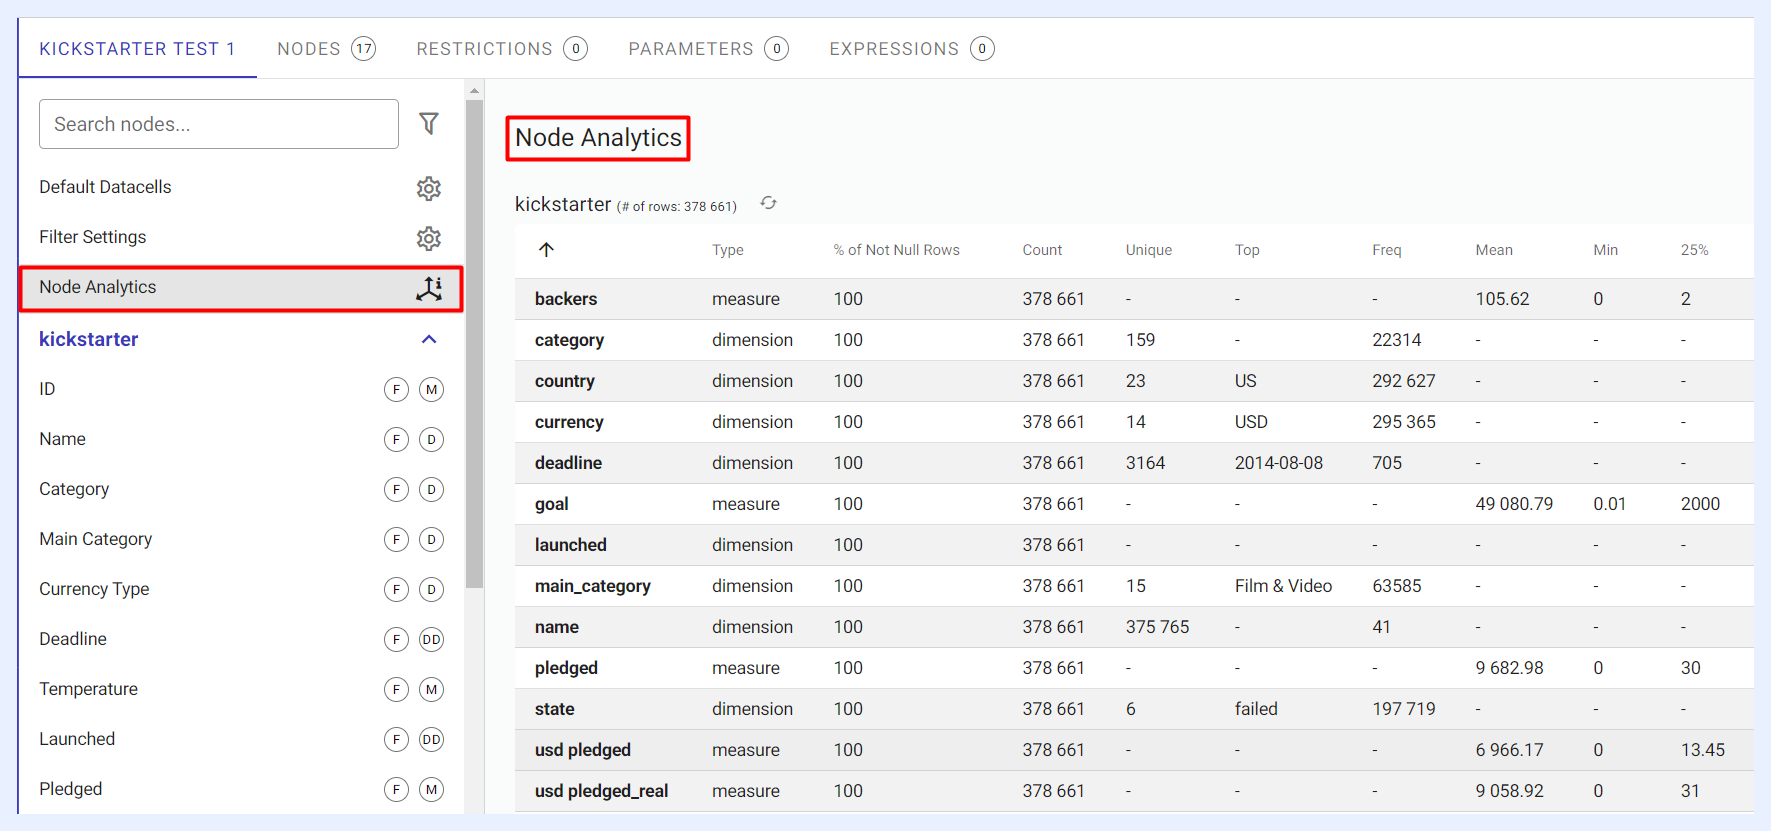
Restrictions in Views
Restrictions Tab
A restriction provides limitation on the data to which the entire dataset is connected to. The main purpose of restrictions is to exclude a portion of data from being viewed, accessed and analyzed in dashlets. Users may need to exclude some data for the below reasons:
-
The need to exclude dirty data (some data that is incomplete, outdated, duplicate, inaccurate, etc.),
-
To eliminate outliers,
-
To prevent other users from viewing and accessing certain data for privacy issues.
Restricting Data in Nodes
How to restrict data in nodes?
1 In “Restrictions” tab, select the node/field that you wish to restrict its data from the left-side menu.
2 Determine the values you want to restrict in “Restricted Values” field.
3 You may select the data you want to be visible one by one, or alternatively, you may select the data you want to exclude from your view by selecting the “Reverse” option from the right-corner ellipsis menu.
4 If you decide to restrict some data while working on a dashlet, TURBOARD gives you the option to directly open the “Edit” window for the related view of that dashlet through Edit data view icon.
Note
as you are using restrictions on data views and data tables, this means that any resriction/s you make will take effect on any dashlet where that view is used. Think of restrictions as a macro criterion that will always be added to the end of each query that is executed on that view.
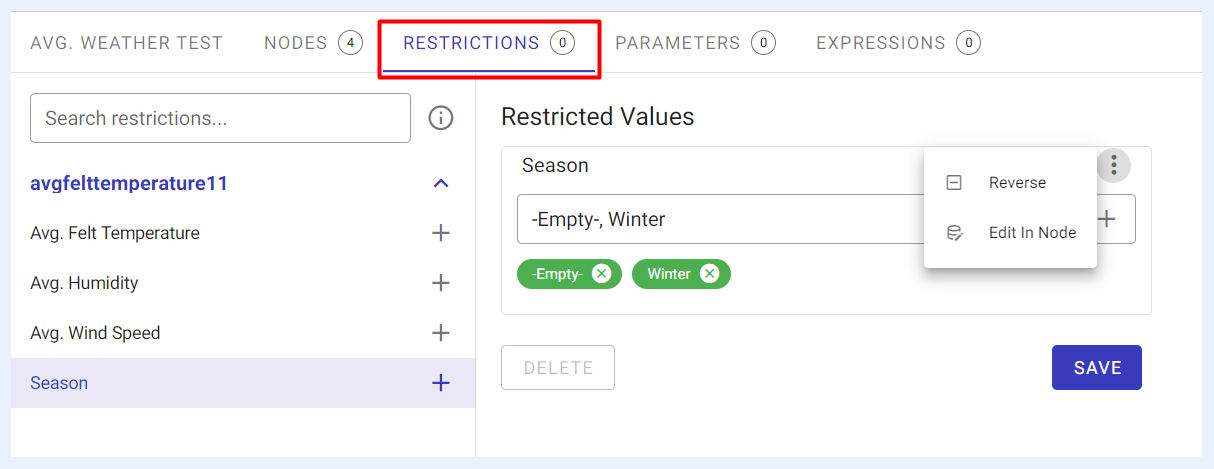
Nodes Restrictions
Parameters in Views
Parameters Tab
In TURBOARD, parameters are powerful tools that allow users to dynamically customize data queries and reports based on specific inputs. They can be used to filter data, set thresholds, or simulate “what-if” scenarios without modifying the underlying dataset or SQL queries. Parameters empower users to interact with the data and perform flexible analyses, adjusting queries in real-time to generate insights from different perspectives. This dynamic feature helps users create interactive dashboards that can adapt to various needs and business questions on the fly.
Types of Parameters
1 Pre-defined Parameters: TURBOARD includes commonly used date parameters by default, which are often needed for filtering data by time ranges.
2 User-defined Parameters: These are custom variables created by users. They can function similarly to macros, enabling flexible, dynamic reporting, or be used in what-if scenarios to simulate different outcomes by adjusting values within formulas.
In Data Science, a variable represents a feature or attribute of the data, such as age, income, or temperature. Variables are used in analyses, models, and algorithms to make predictions and identify patterns.
In SQL, a variable is a placeholder that temporarily holds data during query execution. When you define a custom variable in SQL, you're creating a user-defined element that stores a value, allowing for dynamic and flexible queries.
How to Use Parameters
Parameters are integrated into SQL expressions to add dynamic capabilities to your dashboards. When you define a parameter in TURBOARD, it acts as a placeholder that users can adjust in real-time to modify the outcome of a query. This dynamic structure allows users to filter data or perform simulations instantly, directly affecting the data displayed in the dashboard.
Users can customize parameters according to specific criteria, such as revenue, expenses, or other key metrics, to simulate how changes affect overall results. This makes TURBOARD dashboards highly interactive and flexible, enabling different users to analyze the same data from various perspectives and quickly evaluate different scenarios.
Sample Use Cases for Parameters
1. Shipping Deadline Verification:
Purpose: Define a parameter to allow dashboard users to check if orders can be shipped within a specified number of days.
Parameter Options:
-
Parameter Alias: MaxShippingDay
-
Parameter Type: Numeric
-
Value Type: Single
-
Min & Max Values: 0 to 30
-
Step: 1
-
Default Value: 5
SQL Implementation: To use this parameter in your SQL query, the below code is appropriate.
| sql |
|---|
SELECT CASE WHEN `sales_data`.`end_date` < DATE_ADD(`sales_data`.`start_date`, |
Result: This query checks whether orders can be shipped within the MaxShippingDay that the user selects or specifies in the dashboard's filter control and labels each order as either 'Can Be Delivered' or 'Need More Time.' For example, a user can adjust the shipping day threshold to values such as 5 days, 10 days, etc., and the query will recalculate the delivery status accordingly. When using dynamic parameters like MaxShippingDay in SQL expressions within TURBOARD, they should be enclosed in both asterisks (*) and double quotes ("**). This marks the parameter as dynamic, enabling TURBOARD to substitute the value during filter query execution based on the user-defined input.
2. Threshold Alerts:
Purpose: Define a parameter to set a threshold for triggering alerts in your dashboard reports. For example, ‘MinStockLevel’ can be set to trigger an alert when stock levels fall below a certain number.
Parameter Options:
-
Parameter Alias: MinStockLevel
-
Parameter Type: Numeric
-
Value Type: Single
-
Min & Max Values: 0 to 500
-
Step: 5
-
Default Value: 10
SQL Implementation: To use this parameter in your SQL query, the below code is appropriate.
| sql |
|---|
SELECT CASE |
Result: This query categorizes inventory stock levels based on the MinStockLevel parameter. When the stock level is below or equal to the specified threshold, the result is labeled as 'Alert: Low Stock.' If the stock level is above the threshold, the result is labeled as 'Stock Sufficient'. The MinStockLevel parameter can be used as a filter in the dashboard, adjustable in steps of 5 or 10. When users adjust this parameter, the dashboard dynamically updates, allowing stock status to be instantly analyzed according to the new threshold, ensuring timely low-stock alerts. When using parameters such as MinStockLevel in SQL expressions within TURBOARD, it is necessary to enclose the parameter name in both asterisks (*) and double quotes ("). This ensures that the system will replace "MinStockLevel" with the value input by the user at runtime. This dynamic substitution enables users to modify the parameter directly within the dashboard’s filter, thereby customizing their analysis and interacting with real-time data.
3. Budget Impact Simulation:
Purpose: Allow budget planners to simulate how overall budget outcomes will be affected by varying expense and income growth percentages.
Parameter 1 Options:
-
Parameter Alias: ExpenseIncrease
-
Parameter Type: Numeric
-
Value Type: Single
-
Min & Max Values: 0.00 to 1.00 (representing 0% to 100%)
-
Step: 0.05 (representing 5%)
-
Default Value: 0.10 (representing 10%)
Parameter 2 Options:
-
Parameter Alias: IncomeIncrease
-
Parameter Type: Numeric
-
Value Type: Single
-
Min & Max Values: 0.00 to 1.00 (representing 0% to 100%)
-
Step: 0.05 (representing 5%)
-
Default Value: 0.15 (representing 15%)
SQL Implementation: Two separate expressions to allow independent adjustment of expenses and income.
Expression 1 (for ExpenseIncrease):
| sql |
|---|
SELECT |
Expression 2 (for IncomeIncrease):
| sql |
|---|
SELECT |
Result: This setup provides two filters in the dashboard: the ExpenseIncrease and IncomeIncrease parameters. Users can adjust these parameters independently and simulate how changes in both factors affect the budget outcomes. The dashboard dynamically updates to reflect these changes, allowing users to analyze budget projections more flexibly and in greater detail based on the percentage increases in expenses and income. In this example, the parameters "ExpenseIncrease" and "IncomeIncrease" are enclosed in both asterisks (*) and double quotes ("**) within the SQL expressions. This dynamic substitution allows TURBOARD to replace them with user-defined values entered through the dashboard.
4. Profit/Loss Prediction Upon Price Changes:
Purpose: Allow users to predict profit or loss based on price adjustments for multiple products (Product 1, Product 2, and Product 3). These price changes are applied dynamically, and users can simulate how varying the prices of these products will impact their profit or loss.
Parameter 1 Options:
-
Parameter Alias: product_1_price
-
Type: Numeric
-
Value Type: Single
-
Min & Max Values: 0.75 to 1.25 (where 0.75 represents a 25% price decrease and 1.25 represents a 25% price increase)
-
Step: 0.01 (representing 1% of price change)
-
Default Value: 1 (representing the current price)
Parameter 2 Options:
-
Parameter Alias: product_2_price
-
Type: Numeric
-
Value Type: Single
-
Min & Max Values: 0.75 to 1.25 (where 0.75 represents a 25% price decrease and 1.25 represents a 25% price increase)
-
Step: 0.01 (representing 1% of price change)
-
Default Value: 1 (representing the current price)
Parameter 3 Options:
-
Parameter Alias: product_3_price
-
Type: Numeric
-
Value Type: Single
-
Min & Max Values: 0.75 to 1.25 (where 0.75 represents a 25% price decrease and 1.25 represents a 25% price increase)
-
Step: 0.01 (representing 1% of price change)
-
Default Value: 1 (representing the current price)
SQL Implementation: Three separate SQL expressions are used to calculate the predicted profit or loss for each product, based on AI-generated predictions for sales volume. These expressions adjust sales estimates depending on the dynamic price changes set by the user.
Expression 1 (for Product 1 Profit Calculation):
| sql |
|---|
SELECT (IF(SUM(inventory_data.weekly_sales_volume * (((0.94349684 * "product_1_price") + (3.22416552 * "product_2_price") + (-2.96978897 * "product_3_price") - 0.1980703342963821)) > 0, |
Repeat for Product 2 (product_3_price) and Product 3 (product_3_price) using similar SQL expressions as in the above example.
Result: arameters in TURBOARD are enclosed in both asterisks (*) and double quotes ("**) within the SQL expressions to enable substituting these values dynamically based on user input. These expressions are integrated as filters into a dashboard that allows users to adjust the price parameters for each product (Product 1, Product 2, and Product 3). The dashboard dynamically calculates and displays the predicted profit or loss based on the price changes. Each expression provides the expected profit or loss for the specific product, and the overall profit can be further calculated by summing the results.
Purpose of the Coefficients: The coefficients in the expression (0.94349684, 3.22416552, and -2.96978897) represent the impact of each product's price on overall profit. These coefficients were derived from an AI-based predictive model, indicating how sensitive the profit is to changes in each product’s price. The higher the coefficient value, the greater the impact on profit. A positive coefficient means that increasing the product price will increase profit, while a negative coefficient means that increasing the price will reduce profit.Check out this dashboard to see a similar application for three different products and their price simulations.
Note
In TURBOARD, parameters used within SQL expressions must be enclosed in both asterisks (*) and double quotes ("). This indicates that the value will be dynamically substituted based on user input for the dashboard filter. For example, when referencing a parameter like IncomeIncrease, it should be written as "IncomeIncrease" in the SQL query. This allows TURBOARD to recognize and replace the parameter with the appropriate user-defined value during query execution.
How to Define a New Parameter?
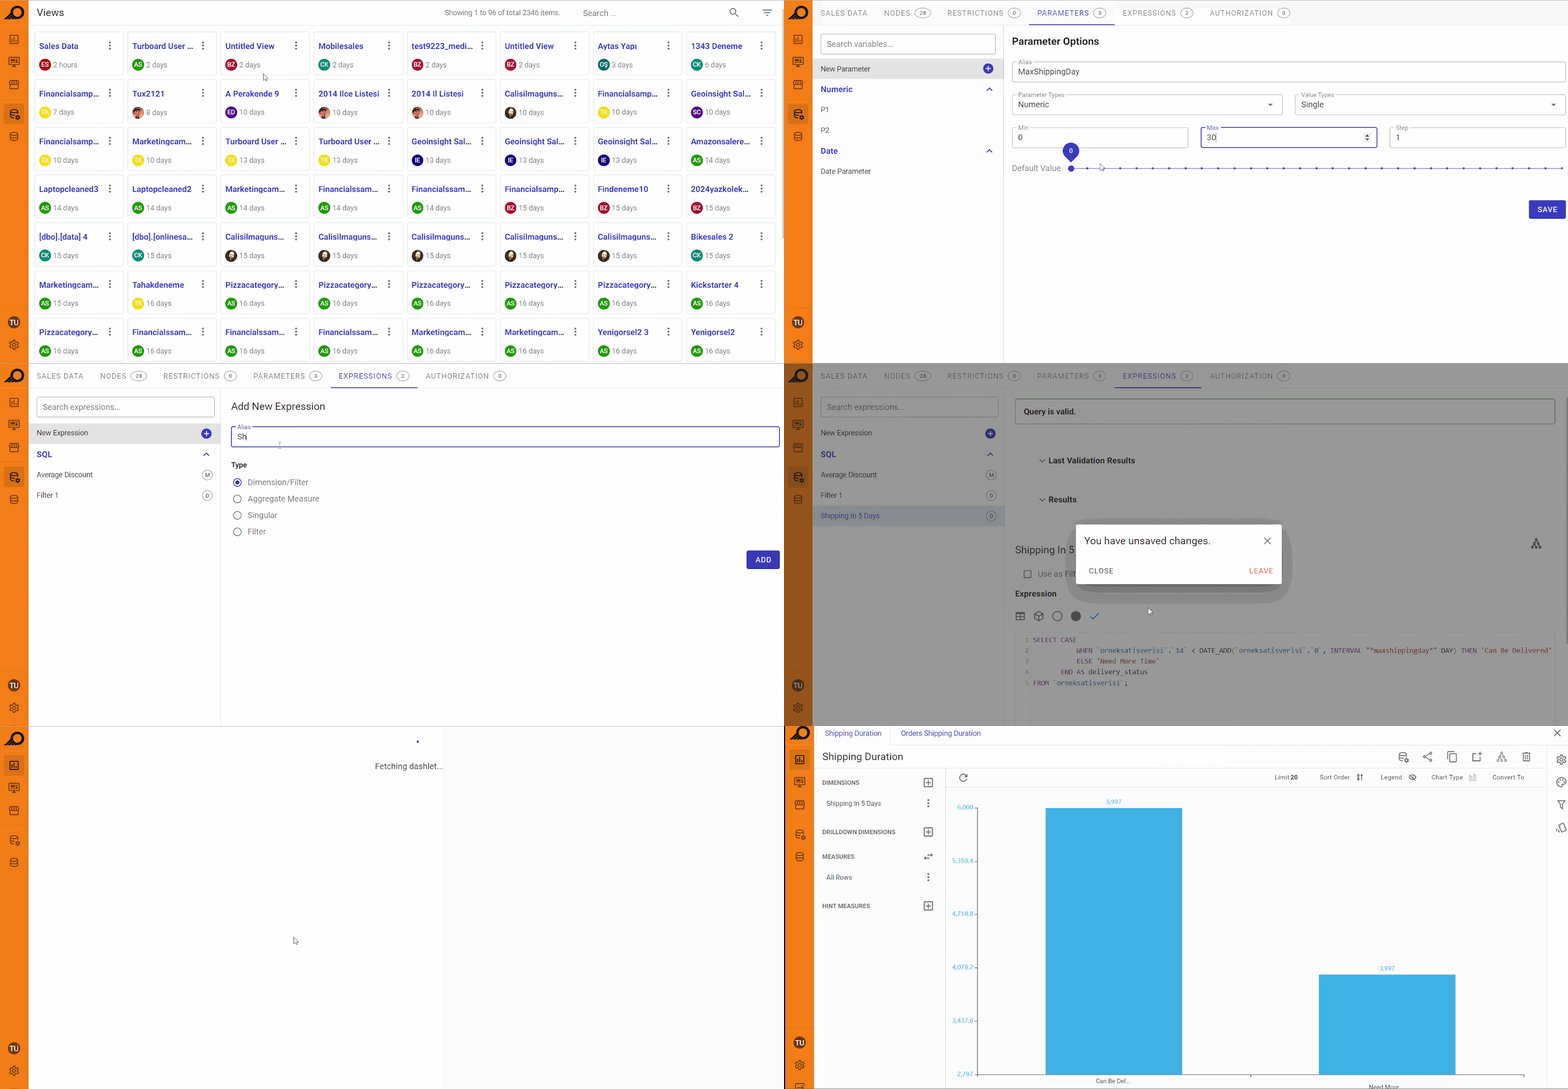
1 Navigate to the “Parameters” tab, and click on the New Parameter + option. A side window will open.
2 Define the new parameter options as below:
-
Parameter Alias: Enter a name for your parameter in the text field.
-
Parameter Type: Select the type from the drop-down list (String, Date, Date & Time, Numeric).
-
Value Type: Choose whether the parameter allows for a single or multiple values.
-
Default Value: Set a default value for the parameter.
3 Once all options are defined, click the SAVE button to create the parameter.
4 After defining the parameter, navigate to the “Expressions” tab, and use the new parameter as required in your SQL queries or calculations.
Expressions in Views
Expressions Tab
Expressions are the virtual dimensions or measures created using SQL to allow for more detailed analysis. They liberate designers from the limitations of database fields and open the door to new insights. Once created, expressions can be used in any dashlet where this view is applied.
It is crucial to understand when to use expressions and their practical use cases. By effectively utilizing expressions in TURBOARD, users can unlock deeper insights and create more powerful, interactive, and insightful dashboards that drive informed decision-making across the organization.
When to Use Expressions
-
Creating New Metrics: When you need to calculate new fields based on existing data. For example, creating a ‘DiscountedPrice’ field by subtracting the ‘DiscountAmount’ from the ‘ListPrice’.
-
Data Categorization: When you need to categorize data based on certain conditions. For instance, creating a ‘SalesCategory’ based on the quantity sold.
-
Advanced Aggregations: When you need to perform complex aggregations that are not directly available in the data source. For instance, you can create an expression to calculate the age by subtracting the birth date from the current date, or calculate the ratio of sales amounts for each store in relation to the total sales for the region that store belongs to.
-
Data Transformation: When you need to transform data into a different format or structure for analysis. For example, converting a date field into a specific format or extracting parts of a string.
Benefits of Using Expressions
By using expressions, custom fields that do not exist in the original data source can be created as needed, tailored to specific analytical requirements.
Expressions reduce the need for repeated complex calculations at the dashlet level and simplify data management, especially if the same view will be used in several dashlets. They allow standardizing calculations across multiple dashlets, ensuring uniformity in data analysis.
Expressions enable deeper data analysis by creating complex metrics and categorizations that aren't possible with standard fields.
Types of Expressions
There are four types of expressions in TURBOARD:
-
Dimension Expressions: to create new dimensions for categorizing data.
-
Aggregate Measure Expressions: to perform aggregate calculations like SUM, AVG, COUNT.
-
Single Measure Expressions: to calculate individual measures without aggregation.
-
Filter Expressions: to create new filters and limit the data set based on specific criteria.
Dimension/Filter Expressions
A dimension expression returns the singular values of a field as a result. The type of “Case-When” queries are treated as dimension expressions. The dimension expression is combined with the measure or measure expression can be used together, and the query is grouped according to itself. The dimension expression can also be used as a filter through “Use as Filter” check box.
When writing your query and since grouping is done automatically, GROUP BY is not written in the query. In addition, the ORDER BY statement cannot be used because the sorting process is set on the Dashlet.
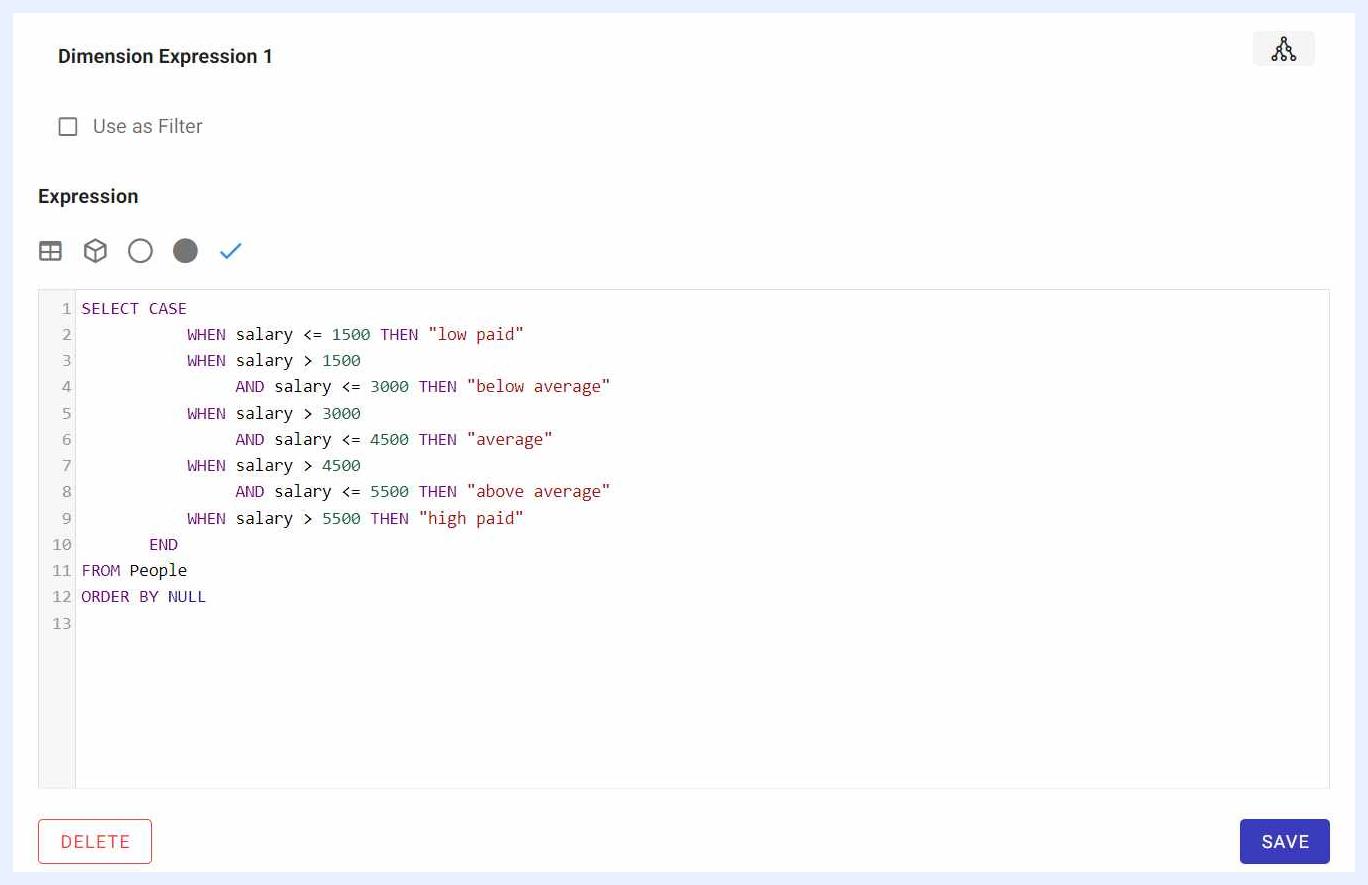
Dimension Expression
In the dimension expression above, we have gathered 4 main groups of people according to their BMI values.
Aggregate Measure Expressions
An aggregate measure expression returns an aggregated version of the measure field, which is then grouped by a dimension or another dimension expression. The measure expression must contain an aggregate function, otherwise the expression will not work.
The aggregate functions that can be used are AVG (mean), SUM (total), MIN (minimum), MAX (maximum), DISTINCT COUNT (number of individual rows), COUNT (number of rows), STDEV (Standard deviation), and VARIANCE (Variance).
For example, the expression in the image below subtracts the average of field1 to the average of field2 then rounds up.
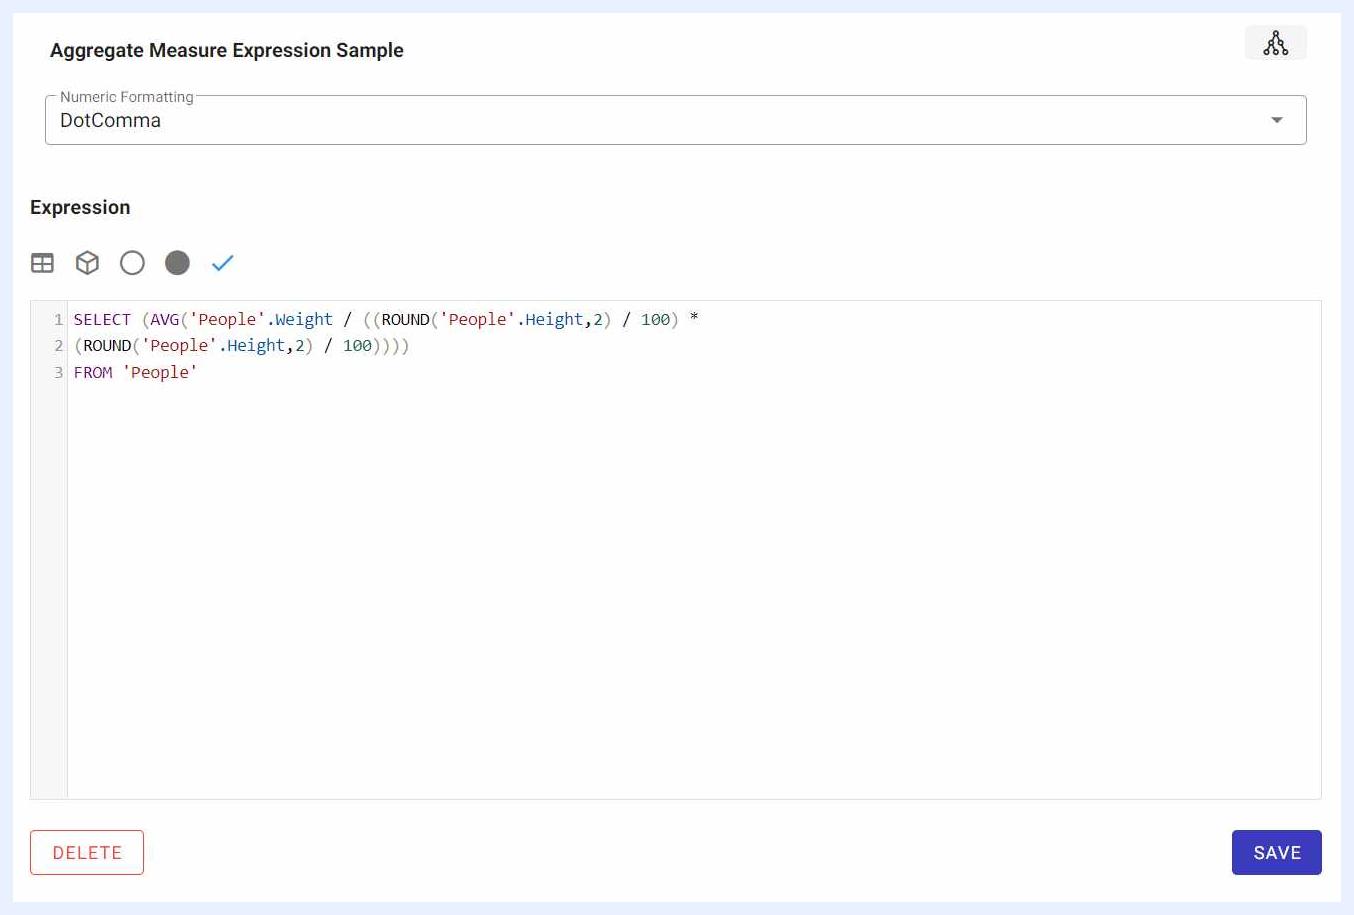
Aggregate Measure Expression
Singular Expressions
It is used to take the singular values of a measure or a mathematical operation between measures. Clustering functions are not used in these expressions, they are calculated separately for each row.
For example, finding the body mass index for each person on a table containing the height and weight information of the person is done with this type of expression. As with measure expressions, the terms GROUP BY or ORDER BY are not used.
In the expression example above, the BMI values of each person were subtracted.
Filters Expressions
If the original dataset is different in its nature, the admin user here can allow end-users to filter according to the determined expressions in this option.
For example, if a dataset of people consists of salaries and heights, the salary and the height are numerical fields with nominal values. If we prefer that the end-user searches/filters as “short, middle, tall”, then a filter expression may be created with a “case when ... then .... else ... end” SQL.
Expressions As Measures vs. Calculated Measures in Dashlets
Although expressions allow applying customized calculations using SQL queries for measures on the view level, designer users can also apply such calculations on a dashlet level using Pandas functions in TURBOARD.
Practical Differences
Expressions in views are broader in scope and can be reused across multiple dashlets, whereas calculated measures are specific to the dashlet in which they are created.
Expressions can handle more complex pre-processing and standardization needs, while calculated measures are better suited for simpler, on-the-fly calculations.
Calculated measures utilize the Pandas library to perform calculations directly within the dashlet interface without querying the database. This enhances performance by shifting computational tasks from the database server to the client’s interface, resulting in a more responsive dashboard. Hence, it is advisable to use calculated measures at the dashlet level whenever possible.
Creating Expressions
How to create an expression?
1 Go to Views “Edit” mode > go to “Expressions” tab > click New Expression + button.
2 Write your expression name in “Alias” field.
3 Choose the expression type that you need to create from the below options:
-
Dimension/Filter: to create a dimension,
-
Aggregate Measure: to create a measure,
-
Singular: to add something to Default Datacells,
-
Filter: to create a filter,
4 Click ADD button then write your SQL query in “Expression” field. While writing the query, make sure that the node name is the same as the specified field name.
5 Click “Validate expression” ✓ icon to check if your query is correct, or alternatively, you can click SAVE button.
Minimizing Errors When Creating SQL Expressions
When creating expressions in the SQL querying window, TURBOARD provides several user-friendly features to minimize errors and streamline the process. These features are accessible through icons located at the top-left corner of the SQL editor window, each designed to assist users with building correct and efficient queries. Below is an explanation of these features:
 Table Icon:
This icon allows users to access a list of tables available in the current view. By clicking on this icon, users can select the appropriate table, and TURBOARD will automatically insert the selected table name into the SQL query. This helps avoid errors related to table names and ensures the correct structure is used.
 Nodes Icon:
Nodes represent the fields or columns in the selected table. Clicking the “Nodes” icon opens a list of all available fields within the relevant view’s tables. Users can click on the desired field, and it will be automatically inserted into the query, ensuring that field names are spelled correctly and reducing syntax errors.
 Parameters Icon:
This icon provides a list of user-defined parameters associated with the current view. When a parameter is selected from this list, TURBOARD automatically places it between asterisks and double quotes, like this: "ParameterName". This ensures that the parameter is correctly formatted for dynamic substitution based on user input, enabling flexibility in filtering and analyzing data.
 Pre-defined Variables Icon:
Pre-defined variables represent common variables or values that are frequently used across dashboards or views, such as date ranges or user-specific data. By clicking this icon, users can easily insert these variables into their queries, avoiding the need to manually type them each time.
 Validate Expression Icon:
Once the query is written, users can click on the “Validate Expression” icon (a checkmark) to ensure the syntax and logic of the expression are correct. This validation process checks for common SQL errors and confirms that the query can run successfully before saving it. If there are errors, feedback is provided to guide the user in making corrections.
By using these tools, users can minimize the risk of errors while building SQL queries and make the process more efficient, especially when working with complex expressions or large datasets.