System Administration
Introduction
The “Administration” option in TURBOARD is only available to users with Admin permissions (Super Admin Users).
From TURBOARD’s main sidebar navigation menu > Administration option, the super admin user can apply configurations, settings and determine preferences to control how TURBOARD platform shall generally work and look like, such as the general layouts (logos, themes), users’ permissions, system configuration settings.
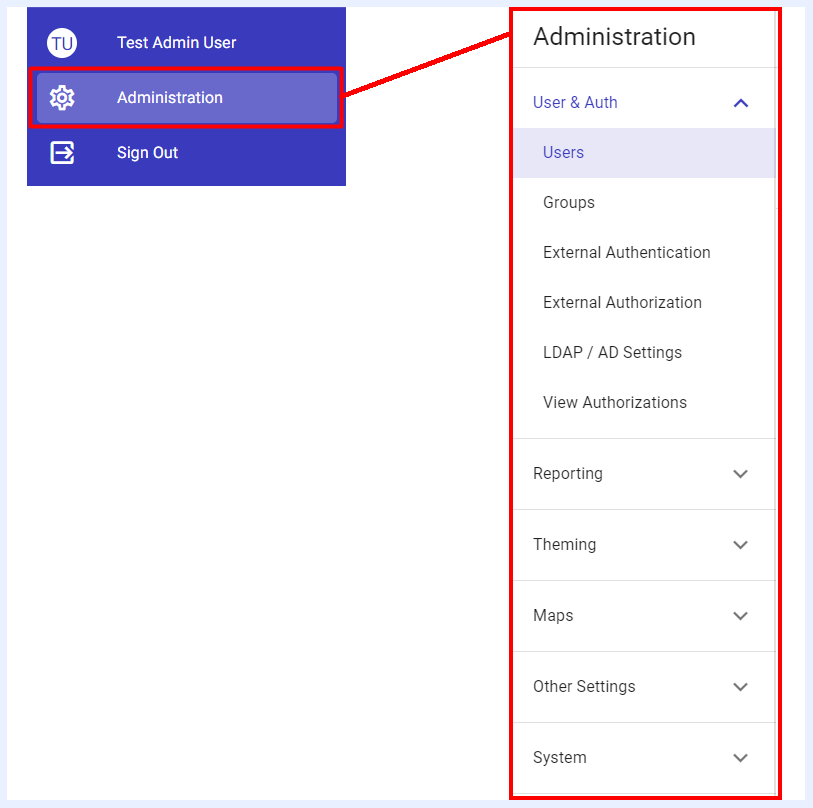
User & Auth
Under this section, TURBOARD users are added/edited, their permissions to apply the different actions in TURBOARD are determined, login credentials and other authentication and authorization settings are configured.
Users
This section allows the Admin user to add new users and give permissions, to edit existing users’ permission and configure user-related other details.
How to add a user in TURBOARD?
1 Go to Administration > User & Auth > Users > Click + Add a new user icon at the left-top.
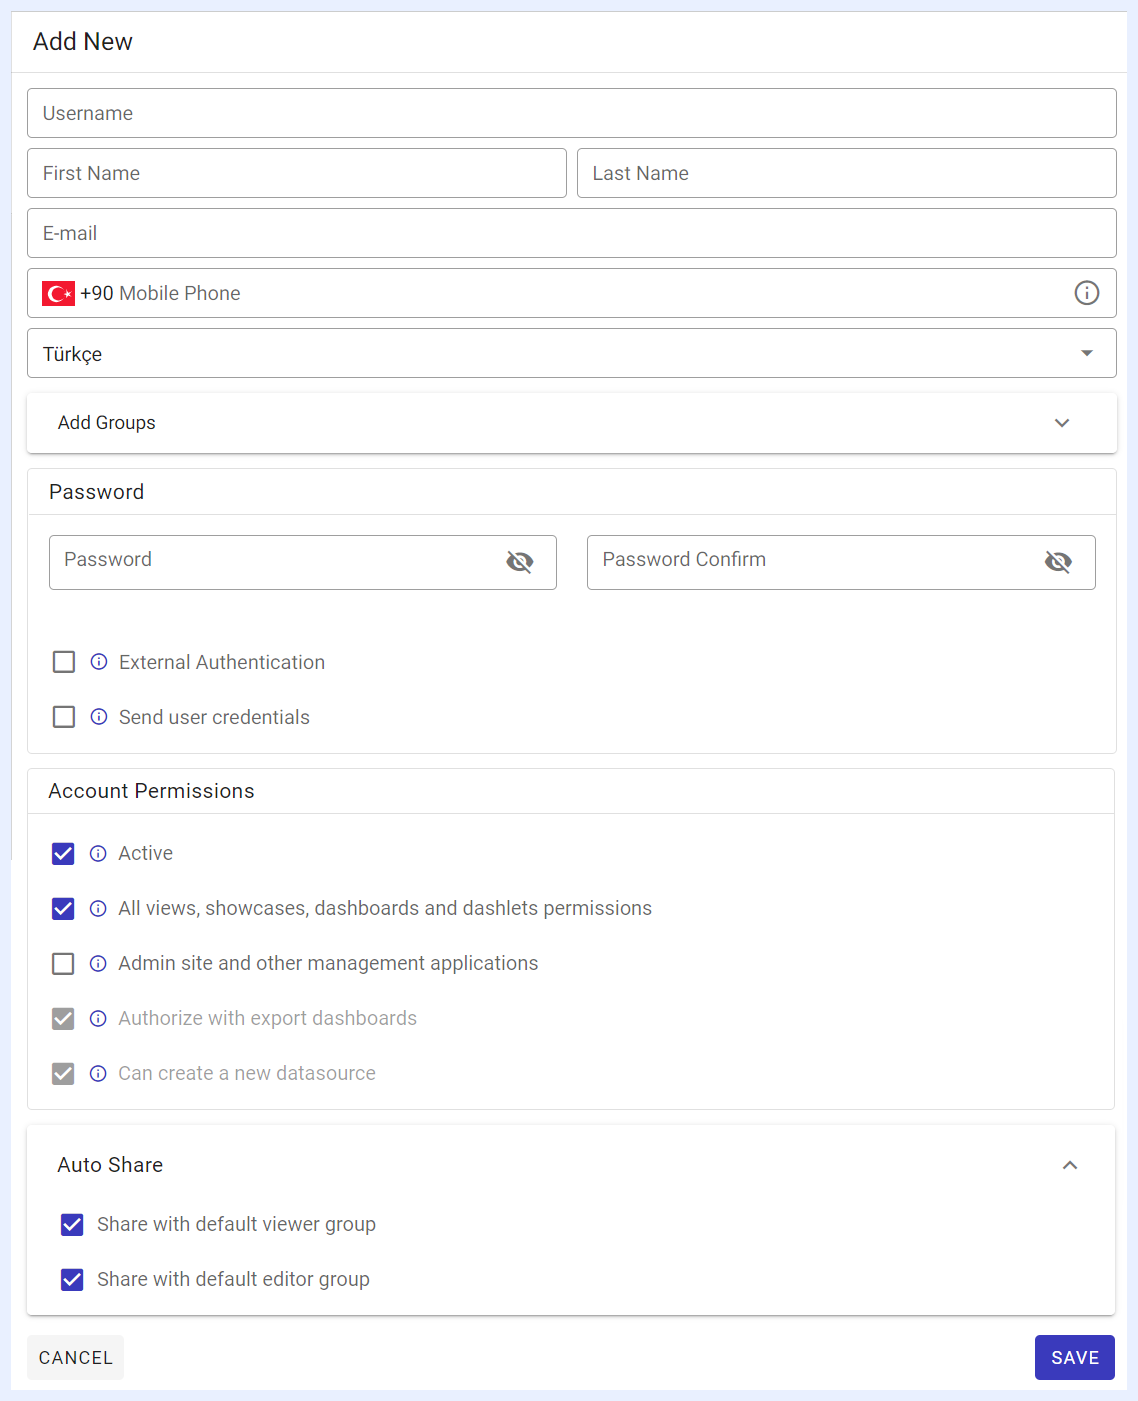
2 Fill User Login Fields:
-
Username: username to login to TURBOARD.
-
First Name, Last Name of the user.
-
E-mail: notifications and reports will be sent to the user via this e-mail address.
-
Mobile Phone: SMS notifications will be sent to the user on this number.
-
Select Language: TURBOARD’s default interface language that will appear to the user.
-
Add Groups: this option allows you to assign this user to a group of users by selecting the required group from the drop-down list. Groups can be configured and added in “Groups” section and will auto-appear in this field.
3 Enter Login Password and Credentials:
Password and Retype Password: if this user will login normally to TURBOARD via a manually determined password, fill these fields.
External authentication: this check box will be automatically checked for the users that are fetched and automatically added from an external system such as LDAP or Active Directory, or from an external table in the “Edit” mode for such users. These users’ login credentials will be the same as theirs in the external system/table. In this case, a manually generated password or auto-generated credentials are not needed and those fields are disabled.
Send user credentials: if checked, the login password and credentials will be auto-generated and sent to the user’s e-mail address. The user will receive a link to reset the password within 24 hours’ time window.
Note
»If users will be fetched and authorized from an LDAP or an Active Directory, it is configured in Administration > User & Auth > LDAP / AD Settings.
» If users will be fetched and authorized from an external table, it is configured in Administration > User & Auth > External Table Authentication.
4 Determine user/account permissions:
-
Active: checked by default. If unchecked, the login account will be inactive. This option can be used to deactivate users instead of deleting their accounts.
-
All views, showcases, dashboards and dashlets permissions: when unchecked, the user is a “Viewer User” only when showcases, dashboards and dashlets are shared with him/her. If checked, the user will have “Editor” permissions to add/edit/share views, showcases, dashboards and dashlets (Designer User).
-
Admin site and other management applications: check if the user is allowed to add/edit “Administration” settings (i.e. become a Super Admin User).
-
Authorize with export dashboards: check to give permission to the user to export dashboards (activates “Export” button for this user in dashboards).
-
Can create a new data source: check this box if the user is allowed to add/edit Data Sources.
5 Determine Auto Share permissions:
-
Share with default viewer group: checked by default to automatically share the dashlets, dashboards, showcases and/or performance cards that this user created with all “Viewer” users.
-
Share with default editor group: checked by default to automatically share the dashlets, dashboards, showcases and/or performance cards that this user created with all “Editor/Designer” users.
Note
If the check boxes for auto-sharing above are checked, their related groups will be automatically added to the “Share” feature for each element created/edited by the user and will appear as built-in default groups inside the “Share” window. This means that this user can use the “Share” feature that is available on the element level (dashlets, dashboards, showcases and/or performance cards) in order to: » share the element with other users than the users of these groups, » provide a public link/access to the element, » hide the element and revoke the auto-share from the default group(s).
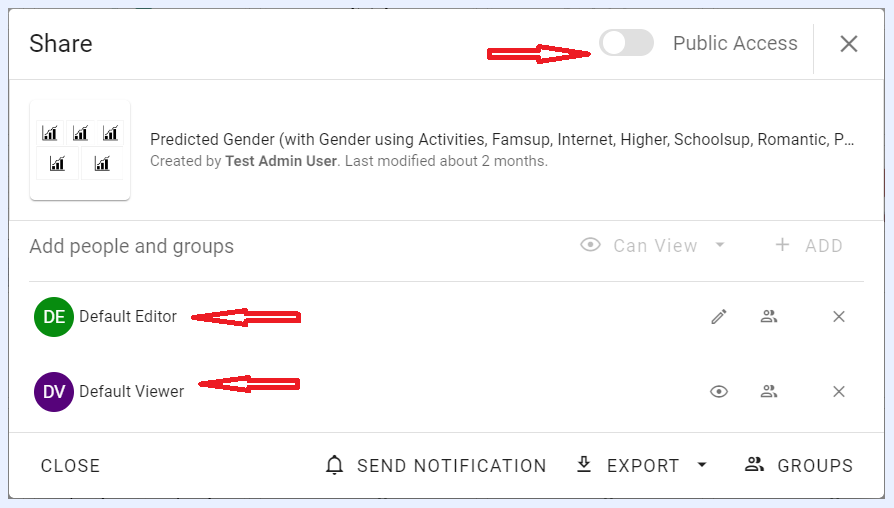
“Share” Window for a Dashlet Created by a User with Auto Share Permissions
6 Click SAVE button.
Note
Users can change/edit login details, password, interface language, auto-share options, deactivate e-mail and/or SMS notifications from “Edit Profile” section. Their permissions, however, can be granted and edited by a system “Super Admin User” only from this section.
Groups
From this section, the Super Admin user can create groups and add users to them in order to:
-
Give bulk permissions to export dashboards for all the users added to the same group,
-
Restrict the users under the same group to view certain default values of a selected node in dashboards.
-
Hide certain data from all the group users.
-
Share views, dashlets, dashboards and showcases whenever desired to the whole group of users instead of selecting each user separately.
How to add a user group in TURBOARD?
1 Go to Administration > User & Auth > Groups > Click + Add a new group icon.
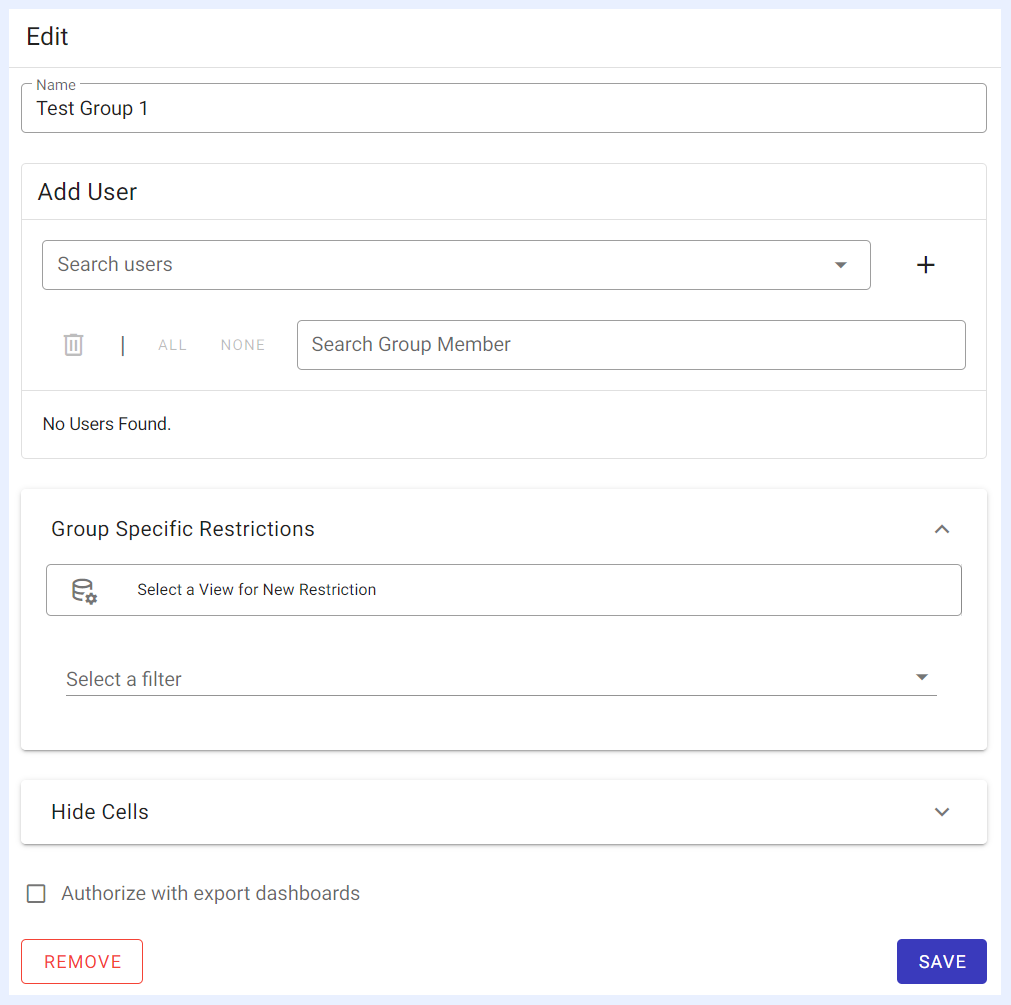
2 Give a name to the new group and click SAVE button.
3 Add users to the group and determine the required permissions and restrictions in the related fields.
Assets
Both the user and the group administration pages include an “Assets” section that provides a centralized inventory of every View, Dashlet, Dashboard, and Showcase shared with that user or group. For each asset, the exact permission level (Edit or View) is shown along with a direct shortcut link to the asset itself, making it straightforward to audit and manage what each user or group can access.
External Authentication
For corporations with thousands of BI users, creating/adding each user manually is inconvenient. Therefore, users can be automatically created in TURBOARD by fetching them and authenticating their login credentials from an external source table which can be an excel file or a table from your database. This means that TURBOARD will sync authorizations from other application databases without the need for manual effort. Users in this case can login to TURBOARD using the same credentials they use to login to their other business application.
Important
before proceeding with this section, make sure that the external data source where the table of your users is stored in is added/configured in TURBOARD’s data sources.
How to Configure External Authentication?
In this section, the Admin user configures the details for TURBOARD to connect to the external table of users as below:
1 Go to Administration > User & Auth > External Authentication.
Data Source: a drop-down list with the client’s data sources that are added/configured in TURBOARD in which the Admin user selects the data source where the table of users is located.
2 Fill the information in the window that opens as below:
-
Data Source: a drop-down list with the client’s data sources that are added/configured in TURBOARD in which the Admin user selects the data source where the table of users is located.
-
Table: a drop-down list with all the connected tables for the selected data source from which the Admin user selects the table where the users’ data exist.
-
Username, Email, First Name, Last Name, and Password fields: all the fields for the selected table will be automatically displayed as drop-down lists in these fields from which the Admin user selects the related fields.
-
Hash Type: a drop-down list with the types of password hashing algorithms that allows the Admin user to select the hashing type for password protection and authentication.
-
Salt Type: if an additional layer of security is added to the password hashing process, it can be selected from this drop-down list. If “field” is selected, the Admin user shall select the field name where the salt is stored in the table. If “text” is selected, the salt text shall be entered in its related field.
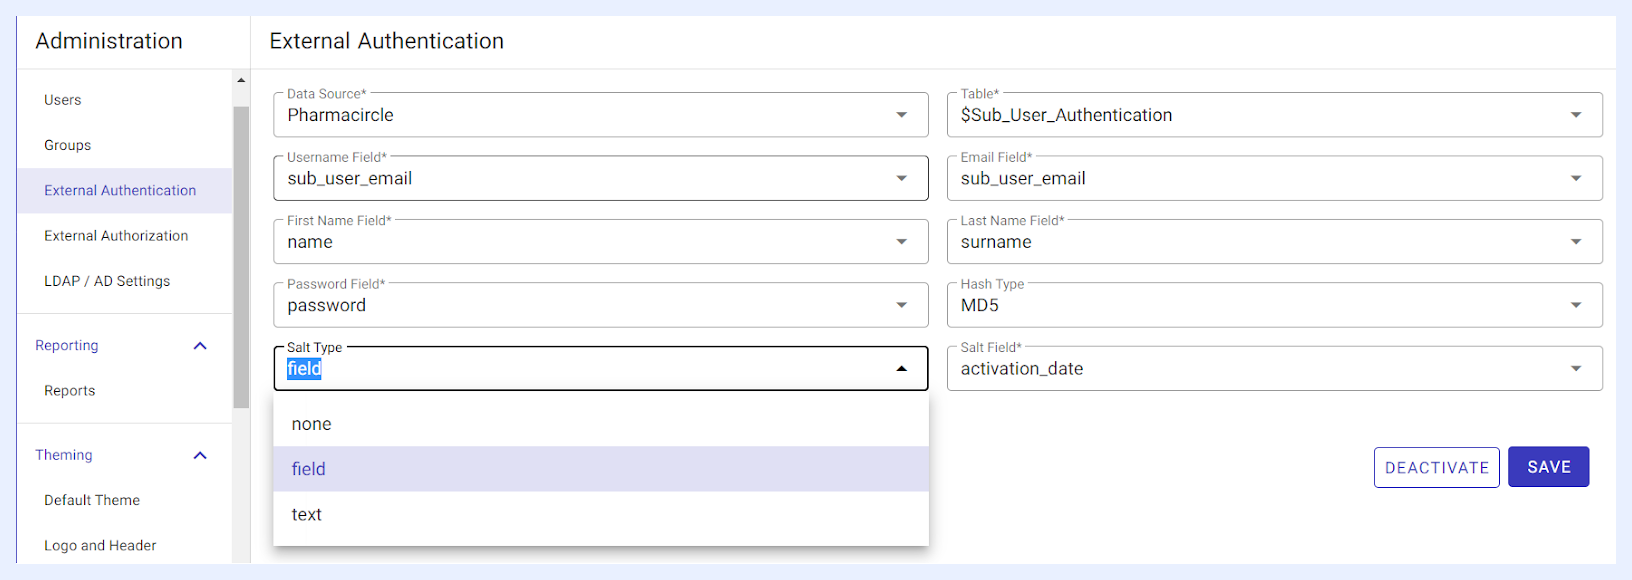
3 Click SAVE button.
4 Upon clicking SAVE button, the system will automatically create users from the related table and add them to “Users” list under “User & Auth” section:
All added users will have “Viewer User” authorizations and permissions by default. This is because “Viewer” users are the largest portion of BI users, while “Admin” and “Designer” users are usually just a few and can be added manually.
The added users will have “External authentication” check box automatically checked to indicate how they were added to the system.
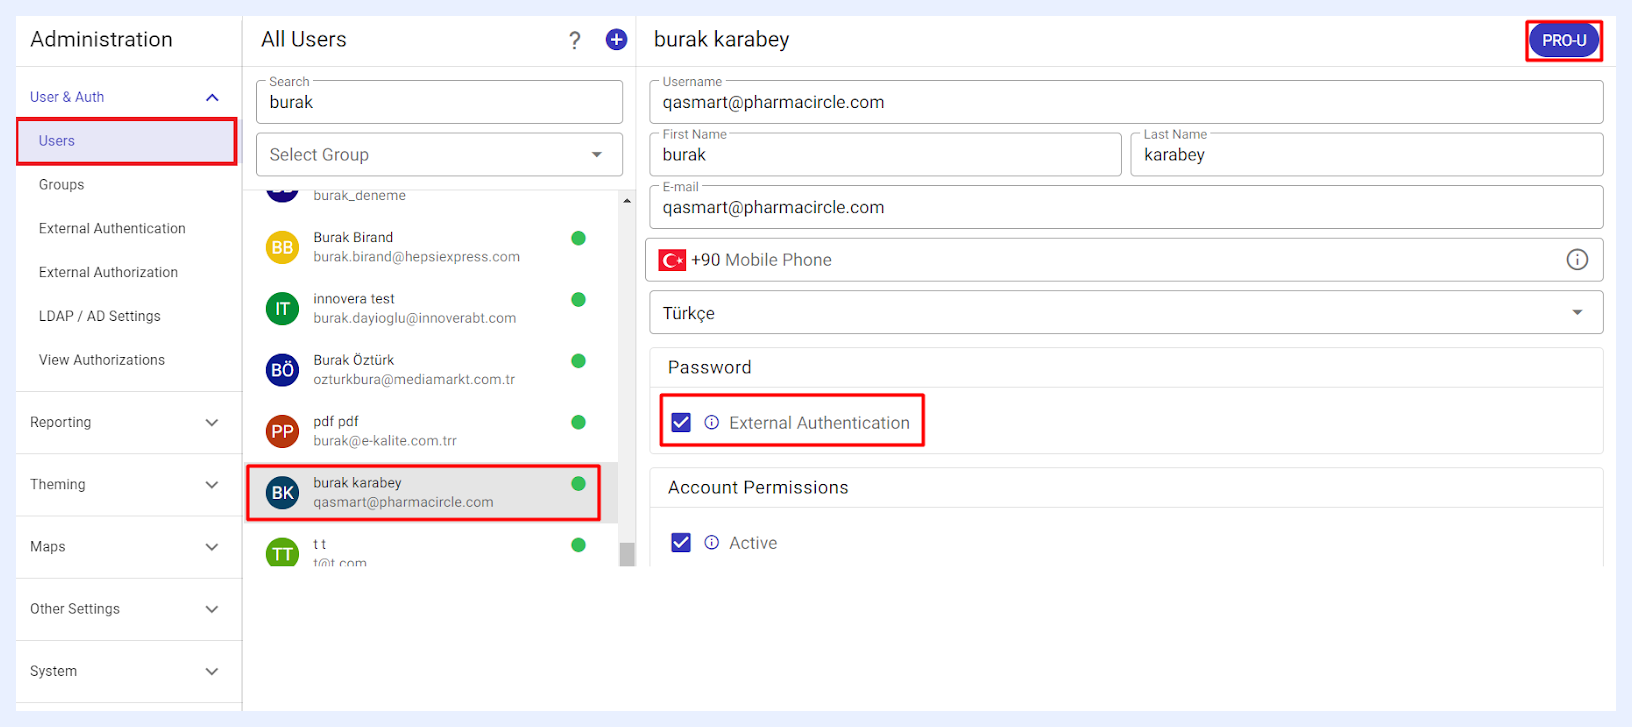
5 DEACTIVATE button: when clicked, it will disable login to TURBOARD for all users that were fetched from the external table. The Admin user can re-activate the authentication by clicking ACTIVATE button.
Note
when a new user is added to the external table any time later on and attempts to login to TURBOARD portal using the same credentials in that table, TURBOARD will automatically check all users from the external table and cross-refer to TURBOARD fetched users. If a new user is found in the table, it will be fetched and added as a new TURBOARD user automatically.
External Authorization
In TURBOARD, you can customize the granted permissions/authorizations for users on group level. However, if the users are categorized into several groups, with hundreds or thousands of users in each group, adding them manually to their related group is inconvenient. Therefore, the Admin user can define and determine each group’s permissions in “User & Auth/Groups” section, then add their users from this section automatically from an external table.
As an example, a TURBOARD client may have its BI users divided into several categories where each category has specific data to view on TURBOARD different from others such as:
Top management users who may need to view certain dashboards/showcases different than other departments,
Financial or accounting department users who may need to view specific financial data and analysis,
The business clients who may need to be restricted from viewing sensitive data.
If you have your users listed with their group name/category on your database or an excel file, you can easily add them to TURBOARD User Groups by fetching them automatically from the relevant external table/sheet through this screen.
Important
before proceeding with this section make sure that the external data source where the table of your users and their groups is stored in is added/configured in TURBOARD’s data sources.
Adding Users to Groups from an External Table
How to add users to external groups from an external table?
1 Go to Administration > User & Auth > External Authorization.
2 Check “Enable external table authorization” check box.
3 Provide the information of the external table that TURBOARD will connect to in order to fetch its users in the related fields as below:
-
Data Source: a drop-down list with the client’s data sources that are added/configured in TURBOARD in which the Admin user selects the data source where the table of users is located.
-
Table: a drop-down list with all the connected tables for the selected data source from which the Admin user selects the table where the users’ data exist.
Note
make sure to set a “Primary Key” for the column that uniquely identifies your users in the table (in data sources settings). This ensures avoiding inconsistency, efficient data retrieval and preventing duplicate rows. If the selected table does not have a primary key field, TURBOARD will notify you accordingly.
Username, Email, First Name, and Last Name fields: all the fields for the selected table will be automatically displayed as drop-down lists in these fields from which the Admin user selects the related fields.
Synchronization frequency and time: if new users might be added to the external table every now and then and/or if the related group of some users may change in time, the Admin user selects the frequency and time for TURBOARD to reconnect to the external table and synchronize its users and groups with TURBOARD’s. This will eliminate the manual effort of adding new users to TURBOARD groups as they will be added/updated automatically according to the selected synchronization frequency.
4 Click START SYNC button.
5 When the synchronization process is completed, it will be confirmed in “LastSyncLog”, “Sync Start Date” and “Sync End Date” sections.
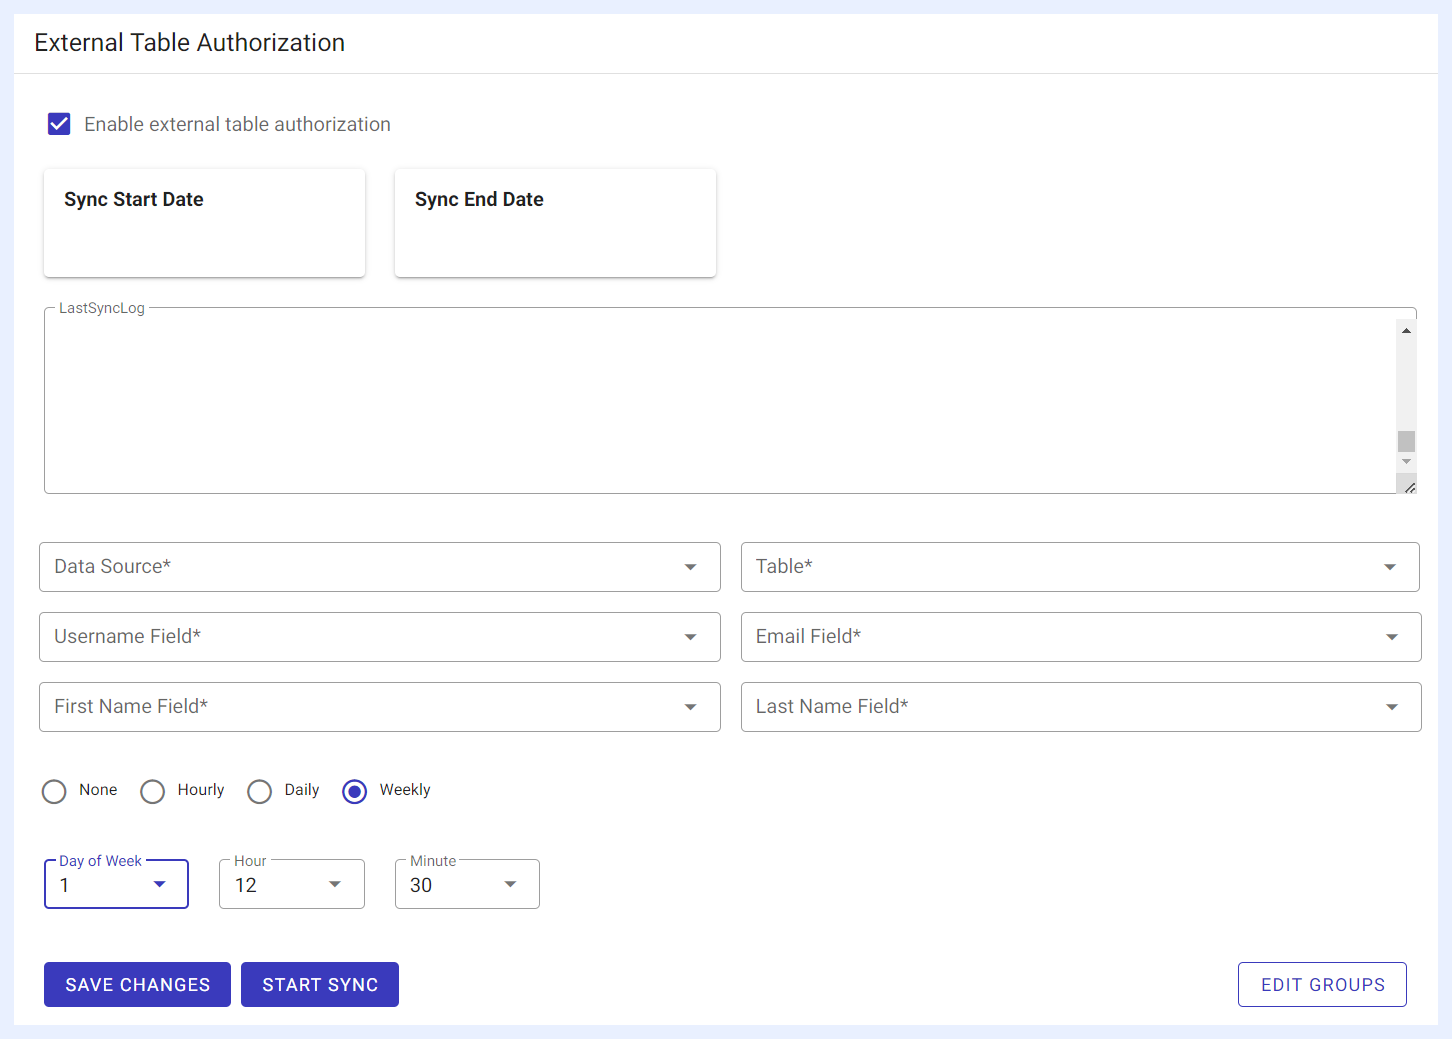
6 Once the synchronization process is completed, click EDIT GROUPS button.
7 Click + Add a new external group icon in the window that opens and give a name to the group that you want to add specific users to from the external table (Manager Users for example).
8 Connect the new group to the required users in the external table. Select the field(s) and value(s) from the table fields’ drop down menu in “External Table Filter”. The system will filter the users and add those to the group according to your selection here. Use the + button to filter as many users as needed.
9 Determine the data restrictions for this group. You can restrict its users from node(s) and/or field(s) within any view. Use the + button to add as many restrictions as needed.
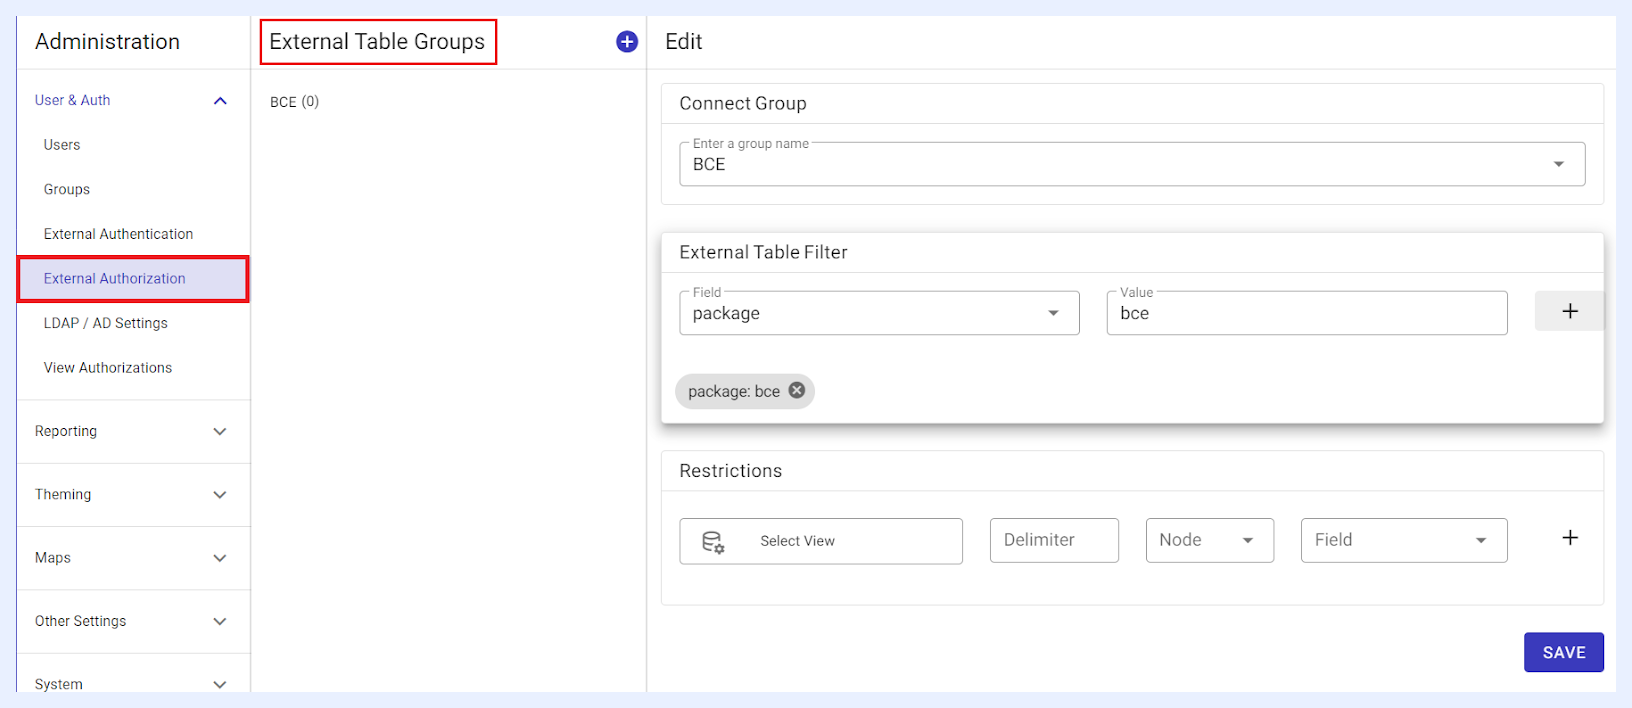
10 Click SAVE button, then click External Authorization under Administration menu to go back to the main window. Click START SYNC button again.
11 Once the synchronization process is completed, TURBOARD will automatically fetch all users from the external table according to the determined filtering criterion/criteria above and will automatically add them as a TURBOARD Group under Administration > User & Auth > Groups. Additionally, any new users that are added to the external table will be added automatically according to the determined synchronization frequency/interval.
Note
When a user from the external group attempts to login to TURBOARD for the first time, the system will:
» Automatically check all users from the external table and cross-refer to TURBOARD fetched users,
» Add the user to TURBOARD users under Administration > User & Auth > Users.
LDAP / AD Settings
Users can login to TURBOARD application with LDAP and Active Directory, one of the most commonly used login methods.
Logging into TURBOARD using AD configuration means that the system will authenticate the user's credentials against an Active Directory domain, allowing for secure and centralized management of user accounts and integration with other Microsoft products. Logging using LDAP configuration means that the system will authenticate the user's credentials against an LDAP directory, allowing for secure and centralized management of user accounts from the same directory.
Configuring LDAP/AD Login for TURBOARD Users
How to configure TURBOARD users’ login from an LDAP or AD directory?
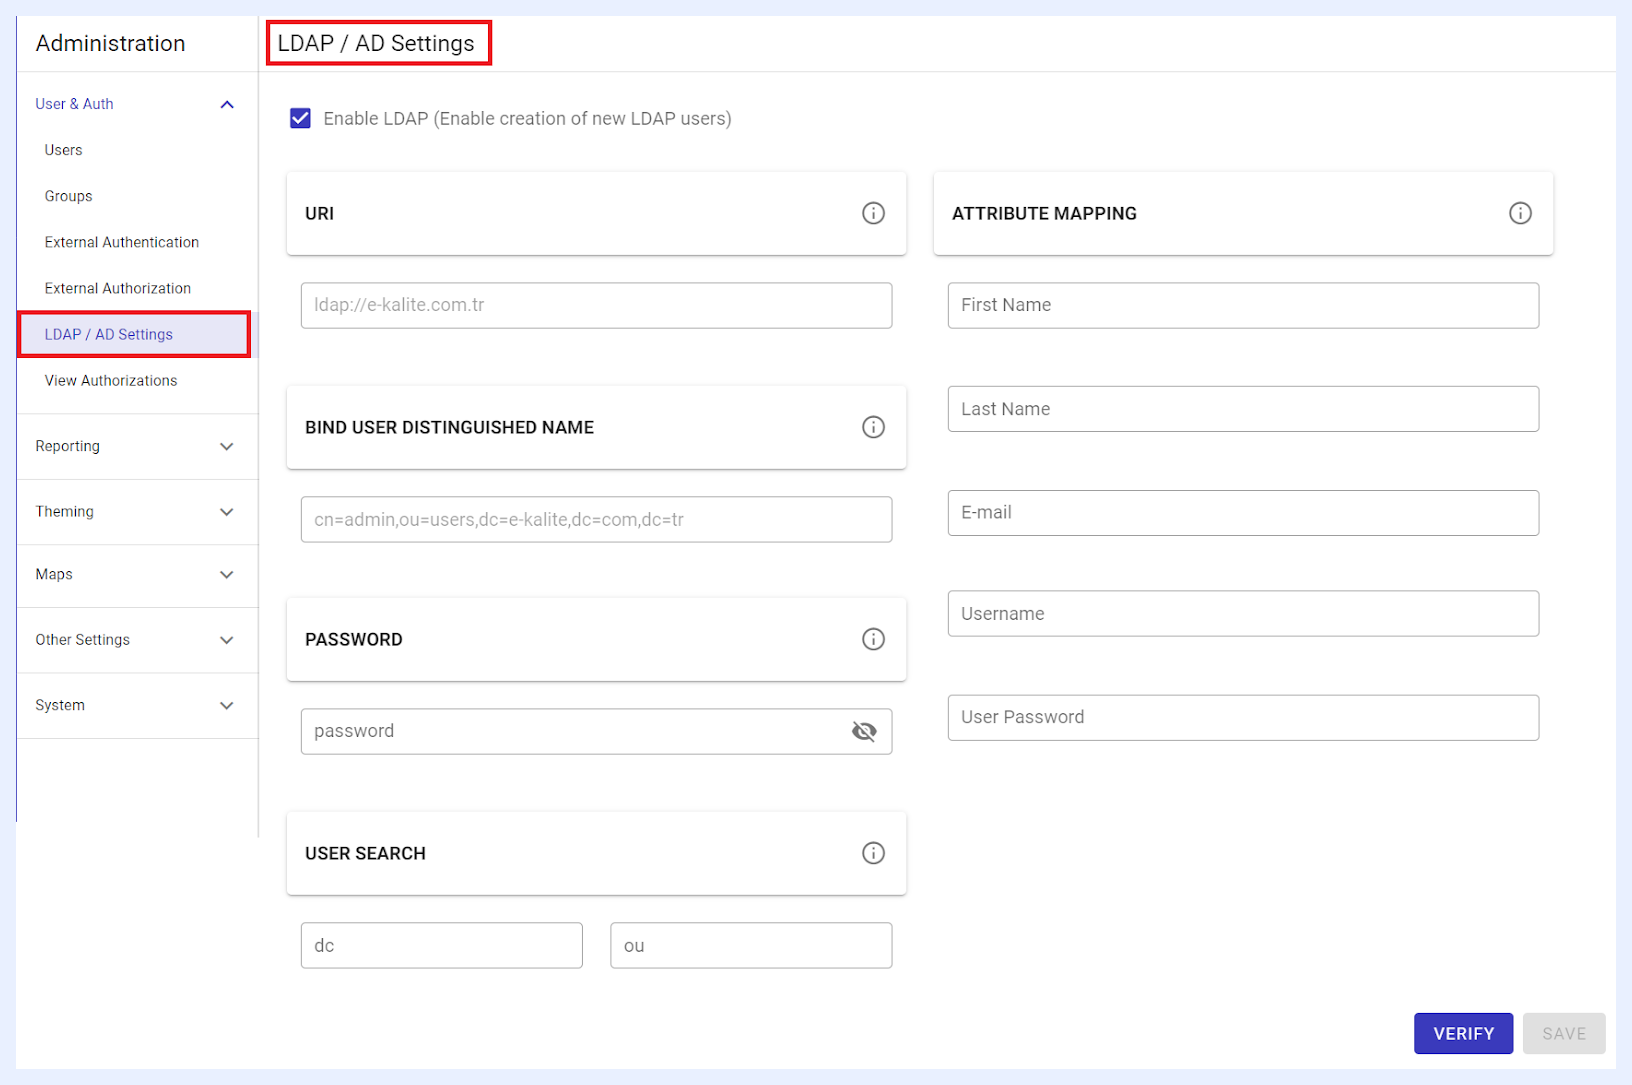
1 Go to Administration > User & Auth > LDAP / AD Settings.
2 Check “Enable LDAP (Enable creation of new LDAP users)” check box.
3 Enter LDAP/AD connection details in the related fields as below:
-
URI: Enter the LDAP/AD server’s Uniform Resource Identifier. For example, (ldap://e-kalite.com.tr).
-
BIND USER DISTINGUISHED NAME: Enter the full distinguished name of the bind user, such as (cn=admin,ou=users,dc=e-kalite,dc=com,dc=tr).
-
PASSWORD: Provide the bind user's password for authentication purposes.
-
USER SEARCH: Specify the search base for user authentication. There are two fields here: the field labeled as “dc” should contain the domain components. For instance, (dc=e-kalite,dc=com,dc=tr).
-
The field with the tooltip “ou” stands for “Organizational Unit” and should be filled with the relevant OU details.
-
ATTRIBUTE MAPPING: Align LDAP attributes to corresponding TURBOARD user information fields. Assign LDAP fields to match TURBOARD’s requirements for First Name, Last Name, E-mail, Username, and User Password. Leave these fields blank if the LDAP server’s default attributes are to be used.
4 After completing these steps, click VERIFY button to confirm the configuration is correct and operational.
Note
When any of the LDAP/AD configured users successfully logs into TURBOARD for the first time, they will be automatically added as TURBOARD users and marked as “External Authentication” users.
Multi-Factor Authentication (MFA)
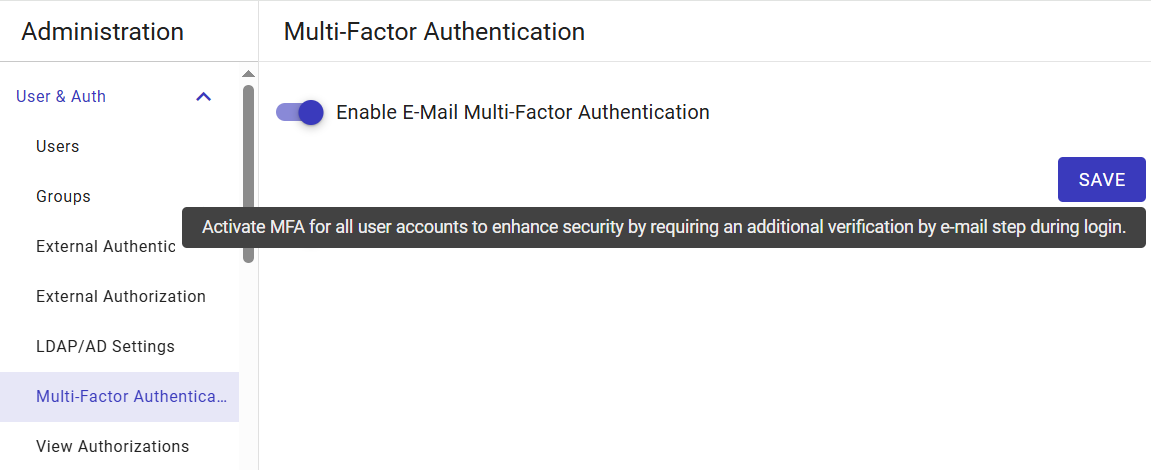
Administrators can enable Multi-Factor Authentication by e-mail for all users from Administration > User & Auth > MFA Settings (/admin/auth/mfasettings). Once enabled, after entering their credentials, users must also enter a one-time password (OTP) that is sent to their registered e-mail address before they can complete the login, adding an extra layer of account security.
View Authorizations
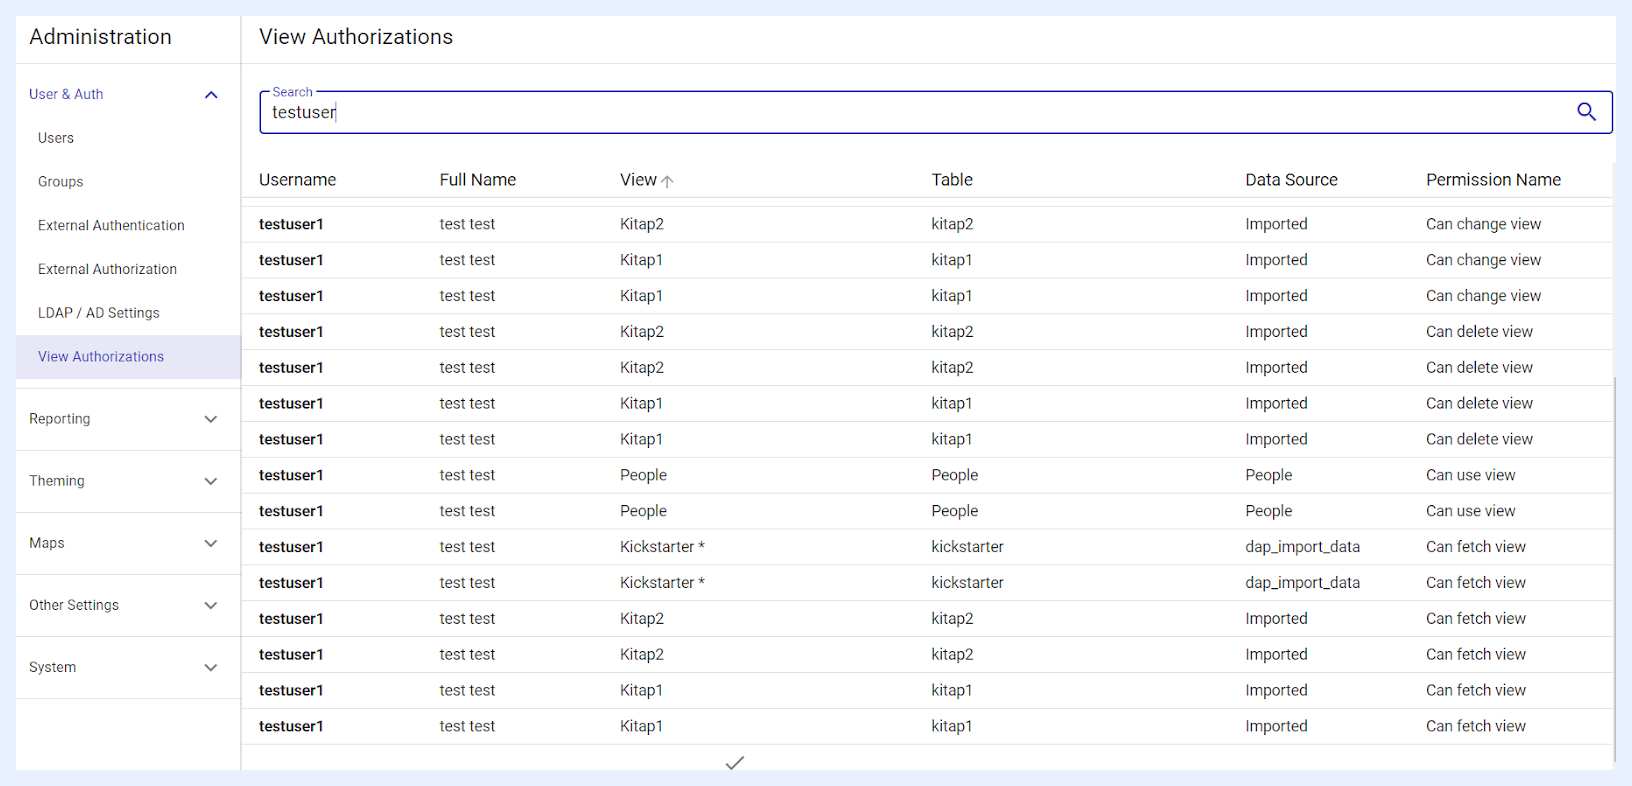
The View Authorizations window is a specialized interface for administrators to audit the permissions granted to users regarding the “Views” within TURBOARD. This section is essential for overseeing who has access to specific sets of data visualizations and analytics.
This window does not allow for the alteration of permissions but rather provides a comprehensive and transparent audit of who can interact with which Views and how, reflecting the structure and permissions set up through the View “Share” process.
The admin user can swiftly locate specific records using the search bar, which supports partial match searches for User Name, Full Name, View Name, and Table Name. This feature enhances the ability to quickly identify and audit user access rights.
Additionally, records can be efficiently organized as administrators have the option to sort the data by clicking on the respective column headers, arranging the audit trail in a preferred ascending or descending order. This sorting functionality applies to all columns, facilitating a tailored overview of user permissions within the Views.
Scheduled Jobs
Data Flows
Report Deliveries
Under this section, Super Admin users can send any required dashboard as an ad hoc report to be sent to TURBOARD users via their e-mails as an attached PDF file, and/or can configure auto-sent and/or custom reports to be sent similarly on a periodic basis.
How to set periodic reports in TURBOARD?
1 Go to Administration > Reporting > Reports > Click + Add a new report icon.
2 Click SELECT A DASHBOARD button and choose the dashboard that the report will be generated according to, then click ADD button. The dashboard will be automatically added as a periodic report. You can change the dashboard and/or open it at any time from the ellipsis.

3 If the selected dashboard has filters, you may select the filters and restrict the values in which the report will be sent according to their fetched data only from the related dashboard.
4 Add the recipients of the report by selecting the required users and/or group and clicking on them to be added automatically.
5 If the selected dashboard has Pivot table/s or detailed table/s, they will be added as tables in the attached PDF upon selecting “PDF (with tables)” radio button.
6 Click SEND button if this report is ad-hoc and you wish to send it immediately to the selected recipients.
7 OR click SAVE button and your report will be automatically added to the list of reports in their general view window.
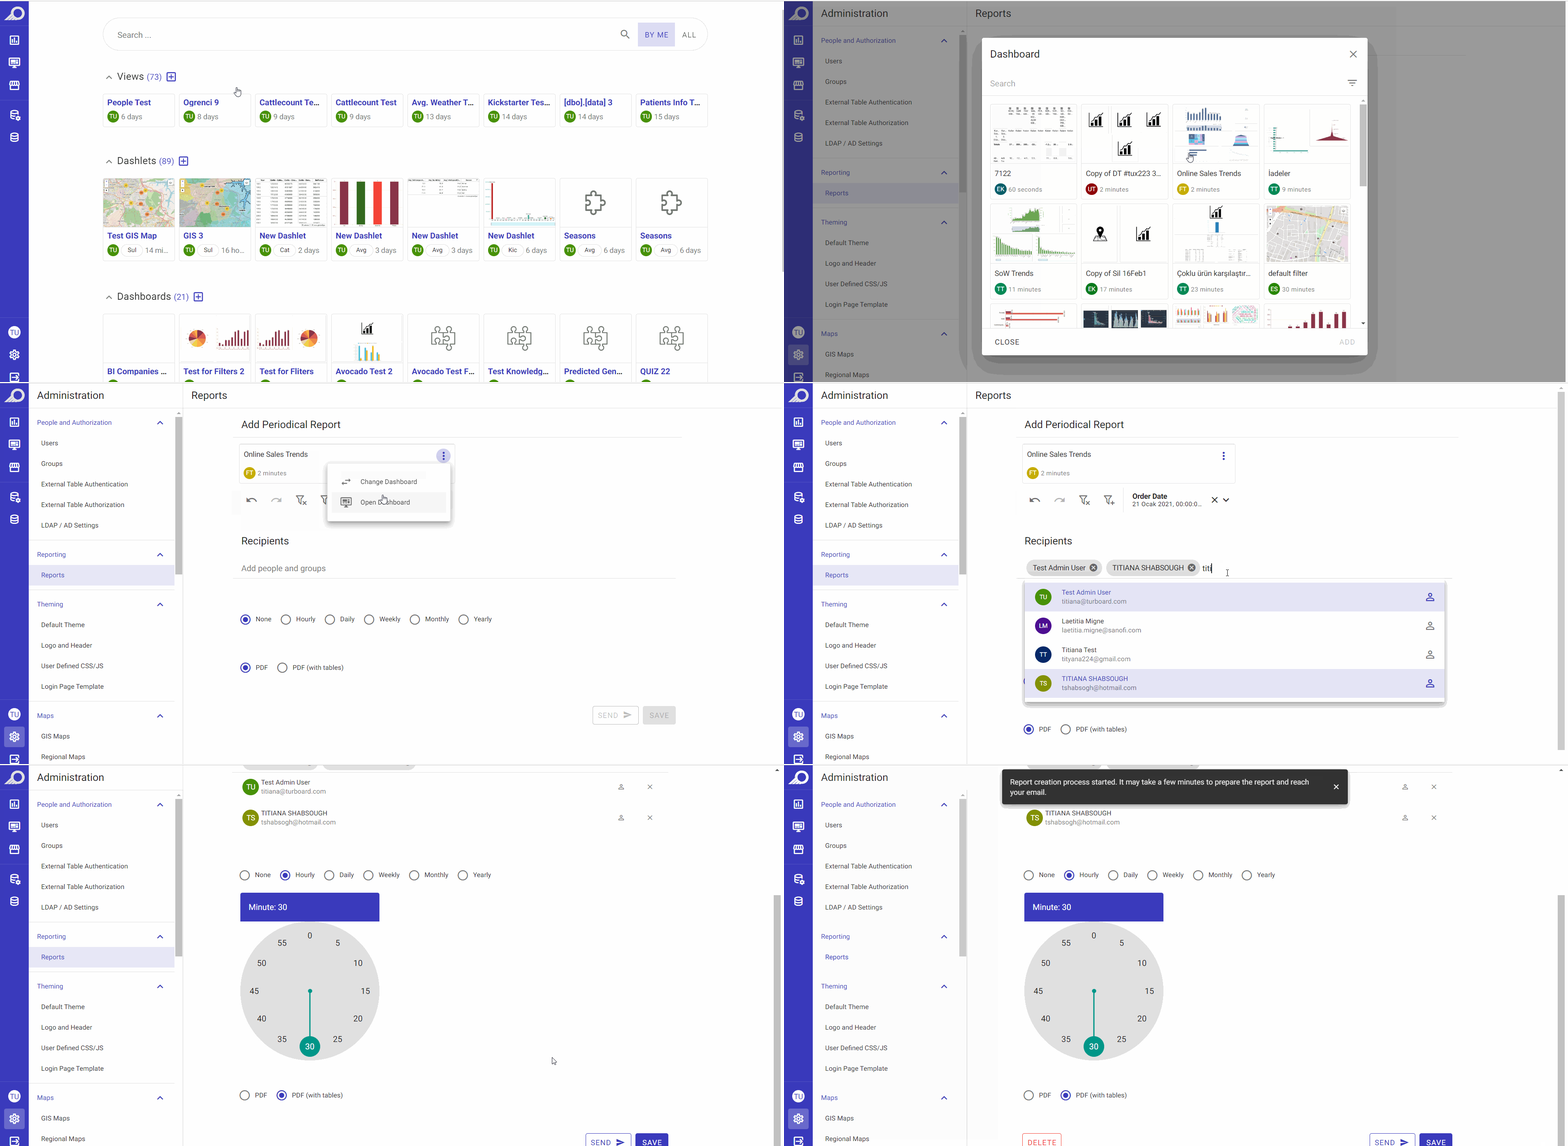
At any time, you can click on the Edit icon for the required report from the Reports list to open its “Edit” window so you can:
Change the report details, including setting its automatic sending frequency. Click SAVE button when done.
Send the report immediately to all its active recipients (regardless of the report’s automatic “Sending Frequency”).
View the report log and its events’ records.
Delete the report by clicking the REMOVE button.
Query Caching
Under this section, Admin users can set a schedule for the system cache and queries to be automatically renewed/refreshed from the data sources that TURBOARD is connected to. The queries that are actively used in TURBOARD will be checked and the cache will be refreshed according to the set date and time.
How to set a scheduled caching for TURBOARD?
1 Go to Administration > System > Caching.
2 Click + Add a new schedule icon, and fill the fields in the “Add” window that opens:
-
“All day” check box: if checked, the automatic refresh of the queries will take place on the whole day period for the selected day/s.
-
“Start hour/End hour” fields: 00:00 time format fields to determine the caching start and end times during the selected day/s.
-
“Days” field: a drop-down multi-select field to select the day/s on which the caching will be applied.
-
“Mode” radio buttons: select caching mode whether normal or aggressive. In “Aggressive” mode, the system will run 5 queries concurrently, while in “Normal” mode, it will run queries one after another. If the aggressive mode overlaps the normal one, the system will enable the aggressive mode.
3 Click SAVE button.
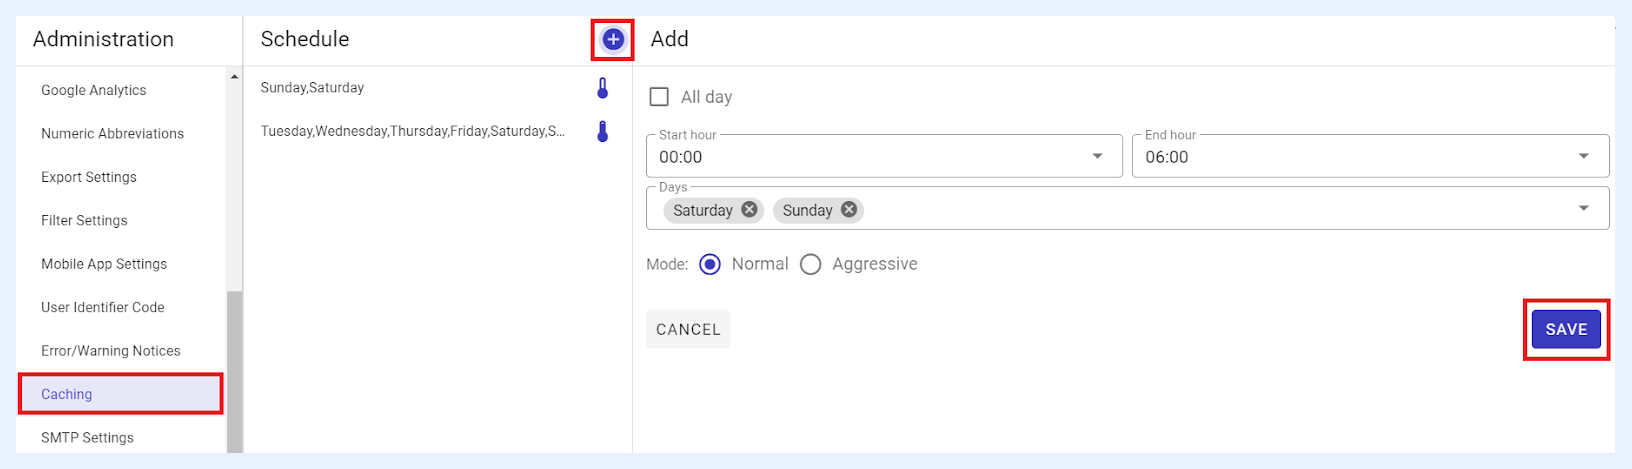
The caching schedule will be listed under “Schedule” list in which you may select and click it any time to edit its details and/or remove it as required.
Theming
Default Theme
You can set a default theme for TURBOARD visualizations by selecting the preferred color schemes and the general style from up to 45 themes available in this section.
How to set a default theme for TURBOARD visualizations?
1 Go to Administration > Theming > Default Theme.
2 Click on the theme of your preference from the available theme blocks.
3 A window will open showing how all the visualization types in TURBOARD will look like upon applying the selected theme.
4 Click SET AS DEFAULT button to apply the selected theme, or choose another theme from “THEME” drop-down menu to view its color schemes and general style again.
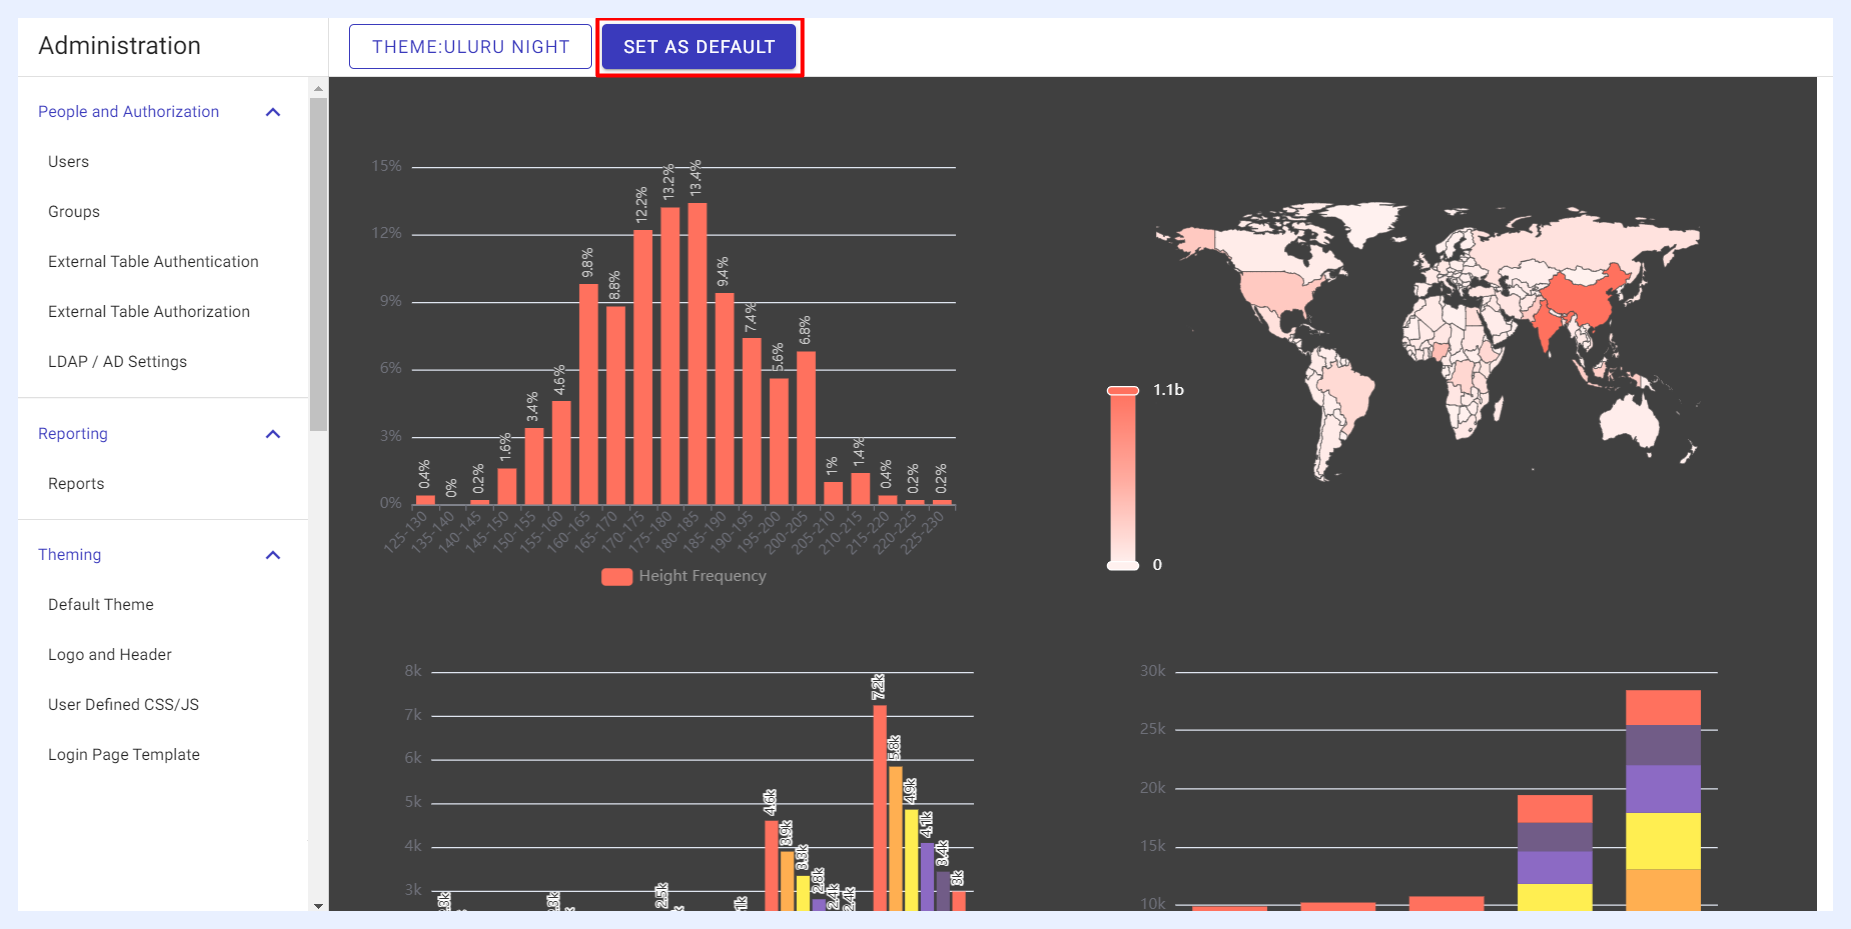
The chosen theme will be applied to all new visualizations in your TURBOARD environment, while existing ones will retain the previous default theme.
Note
While the chosen theme becomes the default for new visualizations in TURBOARD, designers have the flexibility to modify themes at the showcase level, and end-users can view their showcases using their preferred theme.
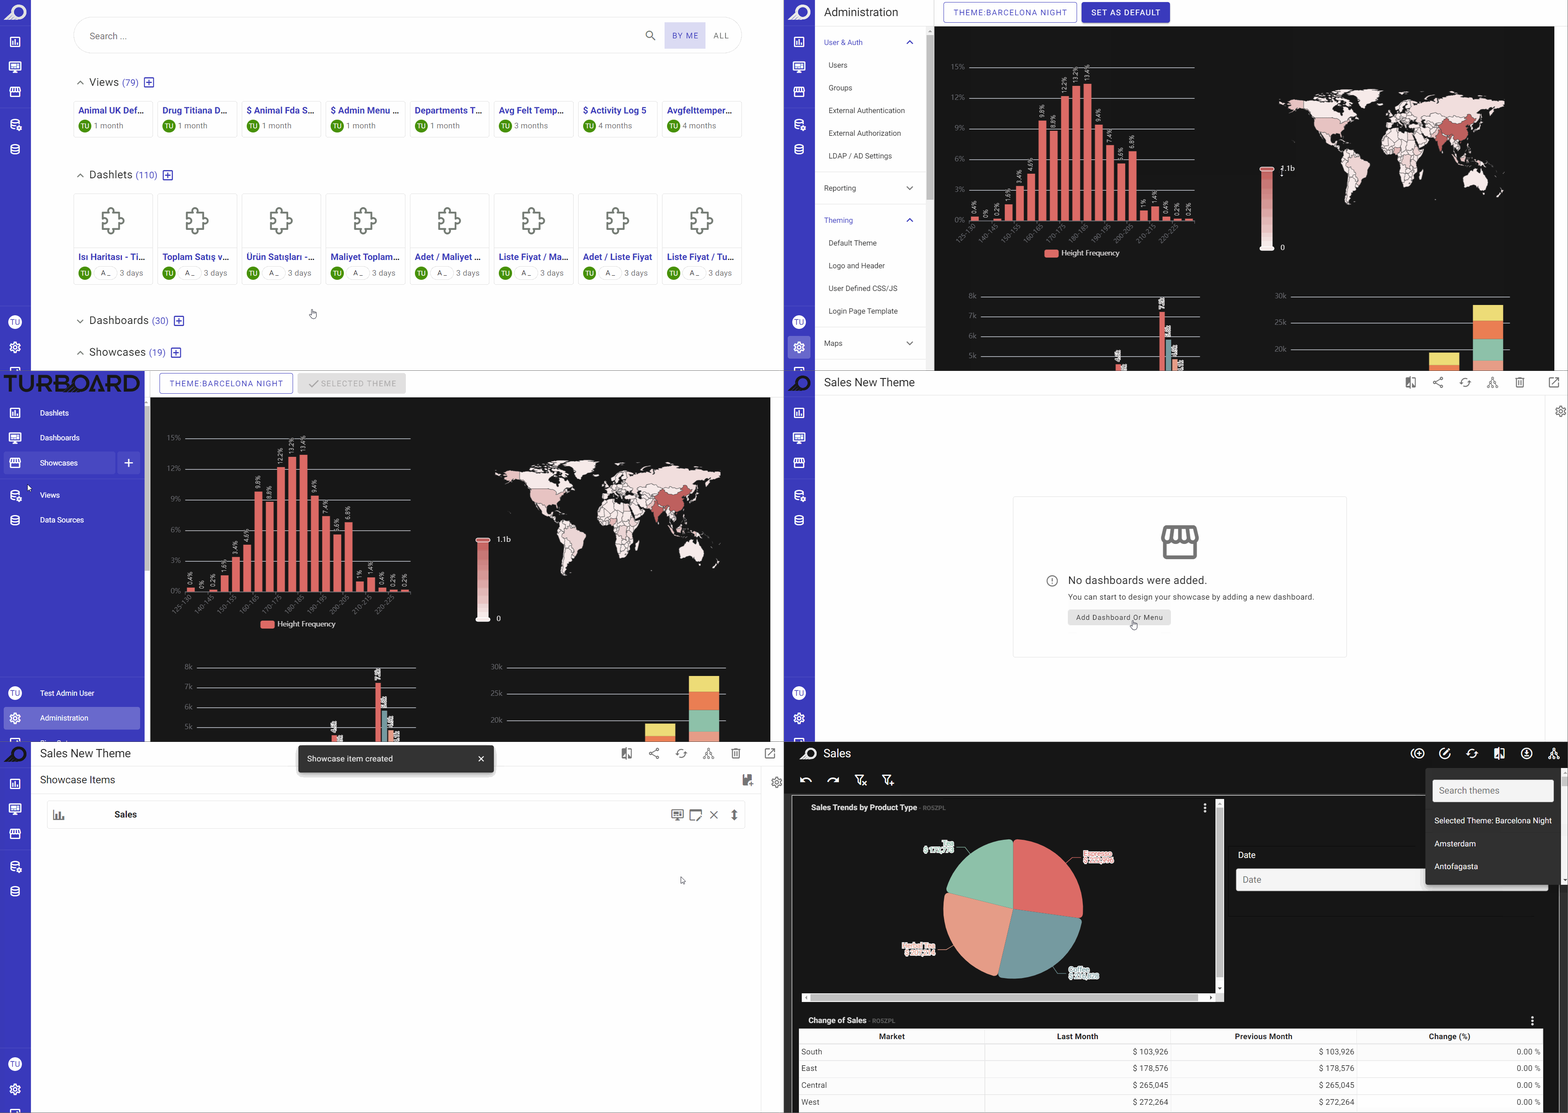
New Default Theme Applied on New Visualizations Created in TURBOARD
Logo Header and Color
Your company logo, tabs’ main title of TURBOARD webpages, logo-click hyperlink, your favicon and the logo on the printed reports, URL address bar, dark theme logos and mini logos, etc. can be customized under this option.
Note
make sure to have your logo files ready and prepared in advance, as you will only need to upload them in this window. Their preferred sizes are explained in their related fields. The preferred format for the files is (.svg). Although other image file formats (.png, .jpeg, etc.) can be uploaded, the highest resolution logo images are those of type .svg.
Setting Up Your Company Branding
How to set the logo(s) and branding of your company?
1 Go to Administration > Theming > Logo and Header.
2 In the window that opens on the right, select “Change logo or page title” check box. If not selected, default logo and branding (TURBOARD logo and branding settings) will be applied on your TURBOARD environment.
3 In the related fields, fill in the title you wish to appear on your URL tabs/web pages, and the URL path that you wish to open when the logo on TURBOARD pages is clicked for limited users (i.e. users with public links).
4 Upload your company logos using the upload options for each logo type. Each field is self explanatory.
5 Click SAVE CHANGES button.
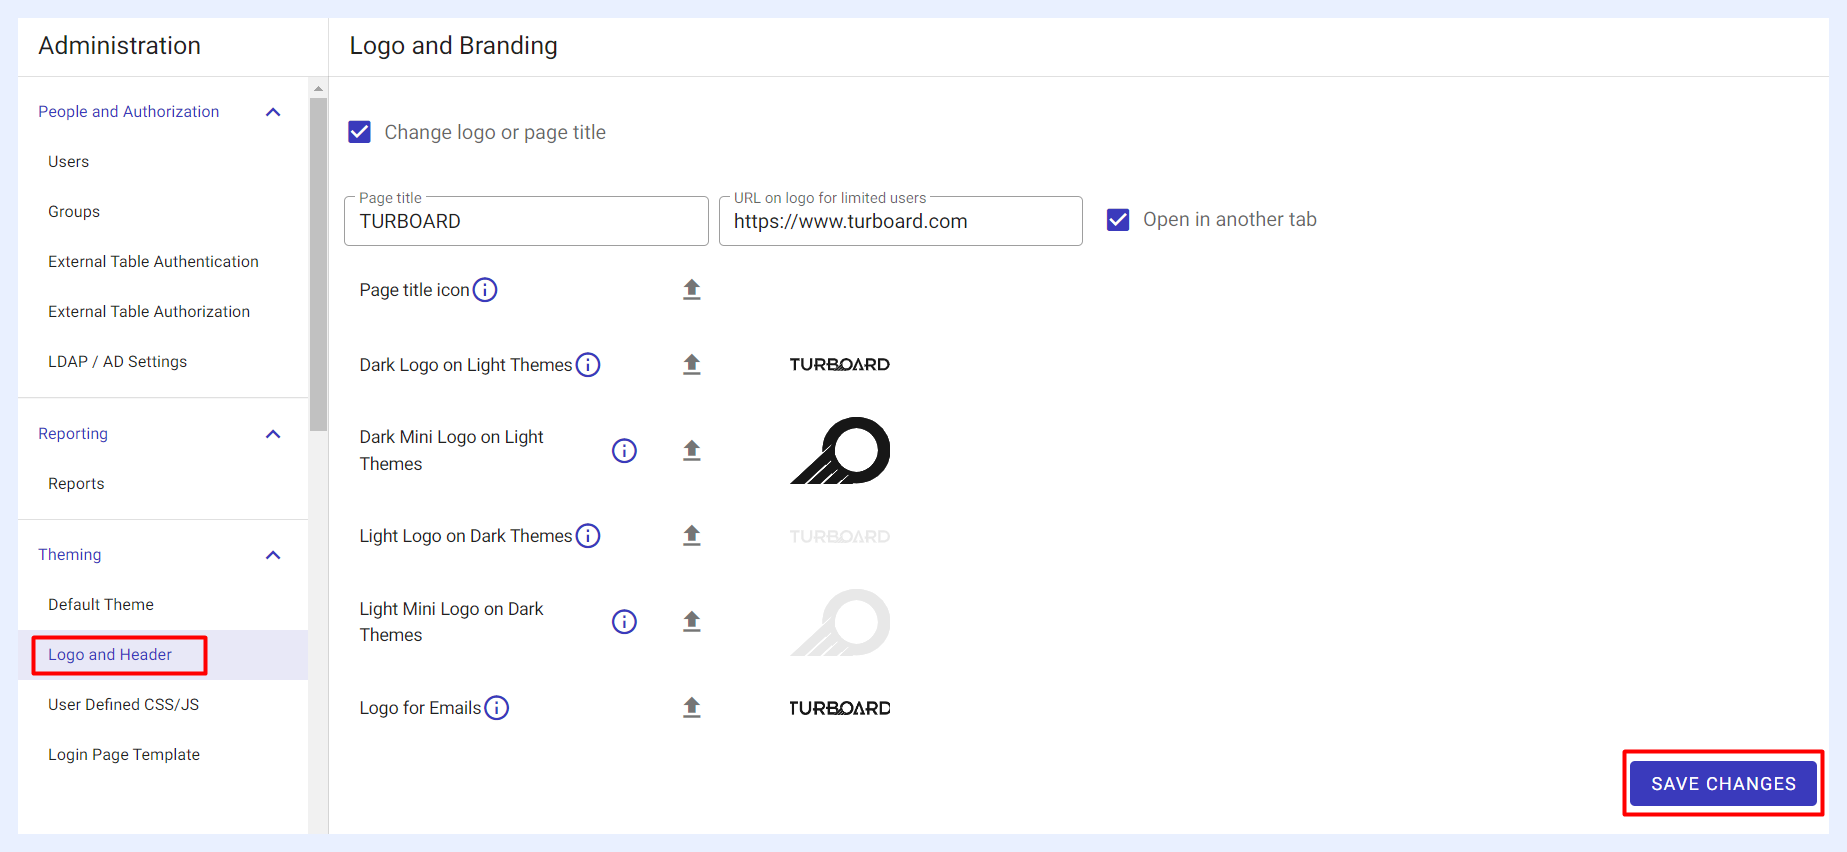
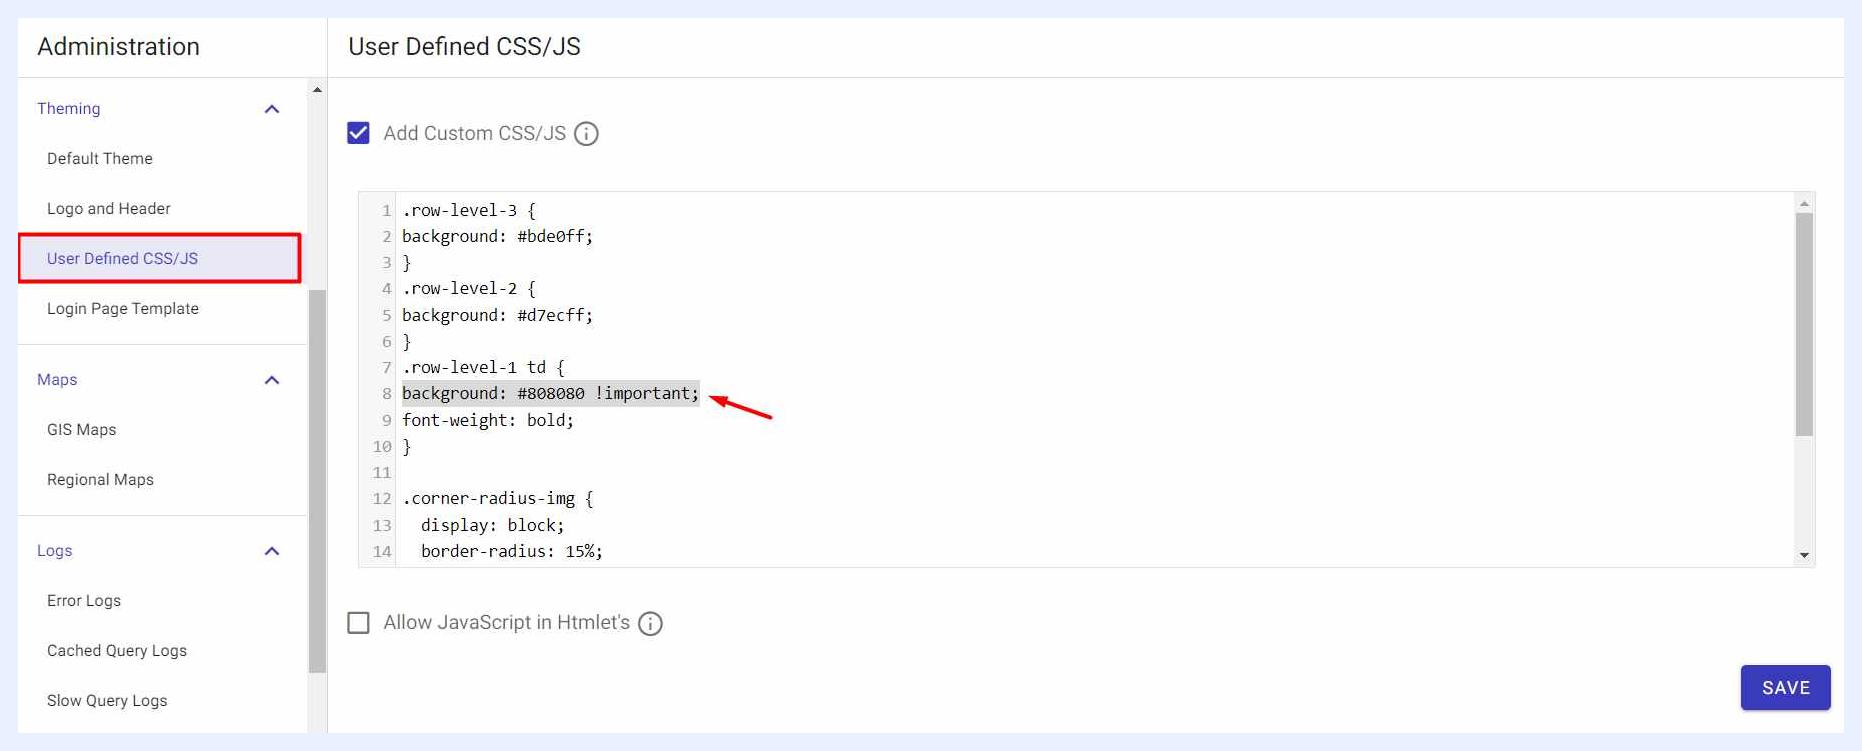
User Defined CSS/JS
This section allows the admin user to customize the general themes and styles of TURBOARD pages, in addition to giving permission to Designer users to use JavaScript codes while working on designing their dashboards.
Enabling Custom CSS/JS
“Add Custom CSS/JS” check box:
When this check box is checked, it allows the Admin user to customize or change the appearance and designs of various elements in TURBOARD’s web pages using custom CSS (Cascading Style Sheets).
For example, you can change the font size and/or color of TURBOARD pages’ titles or headers to a styling of your own preference.
You can write the required CSS script inside the HTML editor, then click SAVE button.
You may need to use the “!important” declaration for the elements that you want to change in order to override the default styles and have your changes applied.
You can find the correct selectors for the elements that you desire to modify using the browser developer tools (“Inspect” the HTML and CSS of TURBOARD webpages).
When this option is disabled (its check box is unchecked), the default CSS and styles will be applied to TUROARD pages.
Enabling JavaScript in Htmlets
“Allow JavaScript in Htmlet’s” check box:
Htmlets are customized elements that can be added by Designer users to dashboards using HTML scripts. They are basically custom-added HTML dashlets and are dynamic elements in dashboards.
When this check box is checked, it allows the Designer users to write JavaScript codes within the HTML editor and apply it to the Htmlet in the related dashboard.
This option allows using JavaScript code within HTMlets and can provide a wide range of functionalities to end-users, but it can create security vulnerabilities that may compromise the safety of your TURBOARD website. It can also be exploited to perform malicious actions such as redirecting users to phishing sites. Therefore, the Admin user shall use this option with caution and at the user's own discretion.
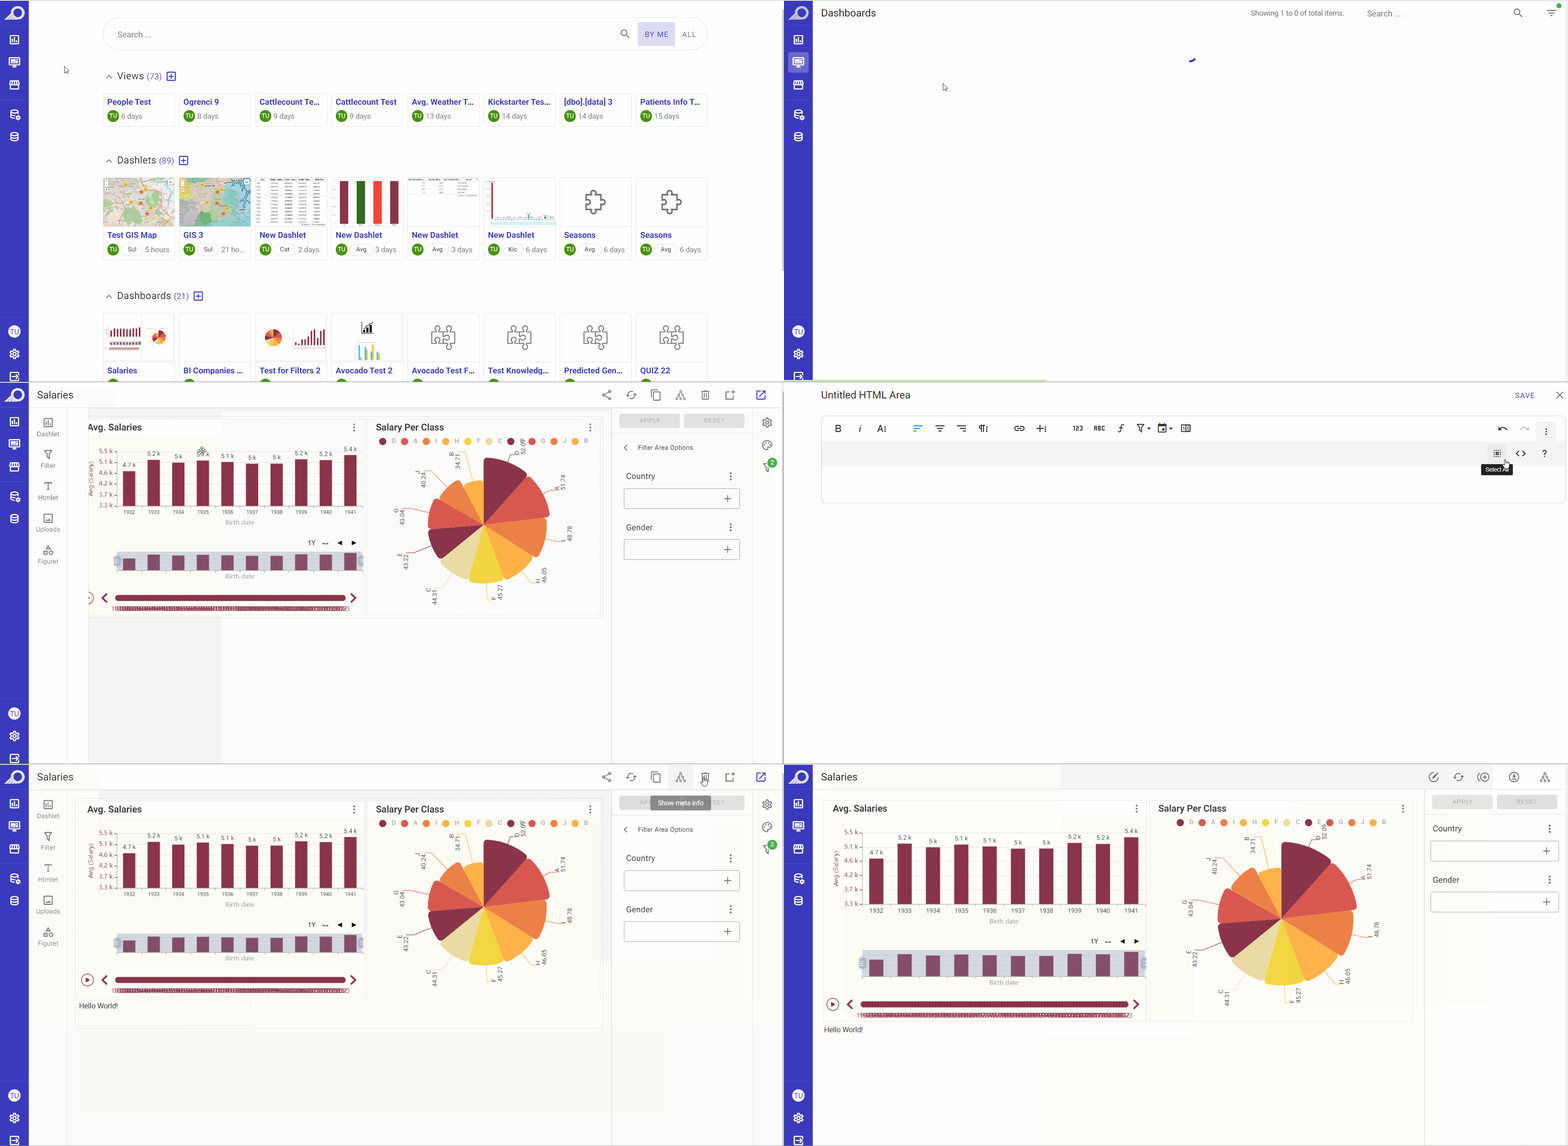
JavaScript enabled in Htmlets - Sample of an affected Htmlet in a Dashboard
Note
If “Allow JavaScript in Htmlet’s” option is unchecked or disabled, a Designer user can still write JavaScript code in the HTML editor and save the changes. However, TURBOARD will not apply the JavaScript code and will ignore it.
Login Page Template
The default page design to login to TURBOARD is as below. However, the admin user can change its design and customize it according to his/her preferences.

Default Login Page Design for TURBOARD Users
How to customize your TURBOARD environment login page?
1 Go to Administration > Theming > Login Page Template.
2 Check “Enable custom login page” check box in the window that opens.
3 Write/edit the HTML script and add HTML elements as required in the HTML mult-line field that appears below the check box. You can use Vuetify frameworks for appropriate HTML design as an example.
4 Click SAVE button once done.
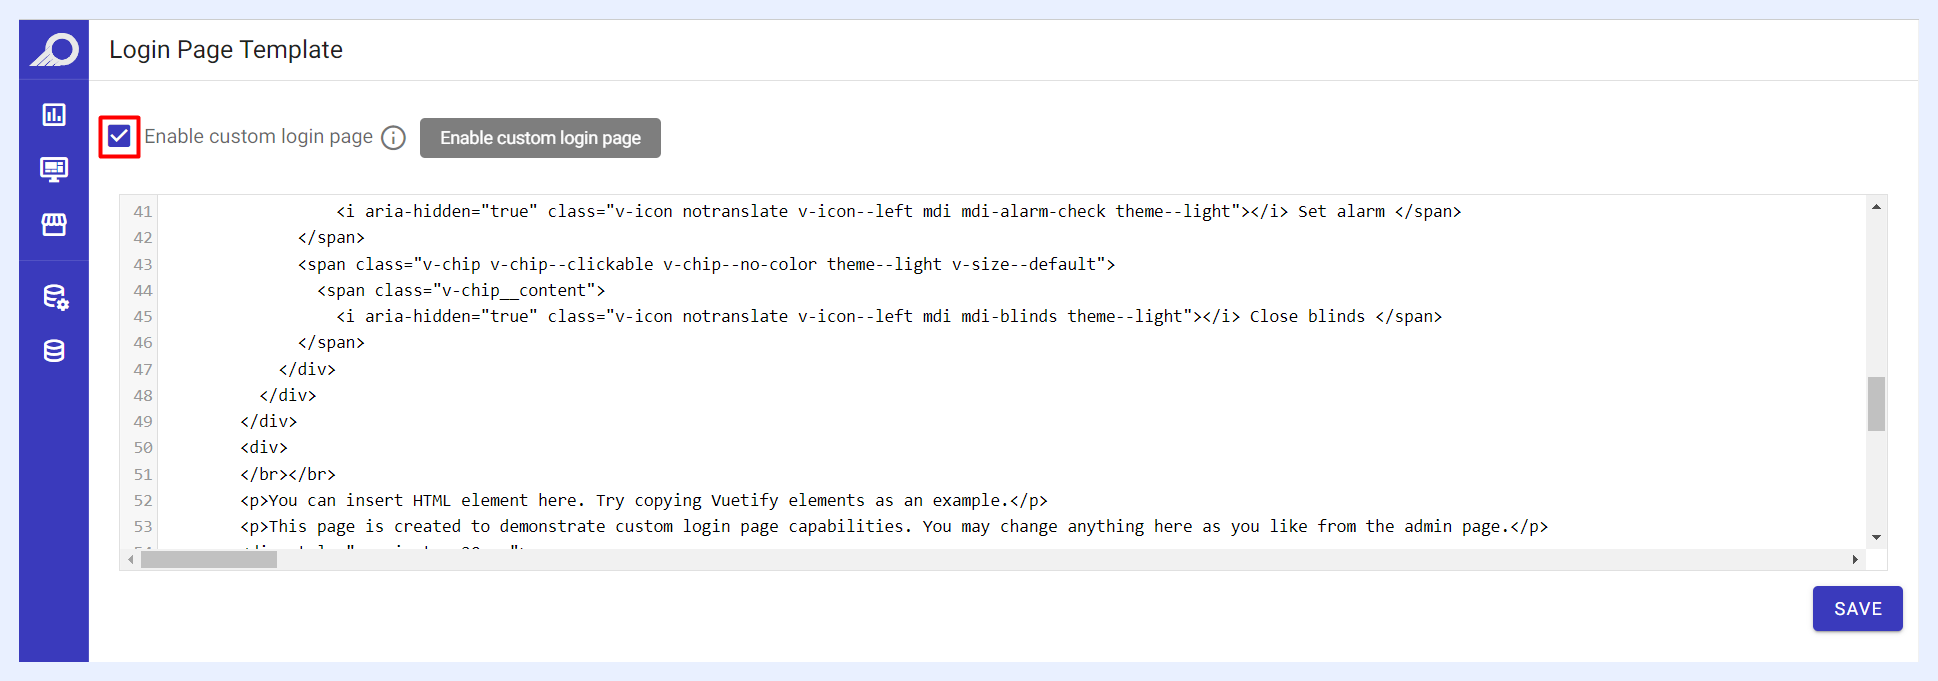
Your HTML custom designs will take place in the users’ login page as the below example:
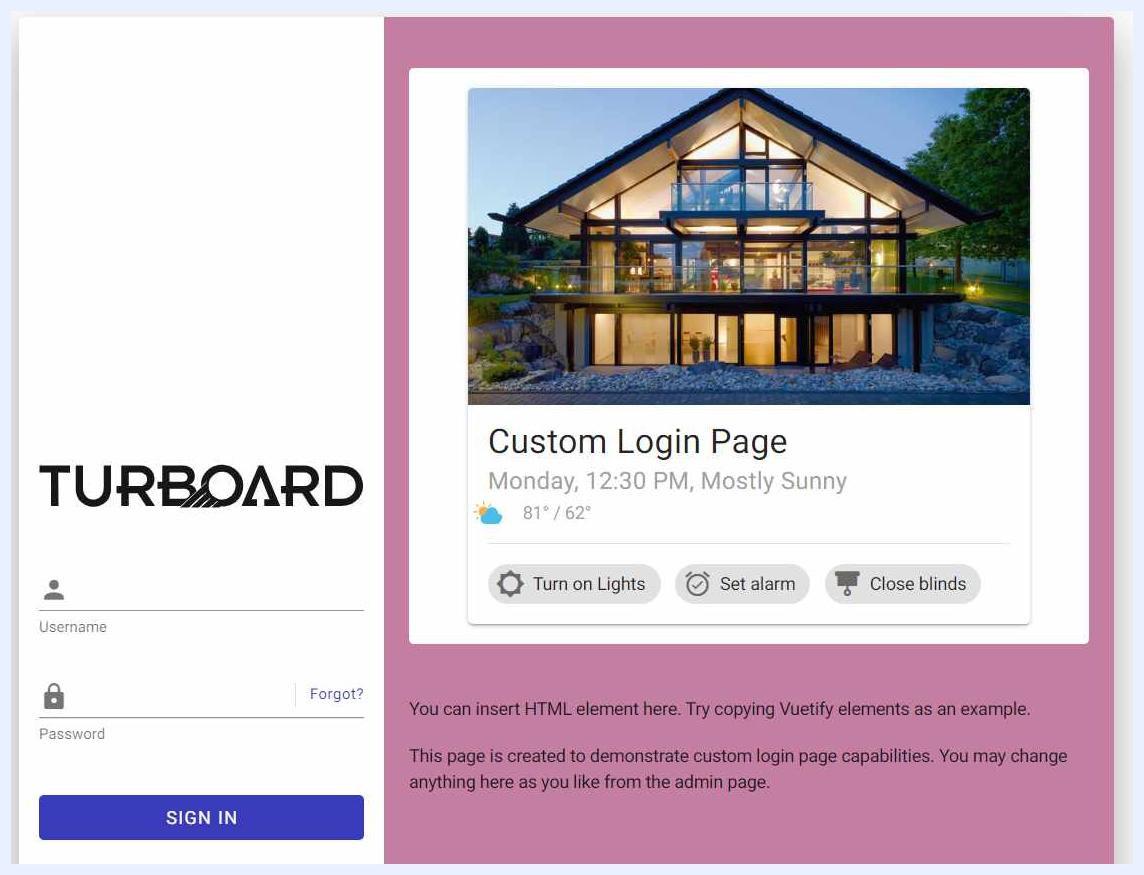
A sample of a customized login page
Maps
GIS Maps
A GIS (Geographic Information System) map is a digital map that uses layers of data to represent geographic information. It can include information such as roads, buildings, land use, and demographics, and can be used in an interactive way for analysis, and decision making. It is a toolset for visualizing and analyzing geo-spatial data by showing data points in exact locations using visualizations that are most suited to a map.
To visualize data using GIS in TURBOARD, an add-on module called (GIS-S) is required. This means that only TURBOARD clients who have purchased the GIS-S module will be able to use the “Geographical” dashlet types to create and analyze their data. Additionally, the GIS Maps configuration window here will only be visible to those clients who have purchased the module.
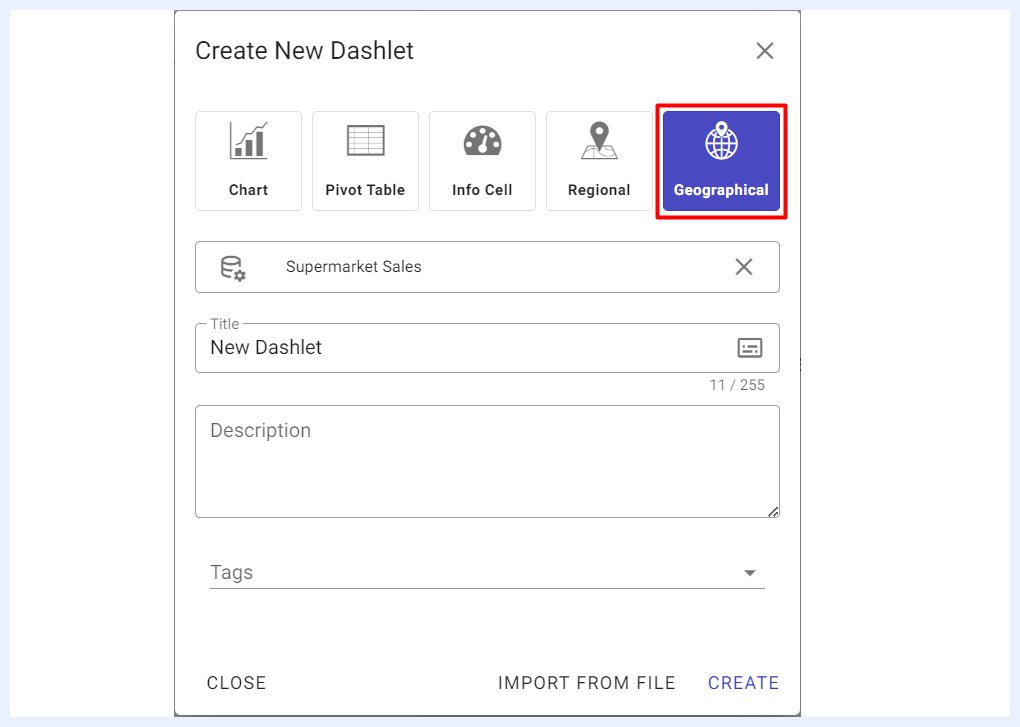
Geographical dahlets are only shown to TURBOARD workspace with GIS-S add-on module
Under this section, the Admin user can add/edit the basemaps that will be used by designer users to overlay the data points when working with Geographical dashlets. The admin user may choose to embed a map which is the product of a GIS map server such as QGIS or ArcGIS, in formats such as WMS/WMTS/PNG.
Note
TURBOARD GIS-S module has a default GIS map configured in the system (OSM) from the OSM server for the world map. This means that the Admin user does not need to configure any GIS map unless additional maps are needed for adding multiple GIS maps as overlays on top of each other to allow further analysis. For example, you can overlay a map of population density on top of a map of land use to analyze how population density relates to land use patterns.
Configuring GIS Maps in TURBOARD
How to add/edit a GIS map to your TURBOARD platform?
1 Go to Administration > Maps > GIS Maps.
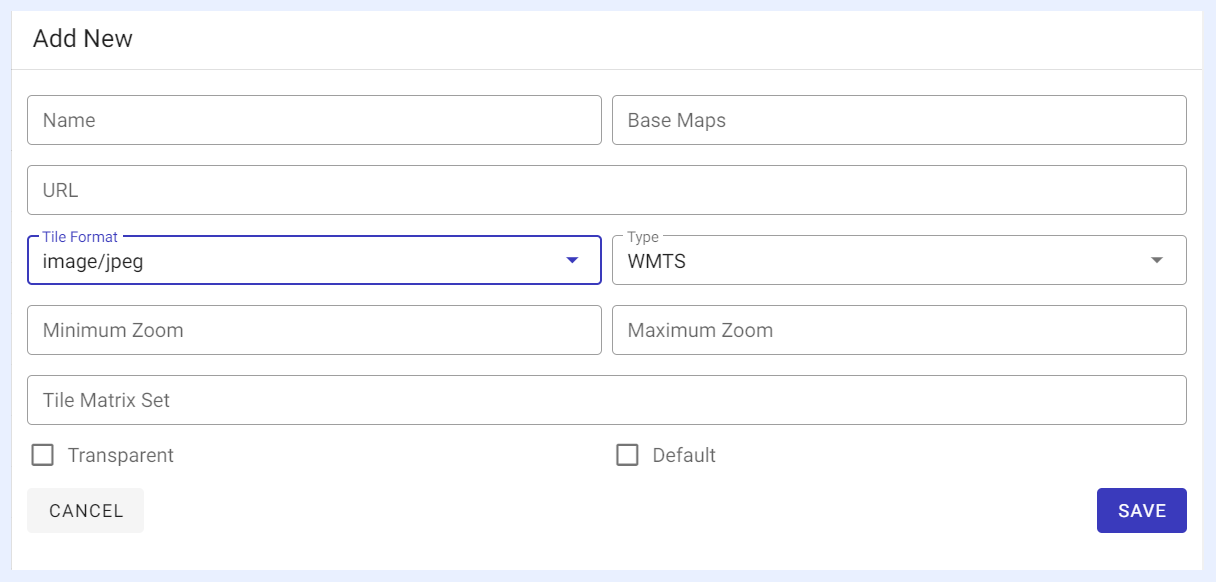
2 Click + Add a new GIS map button to “Add” a new GIS map, or select the required map from Maps list and click on it to “Edit” its properties in the window that opens on the right:
-
“Name” field: give a title to your map.
-
“Base Maps” field: this field is only activated for maps of type “MTS” and “WMTS” as they can be used to serve other basemaps.
-
“URL” field: determine the URL template for accessing map from its map server.
-
“Tile Format” field: select the tile format of the map from the drop-down list.
-
“Type” field: select the map type from the drop-down list.
-
Zooming fields: determine min. and max. zooming for the allowed zoom-in and zoom-out options for the map. Optional fields in which if left empty, the default zooming of the map will apply.
-
“Tile Matrix Set” field: this field is only activated for maps of type “WMTS” to determine the set of zoom levels and corresponding tile resolutions for the added map by entering the TileMatrix identifier.
-
“Transparent” check box: if checked, the added map will have transparent features which allows multi maps placed as layers on top of each other for further analysis.
3 Click SAVE button.
4 SET AS DEFAULT button: when clicked for the selected GIS map, it will become the default map when creating a Geographical dashlet for all Designer users, and the other added/available GIS maps can be used as additional basemaps/overlays.
Regional Map
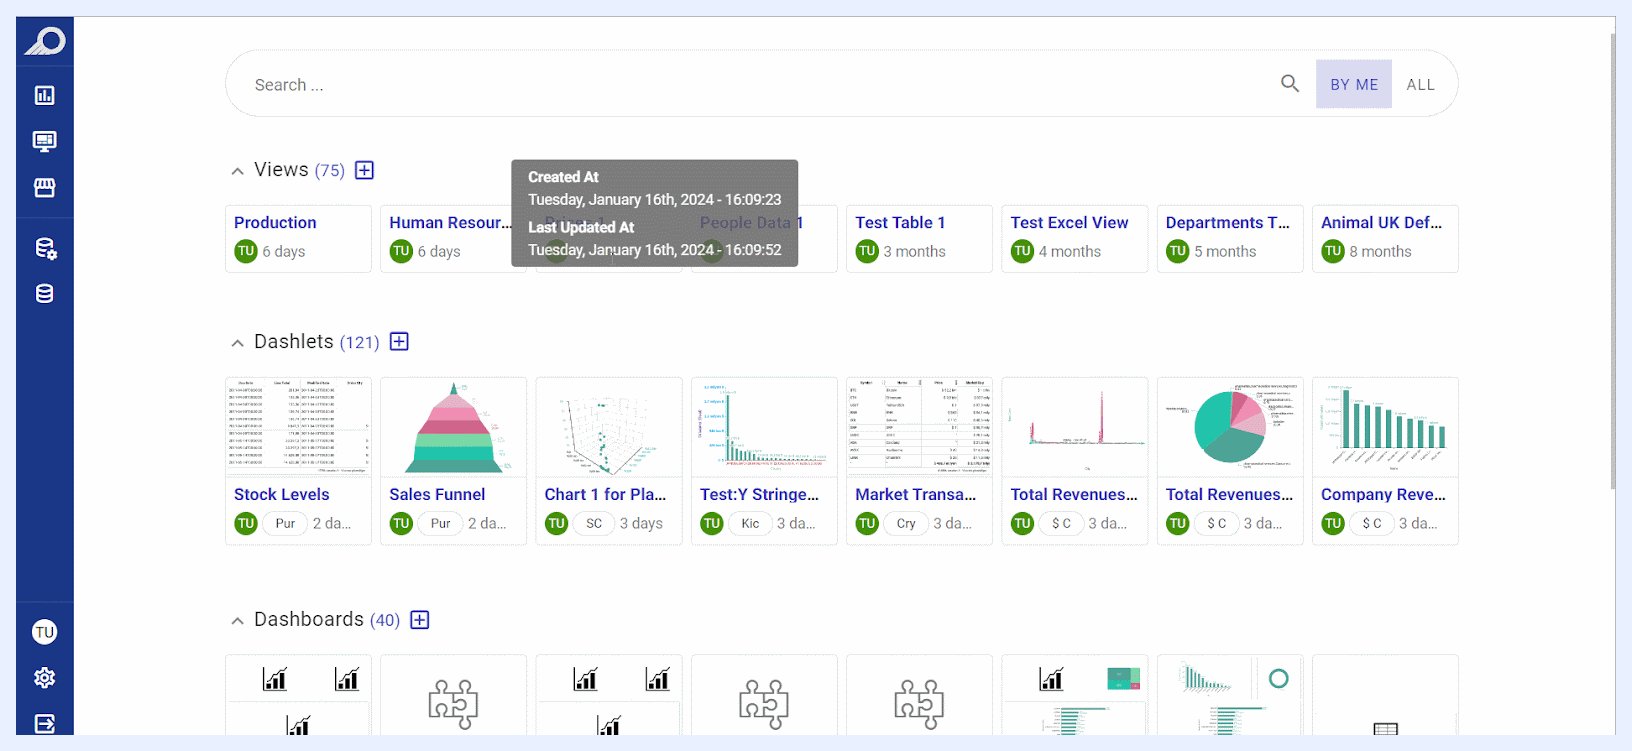
In TURBOARD, you can upload any SVG map (also called Regional Maps) in order to create an interactable map dashlets to compare customizable data for each territory in your datasets.
How to add an SVG map to your TURBOARD platform?
1 Go to Administration > Maps > Regional Maps.
2 Click + Add a new regional map button in the window that opens on the right.
3 Give a title to your map in the “Title” field and click ✓ correct symbol icon next to the field.
4 Click Choose a .GeoJson file and submit icon at the right side of the window to upload your SVG map file (GeoJSON map format only).
5 If the file is uploaded properly, your map will appear and you can add synonyms to any selected region(s) by clicking on the region > filling “Synonyms” field > clicking ADD button.
Important
Make sure that your map file format is GeoJSON and its main field name is 'name'. Otherwise, the map will not be uploaded properly.
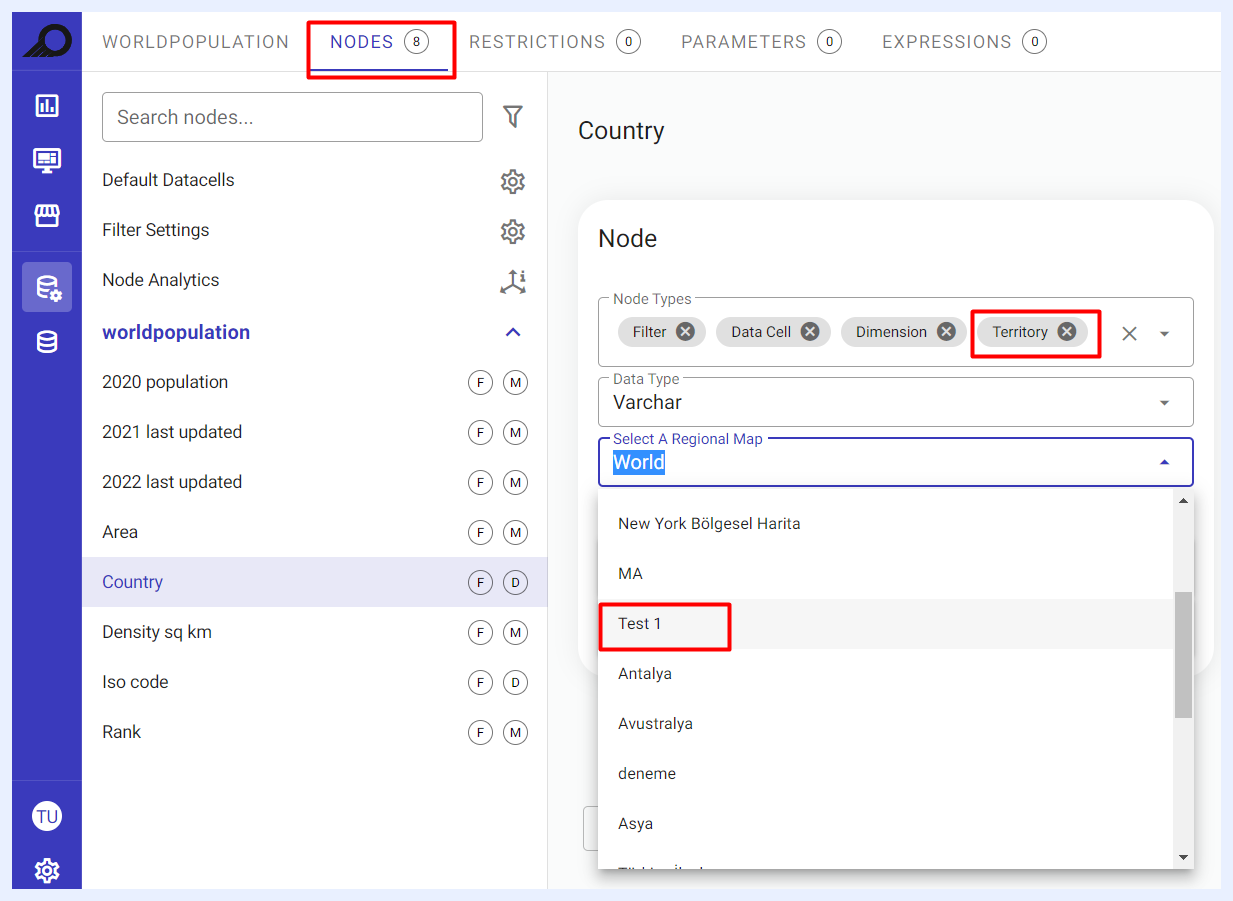
The uploaded map with its given name will be available under “Nodes” Properties of the “Views” for the nodes of type “Territory”, in which you can link it to these nodes.
Use Cases for “Synonyms” Feature in Regional Maps
You can view cities that are grouped together for various reasons. For instance, cities may be grouped together based on their Sales Region, Production Region, or other factors, and this allows you to easily track them as a collective grouping on the map.
It allows you to create customized labels for regions on the map. For example, you can set synonyms for a state or province that include commonly used abbreviations or alternative spellings, which can make the map more user-friendly for your audience.
It can be used to filter and search for regions on the map. This is particularly useful when you have a large number of regions or when you need to search for a specific region quickly.
You can use it to provide localized labels for regions on the map. For example, if you are creating a map for a specific country or region, you can use synonyms to provide the names of regions in the local language, which can make the map more accessible and relevant to your audience.
JAS
GenAI Settings
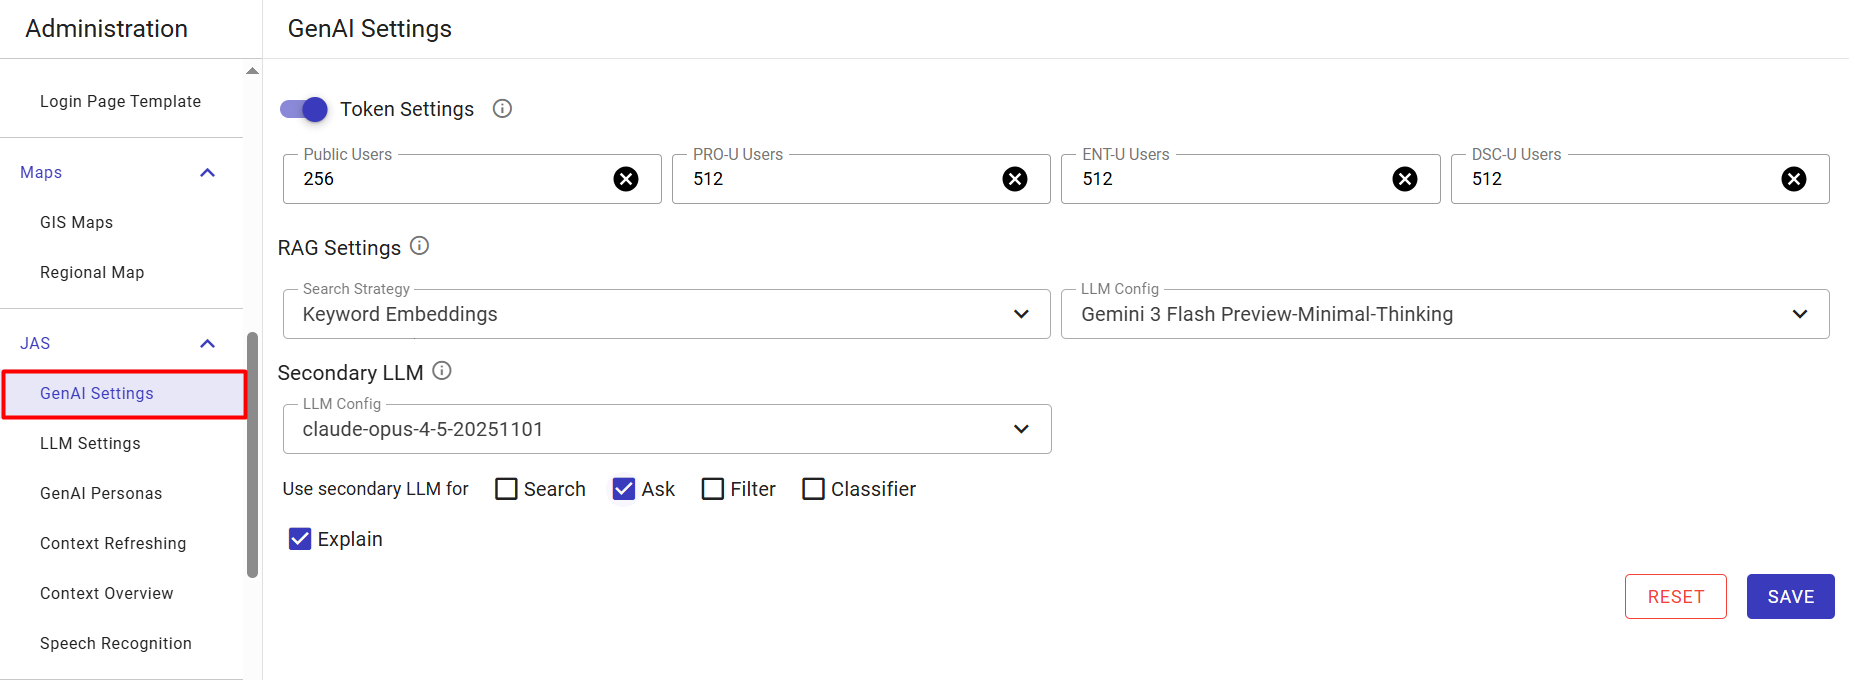
The GenAI Settings page serves as the foundational configuration hub for JAS (JustAskSimply). Administrators use this screen to manage token consumption limits across different user license tiers, configure the core RAG (Retrieval-Augmented Generation) search behavior for the platform landing page, and optionally route specific AI workloads to a secondary LLM.
Configuring Token Limits
Token limits control the maximum length of the responses JAS can generate. By defining these limits per user tier, administrators can manage AI processing costs and prevent excessive token consumption.
1 Go to Administration > JAS > GenAI Settings.
2 Locate the Token Settings section and ensure the toggle is switched ON.
3 Define the maximum output token limits for your configured user types (e.g., Public Users, PRO-U Users, ENT-U Users, DSC-U Users).
Note
These limits control exactly how many tokens JAS can generate in its responses. The minimum allowed limit for any user type is 256 tokens.
Configuring RAG and Search Strategies
1 In the RAG Settings section, click the Search Strategy drop-down menu to select the specific method JAS will use when users search for dashlets, dashboards, showcases, and views from the TURBOARD landing page (e.g., Keyword Embeddings).
2 Click the LLM Config drop-down menu to select the primary AI model that will execute this search strategy.
Note
The options available in the LLM Config drop-down list are populated directly from the configurations you have previously added in the LLM Settings administration page.
Routing Tasks to a Secondary LLM (Optional)
TURBOARD allows you to offload specific, complex AI workloads to a different model. For instance, you can use a fast, cost-effective model for basic search queries while routing heavy analytical tasks (like generating dashboard explanations) to a more capable reasoning model.
1 Locate the Secondary LLM section.
2 Click the LLM Config drop-down menu to select your optional secondary model. (Note: To completely disable the secondary LLM, simply click the X clear icon inside the field).
3 Under Use secondary LLM for, check the boxes for the specific JAS capabilities that should be routed to this secondary model instead of the primary one:
- Search
- Ask
- Filter
- Classifier
- Explain
4 Once all configurations are complete, click SAVE button at the bottom right to apply the settings, or click RESET button to revert to the previously saved state.
LLM Settings
TURBOARD’s GenAI Assistant, JAS, features flexible Large Language Model (LLM) orchestration. From this section, administrators can configure, fine-tune, and switch the underlying artificial intelligence models that power natural language analytics and automated data insights across the platform.
TURBOARD supports commercial cloud providers (such as OpenAI and Google Gemini) as well as private, on-premise, or custom-hosted language models.
Adding a New LLM Configuration
1 Go to Administration > JAS > LLM Settings.
2 Click the + icon button (Add new LLM config) located at the top-right of the configurations list.
3 In the Add New pane on the right, select one of the three provider tabs: OPEN AI, GOOGLE, or CUSTOM. Fill in the parameters according to your chosen provider:
1. OPEN AI Tab Configures connectivity to OpenAI's official API services:
- Name: A custom display name for this configuration. The official OpenAI badge icon is displayed automatically on the right.
- Api Key: The secret API key generated from the OpenAI developer platform. It will be marked in red if empty or invalid.
- Temperature:
- Definition: A numeric value (default
0) controlling response variability and randomness. - Uses: Lower values (e.g.,
0) produce highly deterministic, analytical outputs where strict accuracy is paramount, such as generating SQL queries or rigid data extraction. Higher values (e.g.,0.7) increase creativity, which is useful when asking JAS to generate varied narrative summaries of dashboards or brainstorm insights. - Model: A pre-populated dropdown menu containing official OpenAI models (e.g.,
gpt-5-codex,gpt-5-pro,gpt-5-mini,gpt-5-nano). - Reasoning Effort (Dynamic Field): Automatically appears when a reasoning-specialized model (such as
gpt-5-codexoro-series models) is selected. - Toggle Switch: Enables or disables specialized reasoning tokens.
- Effort Dropdown: Sets the computational reasoning depth to Low, Medium, or High.
- Uses: Higher reasoning effort allocates more compute time for the AI to "think" before responding. This is ideal for complex logical deductions, intricate data correlations, or advanced code generation, though it may slightly increase response time.
- Agent Mode:
- Definition: Determines whether the model supports autonomous analytical agent workflows.
- Uses: Select Supports agent mode to enable JAS to execute multi-step workflows (e.g., autonomously querying a database, analyzing the results, and deciding which chart to generate). Select Does not support agent mode if you only need the model for simple, single-turn text completions or basic translations.
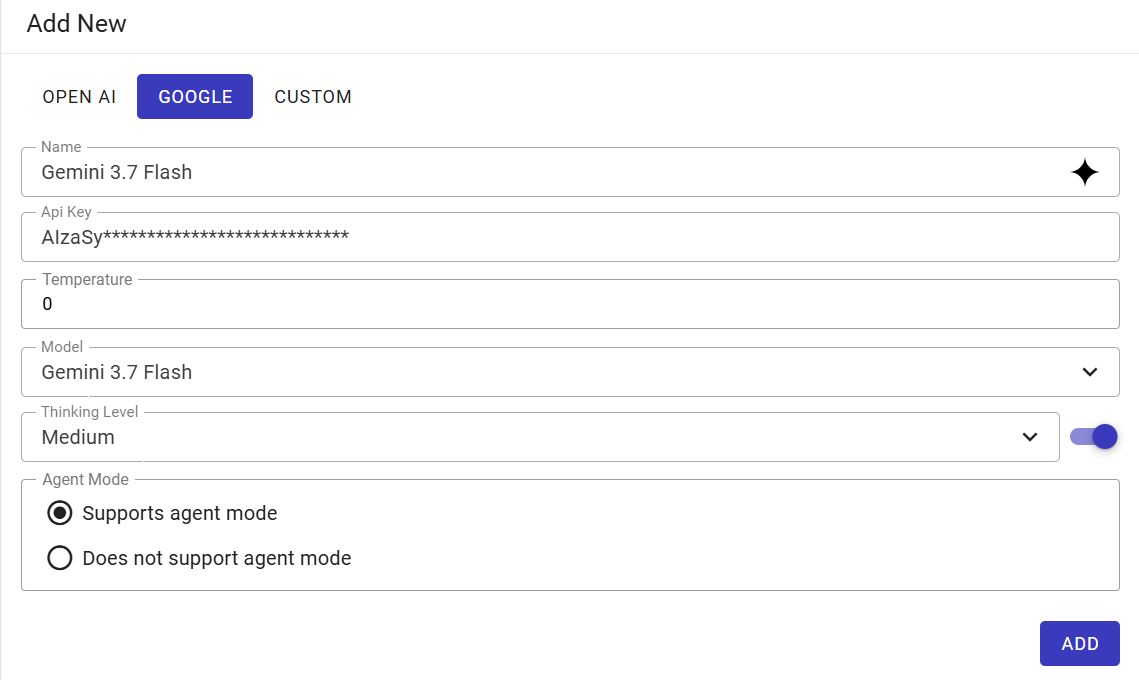
2. GOOGLE Tab Configures connectivity to Google AI Studio / Gemini API services:
- Name: A custom display name for the Gemini instance. The Google Gemini star icon is displayed automatically on the right.
- Api Key: The API key generated from Google AI Studio or Google Cloud Vertex AI.
- Temperature: A numeric value (default
0) for output determinism, functioning identically to the OpenAI temperature setting. - Model: A pre-populated dropdown list containing Google Gemini models (e.g.,
Gemini 3.7 Flash,Gemini 2.5 Flash). - Thinking Level (Dynamic Field): Automatically appears when a thinking-enabled Gemini model (such as
Gemini 3.7 Flash) is selected. - Toggle Switch: Activates or deactivates extended internal reasoning budgets.
- Thinking Level Dropdown: Controls the model's internal thinking budget (e.g., Low, Medium, High).
- Agent Mode: Choose between Supports agent mode or Does not support agent mode.
3. CUSTOM Tab Designed for private cloud deployments, local LLM servers (e.g., vLLM, Ollama, TGI), OpenAI-compatible gateways (e.g., OpenRouter), and fully on-premise infrastructure:
- Name: A recognizable identifier for the local/custom deployment (displays a neutral circular badge).
- Api Key: The authentication token required by the custom endpoint. If the private endpoint does not require authentication, enter a placeholder value.
- LLM Model (Open Text Field): Unlike the OPEN AI and GOOGLE tabs which use pre-populated dropdowns, this field is an open text input. Administrators must type the exact target model string identifier as defined on the host server (e.g.,
Inferact/Qwen3.8-Flash-Next-NVFP4,deepseek-ai/DeepSeek-R1, orqwen2.5-coder-32b). - Add Attribute: A dynamic key-value constructor used to pass arbitrary endpoint URLs, request headers, or model execution kwargs directly to the API client.
- Key: The parameter name.
- Value: The target parameter value.
- Uses: The most common use case is overriding the
base_url(e.g.,https://llm.ebalina.com/v1) to route requests to a private, on-premise gateway, ensuring sensitive BI data never leaves your corporate network. You can also pass specialized kwargs likeextra_body.chat_template_kwargs.enable_thinking. - Click the
+button to register the attribute into the configuration. Individual attributes can be deleted at any time by clicking their respective trash can icons. - Agent Mode: Select Supports agent mode or Does not support agent mode depending on the local model's function-calling capabilities.
4 Click ADD button to finalize and store the newly created configuration.
Editing and Managing Configurations
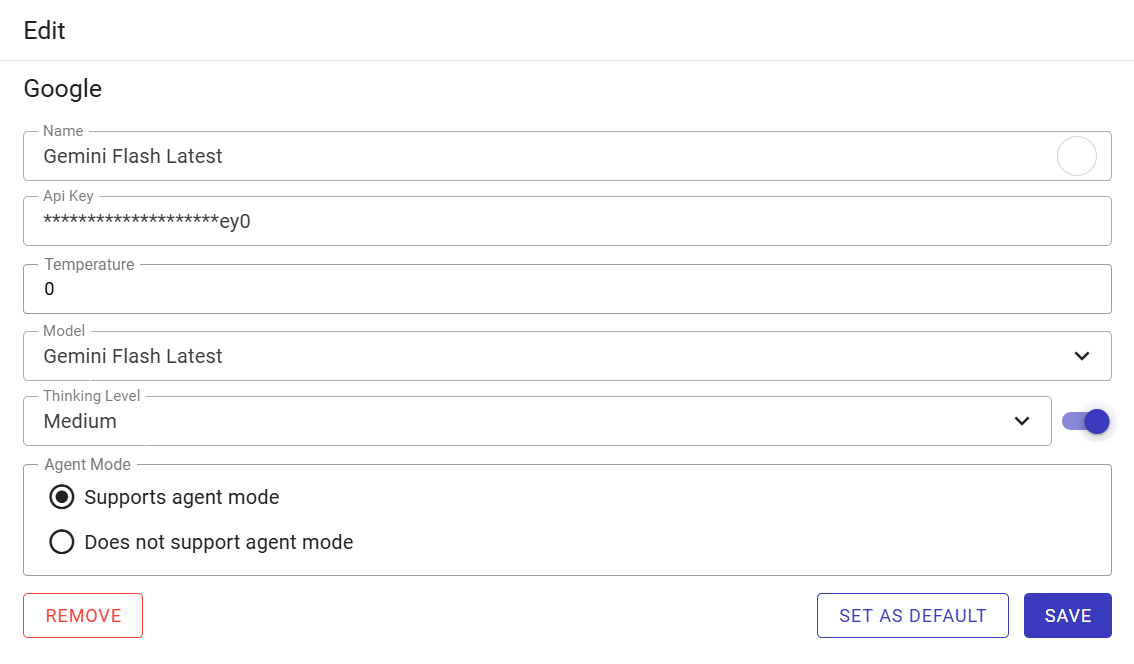
Once a configuration is added, it will appear in the left-hand configuration list. Selecting any model from the list opens its parameters in the Edit pane:
1 Select the target model from the list on the left.
2 Update parameters, API keys, or custom attributes as needed.
3 Use the action buttons at the bottom of the pane to manage the configuration:
- SAVE: Saves changes made to the selected configuration.
- SET AS DEFAULT: Designates the selected configuration as the global default LLM across TURBOARD for all JAS queries and background smart descriptions. The active default configuration is marked with a black indicator circle in the left-hand menu.
- REMOVE: Deletes the configuration from the system.
GenAI Personas
Administrators can establish a globally defined repository of AI Personas that govern the narrative tone, analytical depth, and presentation structure of JAS explanations. By creating tailored personas (such as Action-Oriented Manager, Strategic Executive, CFO for Planning, or Domain Specialist), JAS can interpret business intelligence visualizations from distinct perspectives without altering the underlying datasets.
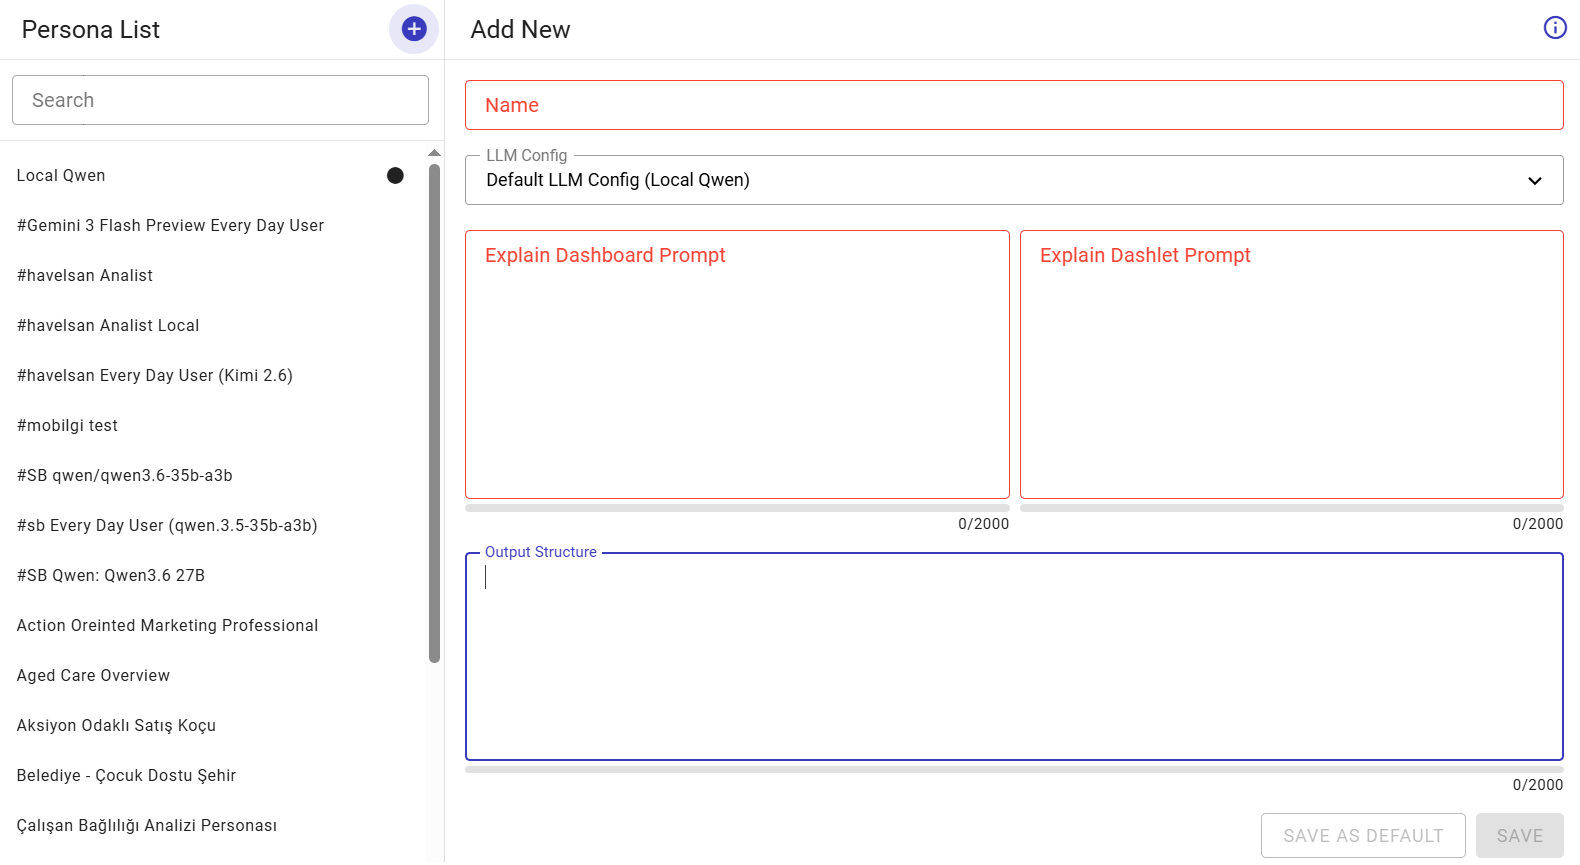
Adding a New GenAI Persona
1 Go to Administration > JAS > GenAI Personas.
2 Click the + icon button (Add new persona) located at the top-right of the Persona List.
3 In the Add New pane on the right, configure the persona settings and prompts:
-
Name: Enter a clear display title for the persona (e.g.,
Aged Care Overview,Strict Financial Controller). This is the exact label shown to designers and end-users. -
LLM Config: Select the underlying model configuration that powers this specific persona from the drop-down menu.
Note
The options available in the LLM Config drop-down list are pre-defined and populated directly from the configurations added in the LLM Settings administration page.
-
Explain Dashboard Prompt: Enter the system instructions used when the AI analyzes an entire dashboard. Specify the persona's role, analytical objectives, metrics to focus on, and tone of voice.
-
Explain Dashlet Prompt: Enter the instructions used when the persona analyzes a single, isolated visualization (chart, table, or gauge).
-
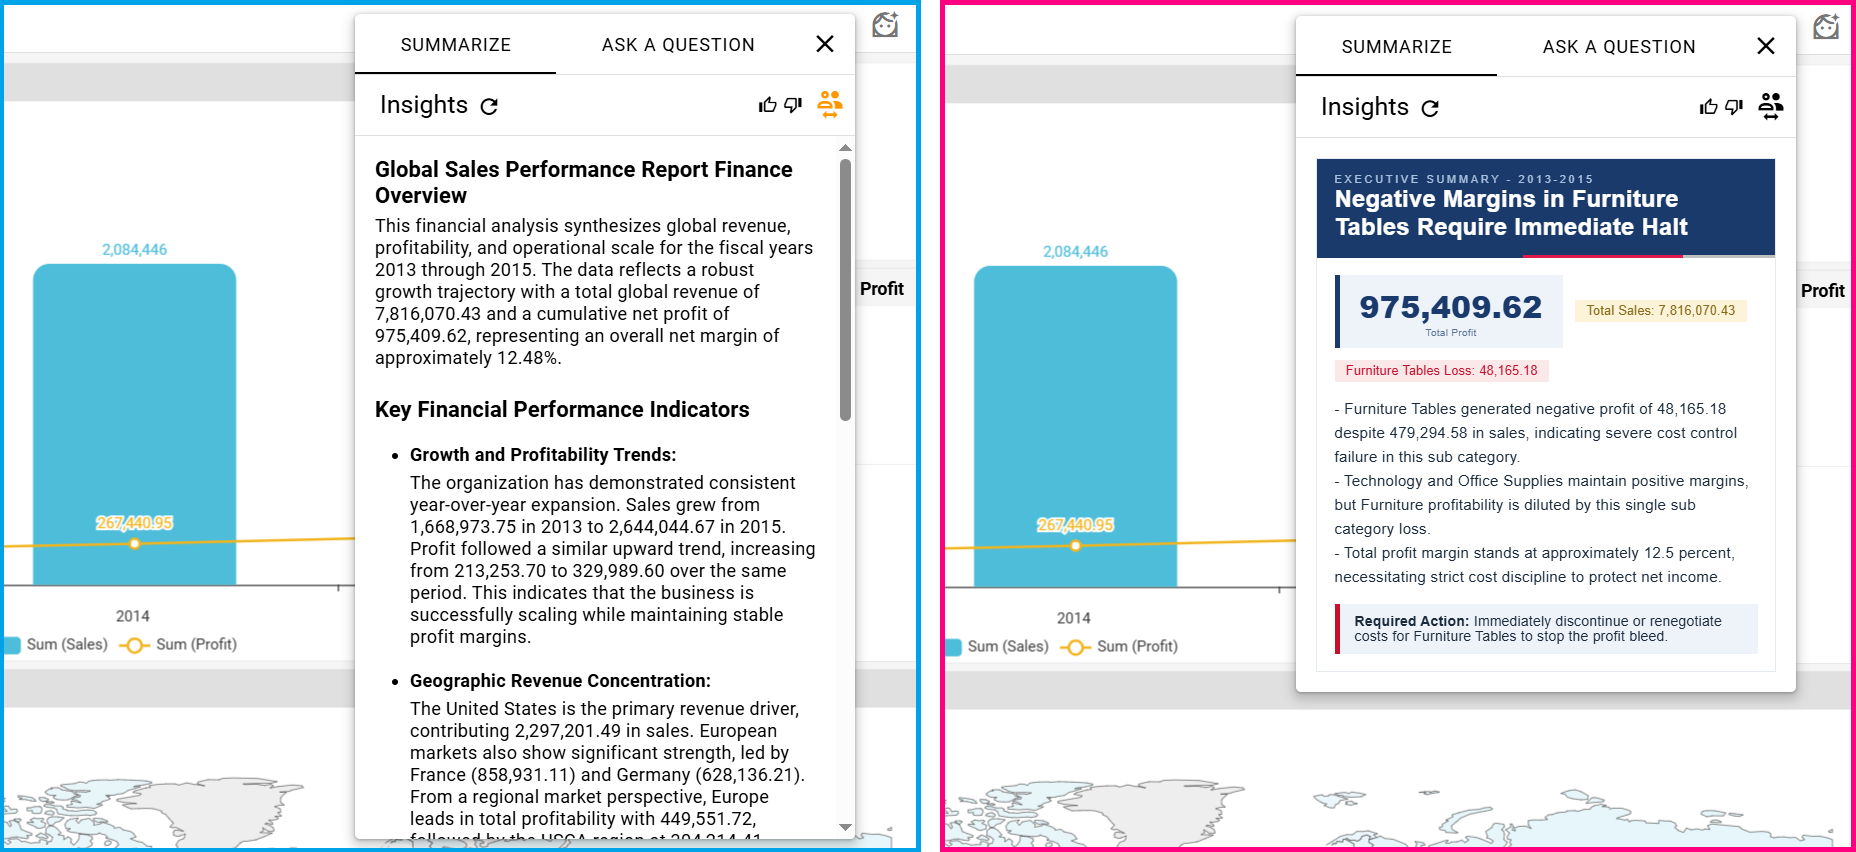
Output Structure (Optional): Define the visual layout and the strict order of information for the generated narrative. If left empty, JAS will output standard plain text (simple paragraphs and bullet points). Filling this field allows you to enforce the exact sequence of data presentation along with special formatting, such as custom data blocks, styled labels, specific color schemes, and unique card designs. To create a custom layout, this field supports a combination of three structural components:
- Formatting Directives: Plain-text rules at the very top that enforce language, number conventions (e.g., decimal formats), and length constraints (e.g.,
HEADLINE=Main Title, max 10 words). - HTML & CSS Template: Standard HTML elements combined with inline styles or
<style>blocks to define cards, grids, flex layouts, font sizes, and container colors. - Dynamic Mustache Tags: Variable placeholders (e.g.,
{{PERIOD}},{{HEADLINE}},{{KPI_1}},{{ACTION_ITEM}}) inserted inside the HTML structure. JAS generates analytical values matching the directives and renders them directly into these placeholders in your specified order.
- Formatting Directives: Plain-text rules at the very top that enforce language, number conventions (e.g., decimal formats), and length constraints (e.g.,
See below the visual difference between leaving the Output Structure empty for standard plain text versus applying a custom HTML/CSS template to dictate the layout, colors, and order of information.
4 Click SAVE button to store the persona, or click SAVE AS DEFAULT button to designate it as the default persona applied when no specific persona is selected.
Editing and Managing Personas
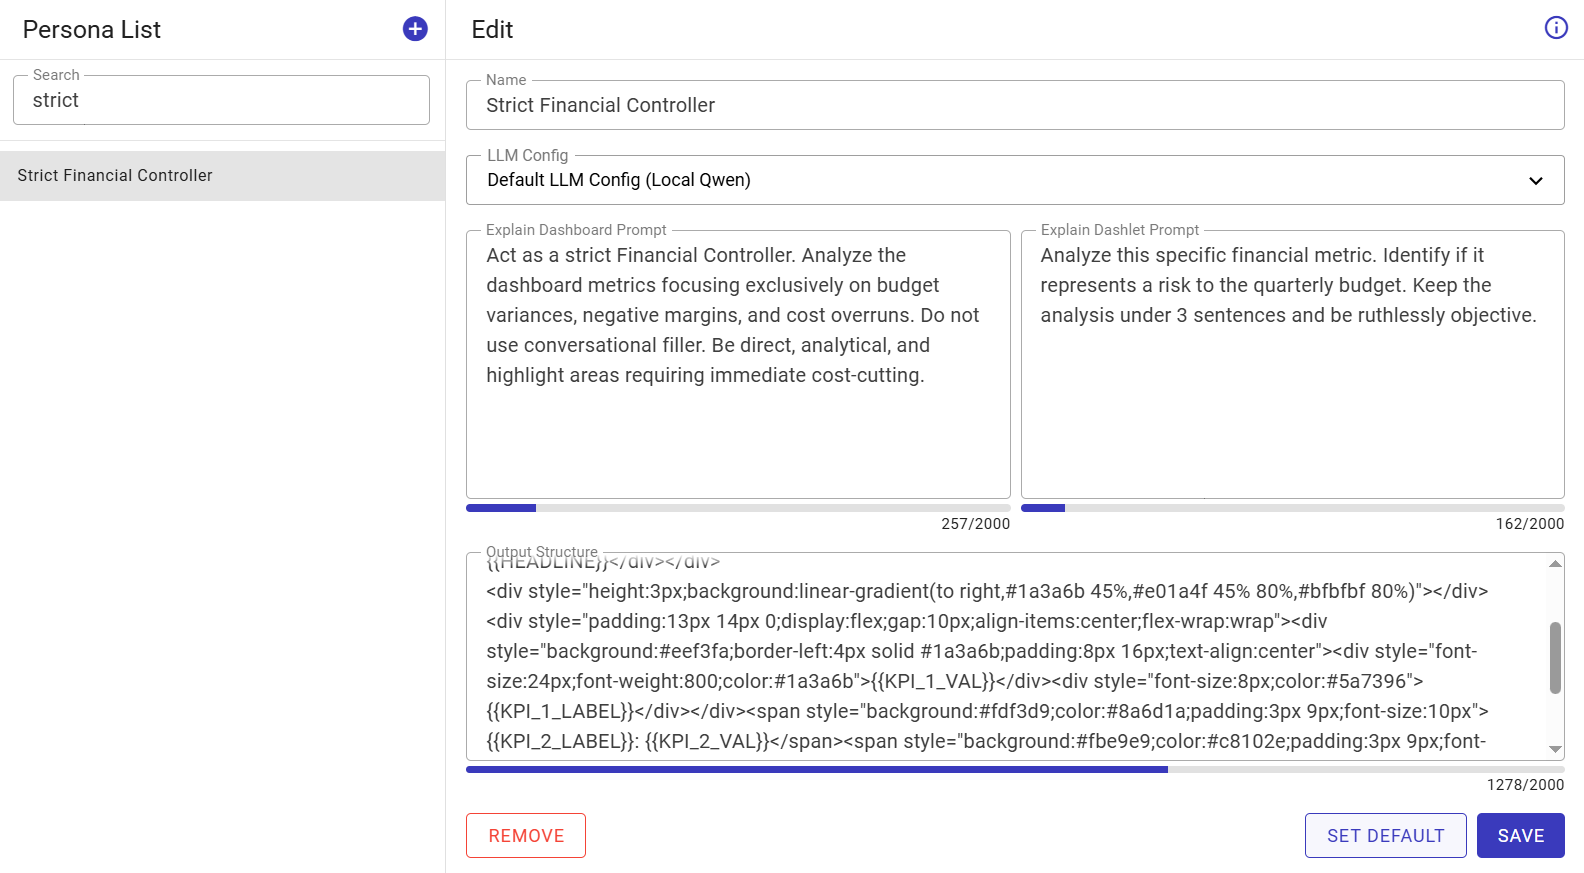
All registered personas are cataloged in the Persona List on the left.
1 Select the persona from the list or use the Search field to locate it.
2 In the Edit pane on the right, update the persona name, assigned LLM configuration, prompts, or output template as needed.
3 Use the action buttons at the bottom of the pane to manage the entry:
-
SAVE: Saves changes made to the selected persona.
-
SET DEFAULT: Designates this persona as the global fallback default across the platform.
-
REMOVE: Permanently deletes the persona from the system.
Note
System Integration & End-User Experience:
Once personas are defined in this administration panel, they become available across the platform:
Designer Interface: Dashboard designers can curate and restrict which personas are accessible on specific dashboards. See the Dashboard Settings & Configuration Panel section to learn more.
End-User Interface: Curated personas appear directly inside the JAS Explain drop-down menu on dashboard ribbons and dashlet menus, allowing end-users to generate tailored narratives on demand. See the Dashboard Quick Actions Ribbon section to learn more.
Context Refreshing
JAS relies on descriptions of your data to answer questions accurately. TURBOARD can automatically generate smart descriptions for Data Source Tables, View Nodes, Dashlets, Dashboards, and Showcases using RAG (Retrieval-Augmented Generation) technology, analyzing each element shortly after creation and populating its description field to build a knowledge base that makes subsequent JAS queries faster and more accurate. Administrators can supplement these with manually written descriptions for Nodes and Expressions, and can use the “Context Refreshing” page to schedule recurring automated updates to JAS’s knowledge base so that its understanding of the data stays current without manual intervention.
Adding a New Refresh Schedule
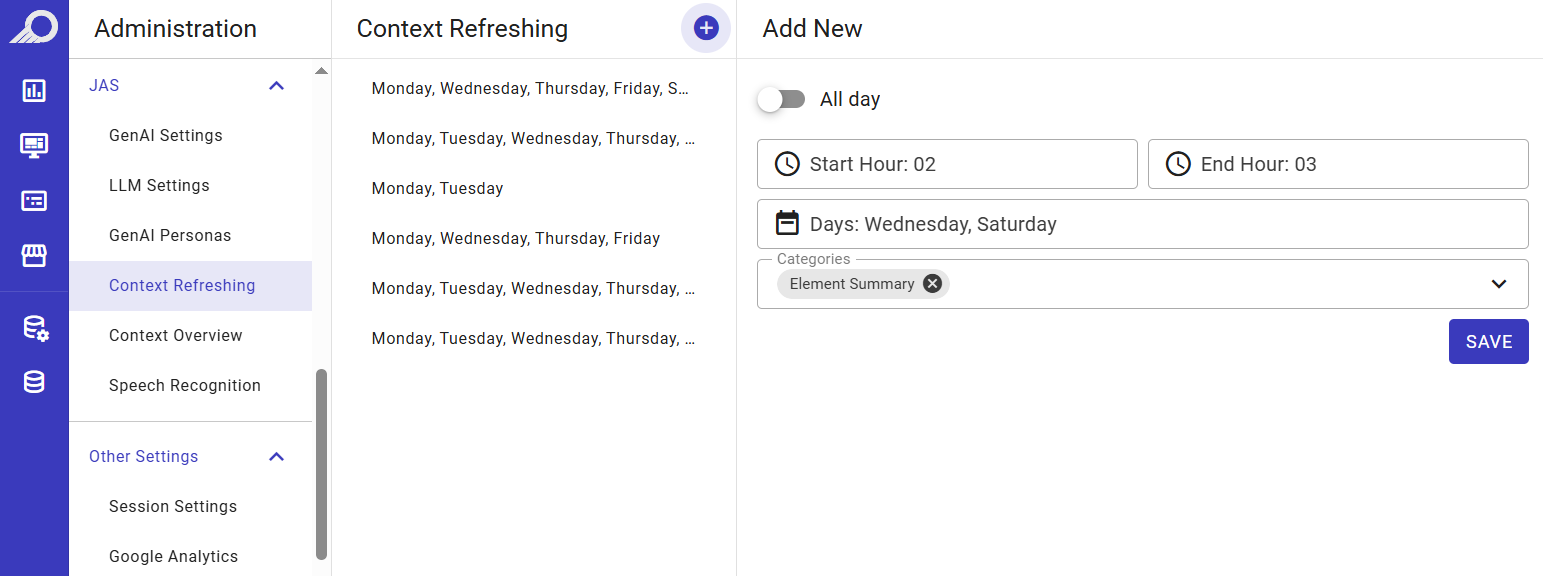
1 Go to Administration > JAS > Context Refreshing.
2 Click the + icon button located at the top-right of the schedules list.
3 In the Add New pane on the right, configure the timing and scope of the background refresh:
- All day: Toggle this switch to allow the system to run the refresh tasks continuously throughout the selected days.
-
Start Hour & End Hour: If the All day toggle is disabled, specify a dedicated time window for the refresh process using the drop-down selectors (e.g.,
Start Hour: 00andEnd Hour: 06).Note
It is highly recommended to schedule context refreshing during off-peak hours (e.g., midnight to early morning) to prevent heavy AI processing tasks from consuming system resources during active business hours.
-
Days: Click the field to open the drop-down checklist and select the specific days of the week when the schedule should run. At least one day must be selected.
- Categories: Click the drop-down menu to select which specific metadata categories should be updated.
- Element Summary: Refreshes the automatically generated summaries for all elements. Each summary provides key findings and descriptions that reflect the latest state of dashlets, dashboards, showcases, and views.
4 Click SAVE button to store and activate the schedule.
Editing and Managing Schedules
Once created, all refresh schedules appear in the left-hand list panel based on their configured days.
1 Select the target schedule from the list on the left to open its configuration in the Edit pane.
2 Modify the operating hours, active days, or metadata categories as needed.
3 Use the action buttons at the bottom of the pane to manage the entry:
- SAVE: Saves and applies changes made to the schedule.
- REMOVE: Permanently deletes the schedule from the system.
Context Overview
The Context Overview page acts as the central monitoring and auditing dashboard for TURBOARD's RAG (Retrieval-Augmented Generation) knowledge base. While the Context Refreshing page handles automated schedules, this overview provides a comprehensive, tabular inventory of all system elements (Dashlets, Dashboards, Showcases, Views, and Expressions) and their current metadata status.
Administrators use this screen to track which elements have successfully generated AI summaries, which are pending, and which require manual intervention to ensure JAS provides the most accurate answers possible.
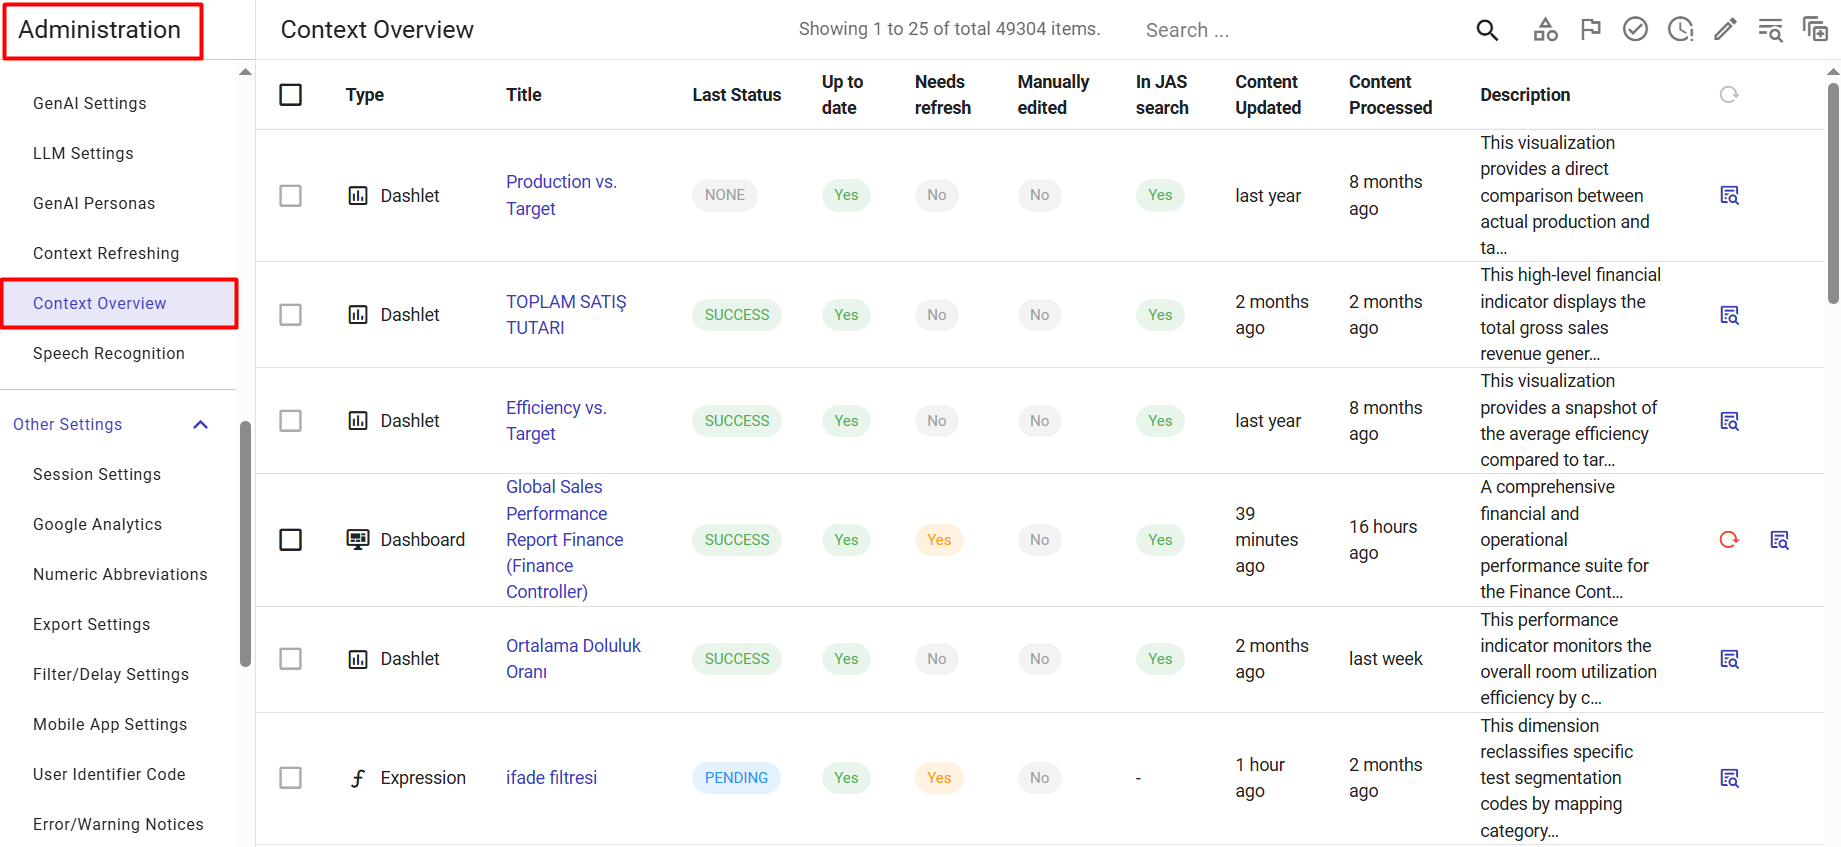
Understanding the Context Grid
When navigating to this page, the main grid displays the structural health of your JAS knowledge base:
- Type & Title: Identifies the system element and its given name.
- Last Status: The operational status of the AI generation process (e.g.,
SUCCESS,PENDING,NONE,FAILED). - Up to date & Needs refresh: Indicates if the element has been structurally modified or updated since its last AI summary generation, flagging it for a refresh.
- Manually edited: Shows
Yesif a human administrator has overridden the auto-generated description with manual text. - In JAS search: Confirms whether this element's context is actively indexed and being used by JAS to answer end-user queries.
- Content Updated & Processed: Timestamps indicating when the element was last modified and when JAS last processed its metadata.
- Description: A preview snippet of the actual generated or manual text.
- Action Icons: The far-right column contains specific tools for manual context management (Refresh context and Show context details).
Filtering and Auditing Context
To easily audit thousands of items, the top-right toolbar provides a suite of targeted filtering tools designed specifically for RAG management:
- Search (Magnifying Glass): Search for specific elements by their title.
- Browse by entity type (Shapes icon): Filter the list to show only specific categories, such as isolating only Dashboards or only Views.
- Browse by last status (Flag icon): Filter the list to find elements where the AI generation failed or is currently pending.
- Browse by up-to-date state (Checkmark icon): Quickly isolate elements whose descriptions are lagging behind the current data structure.
- Browse by manually edited state (Clock icon): Audit all custom, human-authored descriptions.
- Browse by JAS search inclusion (Pencil icon): Filter by elements that are actively included or excluded from the JAS search index.
- Include all entities (List icon): A toggle to reveal raw entities that have not yet been processed by the RAG pipeline or lack a RAG record entirely.
Manually Managing Descriptions & Context Details
While AI handles the bulk of the work, administrators can manually intervene on specific elements directly from this grid to refine JAS's understanding.
1 Go to Administration > JAS > Context Overview.
2 Use the top-right toolbar filters to locate the specific element requiring attention.
3 To force an immediate AI update for an outdated item, click the Refresh context icon (circular arrow) located at the far right of its row.
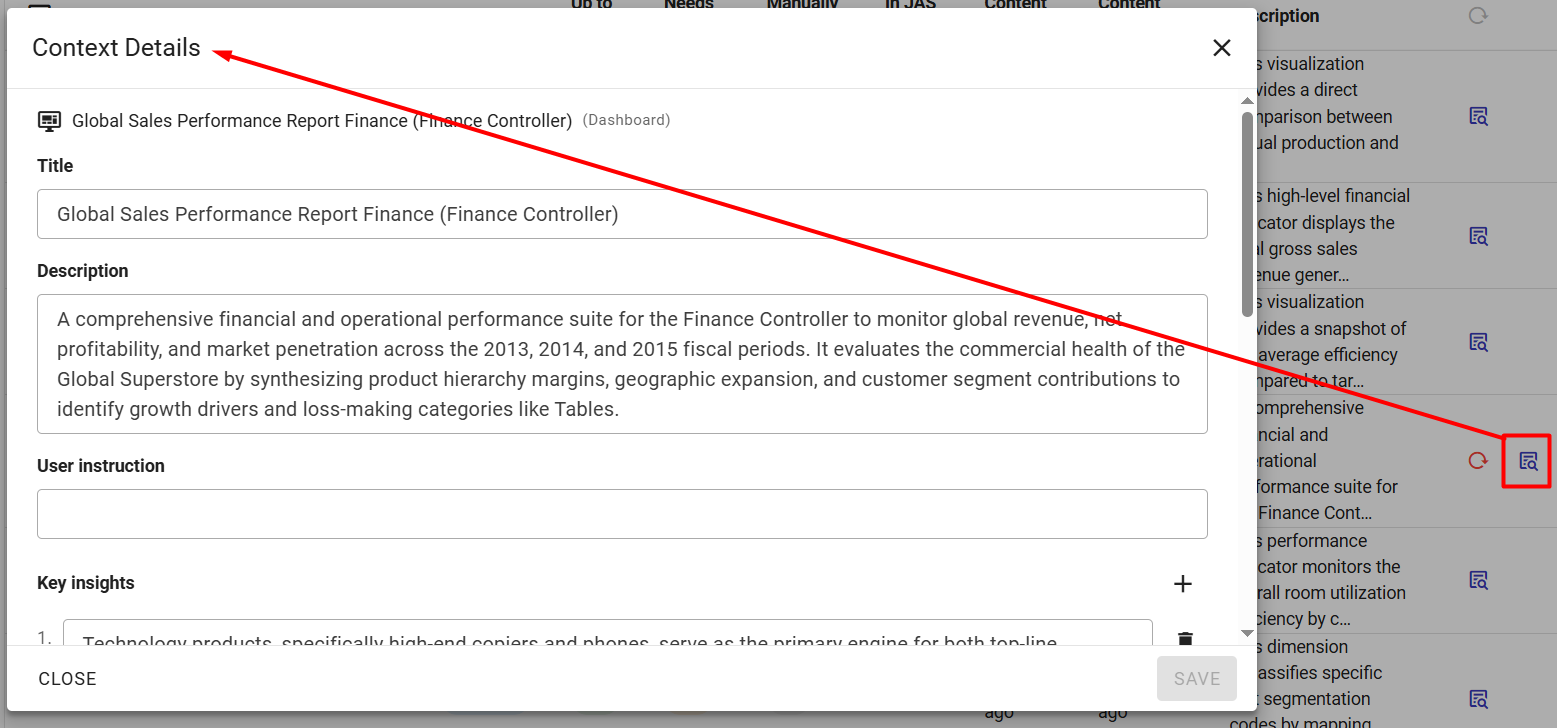
4 To view, write, or fix the AI's metadata, click the Show context details icon (document with magnifying glass) at the far right of the row. This opens the Context Details modal, containing the following editable fields:
- Title: The display name of the element.
- Description: The core narrative summary of what the element represents. You can manually overwrite the AI-generated text here.
- User instruction: Specific behavioral directives for JAS when it analyzes this exact element.
- Key insights: A managed list of discrete analytical findings. Use the
+icon to add new insights or the trash icon to remove irrelevant ones. - Possible questions: A curated list of natural language queries that end-users are likely to ask regarding this element.
- Tags: Semantic keywords associated with the element to improve JAS's retrieval accuracy.
5 Click SAVE to apply any manual modifications.
Speech Recognition
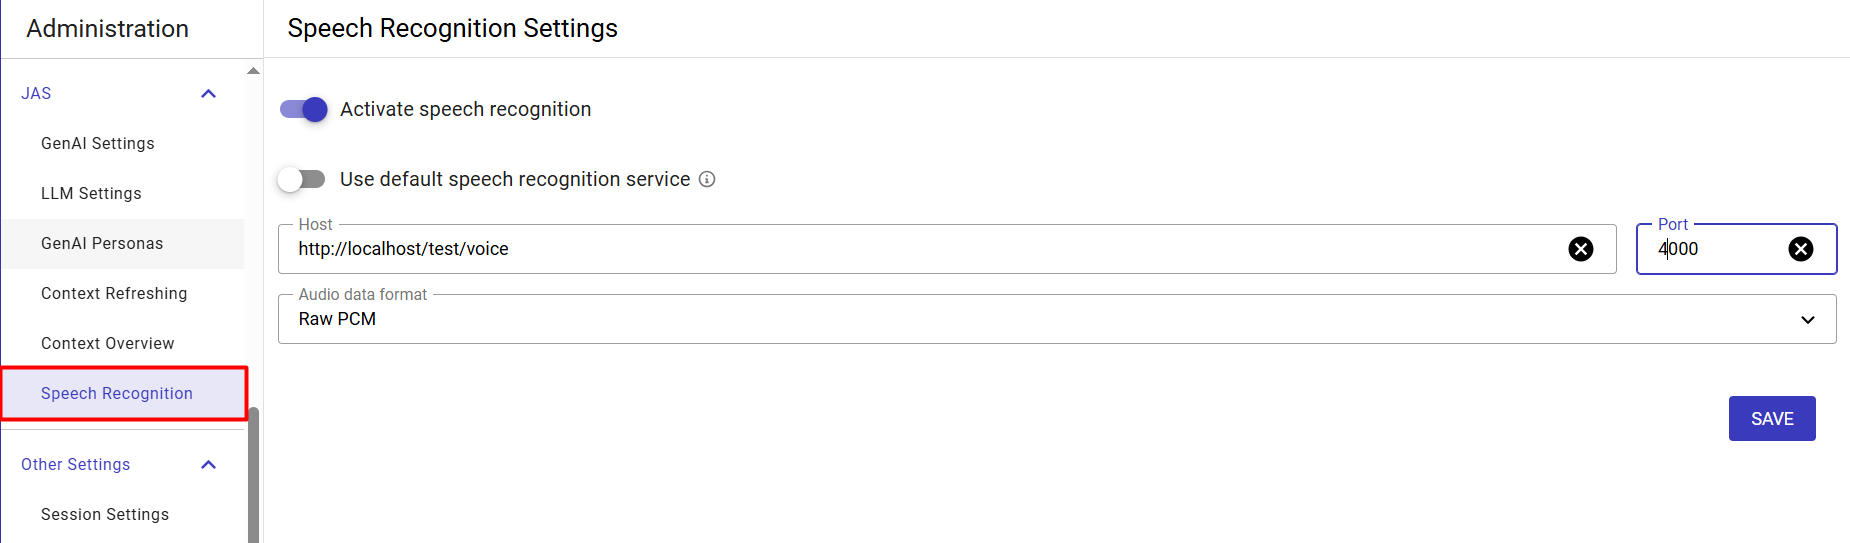
The Speech Recognition page allows administrators to configure the voice-to-text capabilities of the JAS assistant. By enabling this feature, end-users can interact with dashboards and generate analytical prompts using their voice instead of typing. Administrators can choose between a zero-configuration local browser model or route the audio to a custom, external speech-to-text service.
Activating and Configuring Speech Recognition
1 Go to Administration > JAS > Speech Recognition.
2 Toggle the Activate speech recognition switch to the ON position to enable the feature and reveal the configuration options.
3 Configure the underlying speech recognition service:
-
Use default speech recognition service:
- When enabled (ON): TURBOARD utilizes a built-in, local speech-to-text model. This default service runs entirely locally within the user's browser, downloading the necessary model data and storing it in the browser's cache storage. This provides a fast, secure, and privacy-focused voice experience without sending audio data to external servers.
- When disabled (OFF): Administrators can connect JAS to a custom, external speech recognition server or a locally hosted backend model.
4 If connecting to a custom service (the default service is toggled OFF), provide the necessary endpoint details:
- Host: Enter the URL or IP address of the external speech recognition endpoint (e.g.,
http://localhost/test/voice). - Port: Specify the communication port for the custom service (e.g.,
5000). - Audio data format: Select the specific audio format required by your external service from the drop-down menu (e.g.,
Raw PCM).
5 Click SAVE button to apply and activate the speech recognition settings.
Other Settings
Session Settings
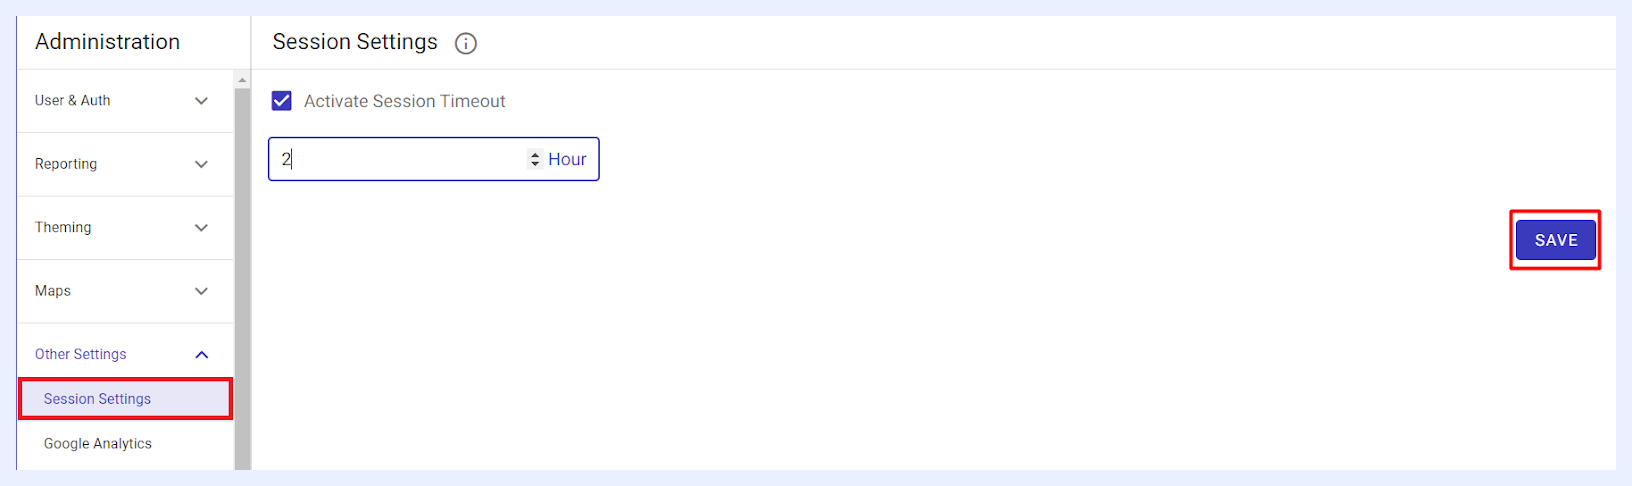
The default setting for session timeout for TURBOARD users is none. However, the Admin user can determine if a Session Timeout is needed for TURBOARD logged-in users.
If the “Activate session timeout” check box is checked and the number of hours is determined (as integer number), this means that the system will automatically terminate any user login session if within the determined interval this user has not performed any action on TURBOARD.
Google Analytics
If you wish to track and report the traffic on your web-based TURBOARD interfaces, you can configure its Google Analytics tracking feature in this section.
How to enable traffic tracking for TURBOARD site in Google Analytics?
1 Go to Administration > Other Settings > Google Analytics.
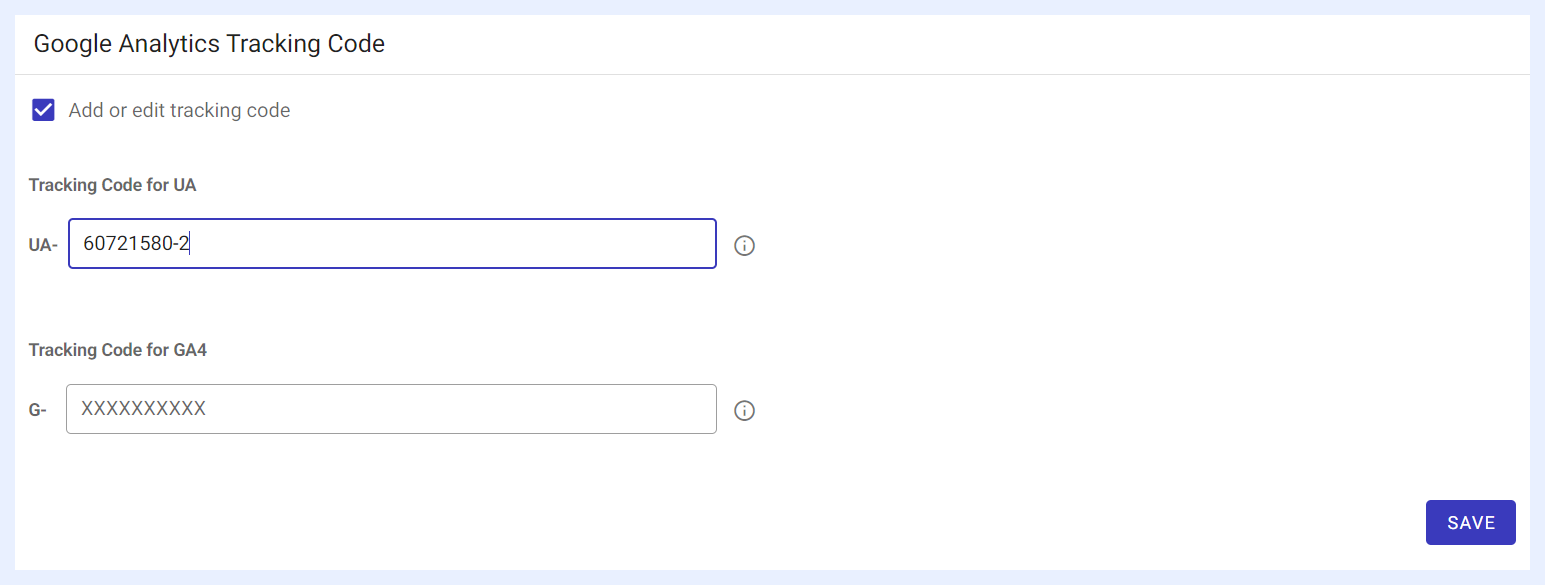
2 Check “Add or edit tracking” code check box.
3 Copy the tracking code of your TURBOARD workspace portal in the related field – according to the type of your Google Analytics property:
-
Tracking Code for UA: in Google Analytics, it is called the “Tracking ID” and is in the format “UA-XXXXXXXX-0”. If you configured your TURBOARD workspace portal as a UA property in your Google Analytics Account, go to the Universal Analytics Property admin section and copy the code part after “UA-” in this field.
-
Tracking Code for GA4: in Google Analytics, it is called the “Measurement ID” and is in the format “G-XXXXXXXX”. If you configured your TURBOARD workspace portal as a GA4 property in your Google Analytics Account, go to the GA4 Property admin section and copy the code part after “G-” in this field.
4 Click SAVE button. The script with the tracking code will be automatically added to your TURBOARD website.
Important
In order to activate this feature, make sure that you have a Google Analytics account and your TURBOARD URL is configured in it as a UA or GA4 property.
Numeric Abbreviations
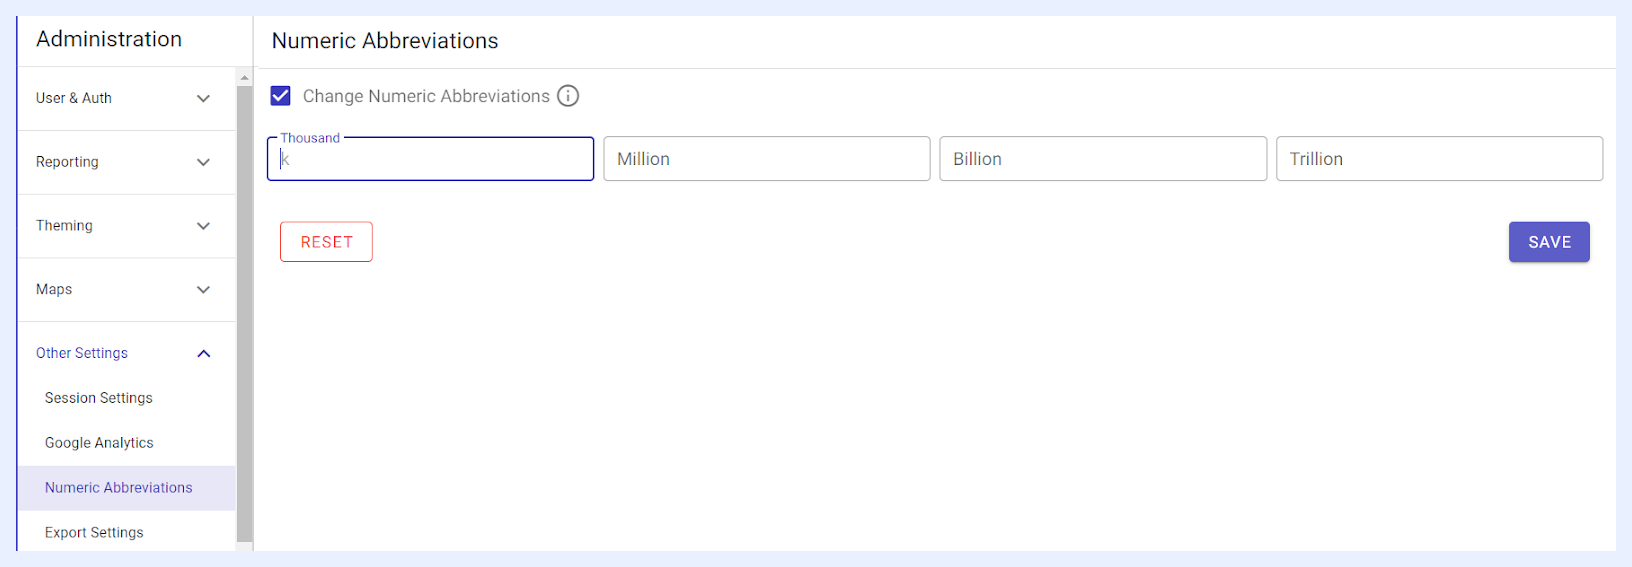
Abbreviations for numbers are pre-defined in TURBOARD interfaces according to the interface language. All numbers in thousands and bigger appear as abbreviations on all related dashlets in which “Thousands” are displayed as “k” for English (and “bin” for Turkish), “Millions” as “m” (and “milyon” for Turkish) and so on. However, the Admin users under this section can change or unify the numeric abbreviations for all interface languages.
1 Go to Administration > Other Settings > Numeric Abbreviations.
2 Check “Change Numeric Abbreviations” check box.
3 Type the abbreviations for numbers in the related fields.
4 Click SAVE button.
5 The abbreviations that you selected will be unified and will appear on all interface languages as set here.
Export Settings
Filter/Delay Settings
From this section, the Admin user can determine the general settings for the filters that are added to new dashboards.
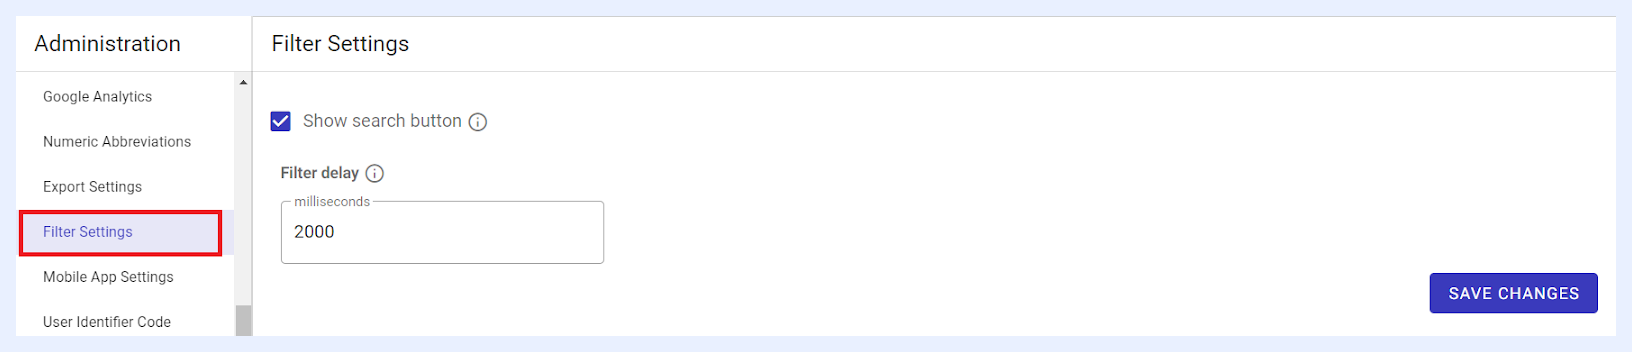
1 “Show search button” check box:
-
If checked: the
SEARCHbutton for the filters that are added to any new dashboard will be displayed on that dashboard. In this case, dashboard users shall manually click the button in order for the dashboard to apply the filters and fetch the results accordingly. -
If unchecked: the
SEARCHbutton for the filters that are added to any new dashboard will be hidden and the filtering will be automatically triggered when the dashboard user selects a new filter action. The delay time before the filter is automatically triggered will be according to the set time in “Filter delay” field.
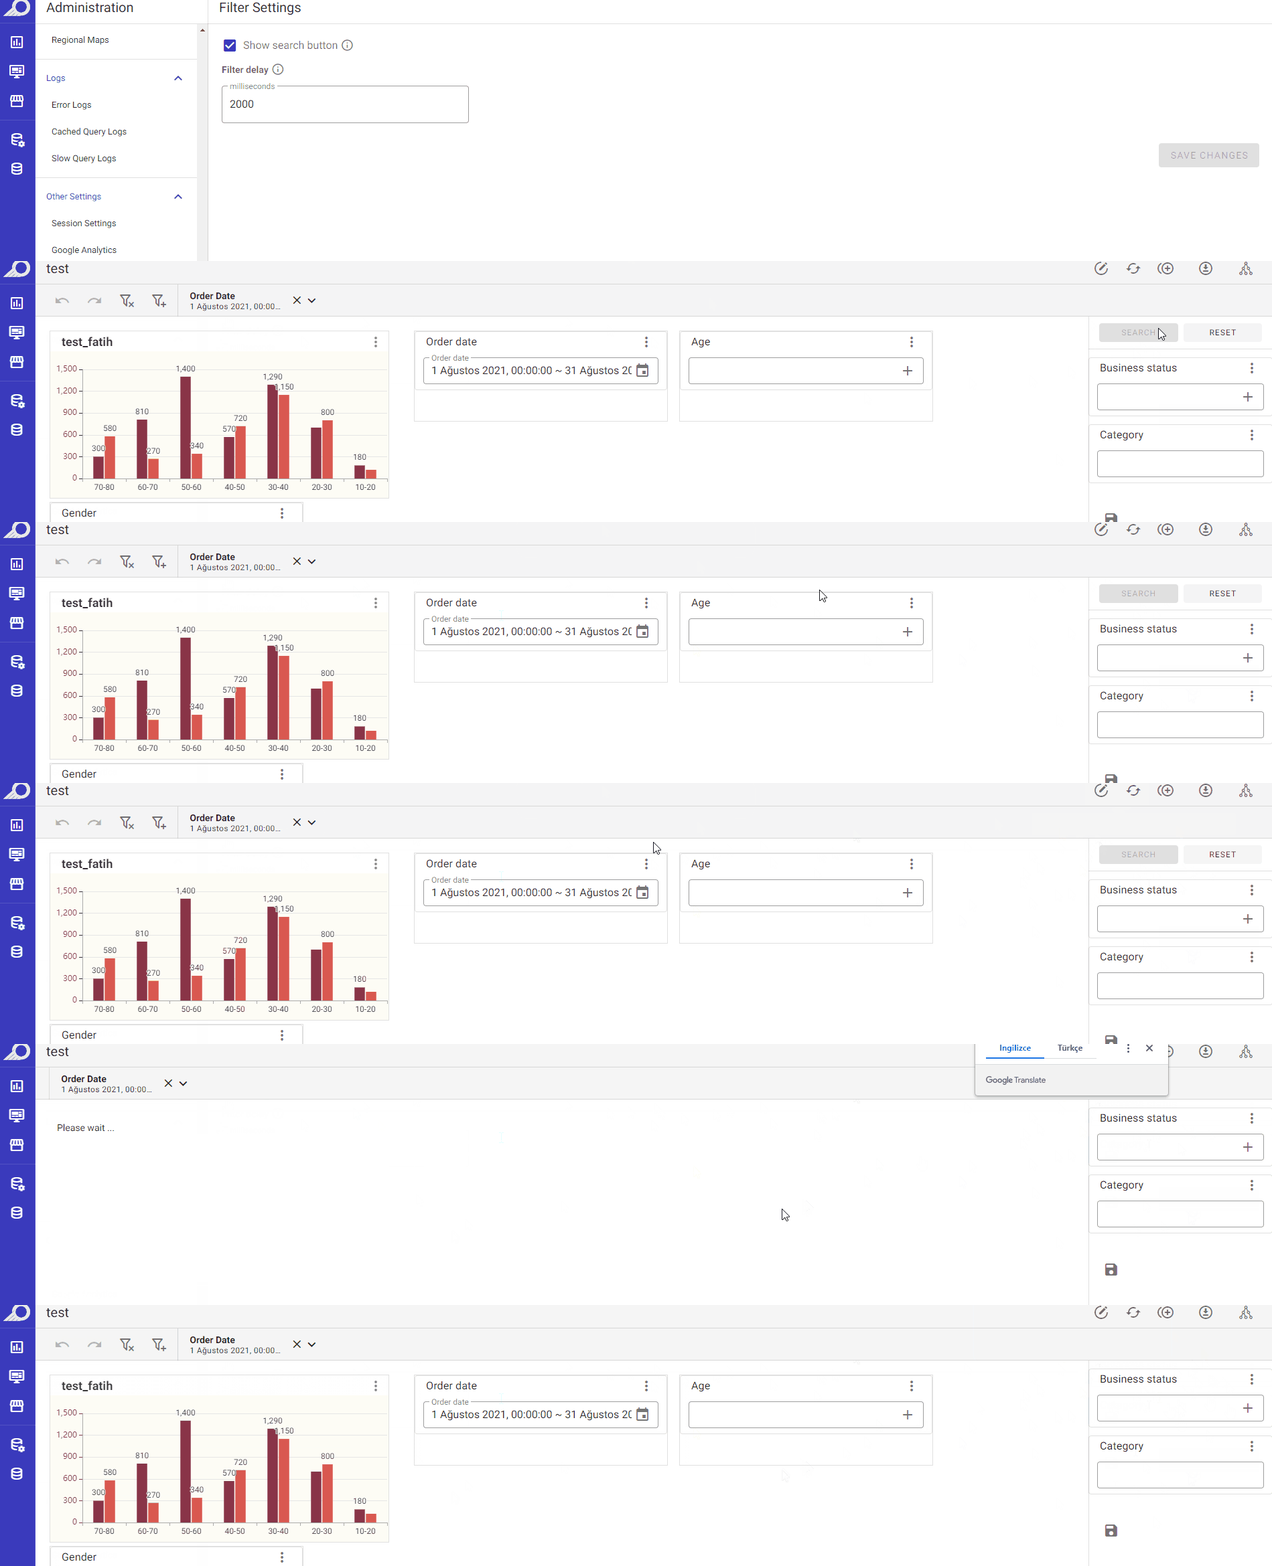
2 “Filter delay” field: if the SEARCHbutton is hidden in the dashboards (“Show search button” check box is unchecked), the admin user can determine the time period (in milliseconds) during which the system will wait for the user to finish making changes to the filters before automatically triggering the search function.
Note
The modifications/changes made to the visibility of the SEARCH button for filters in this section will only impact newly created dashboards. The filter settings of previously created dashboards will remain unchanged and assume the same settings as before the modifications were implemented.
Mobile App Settings
User Identifier Code
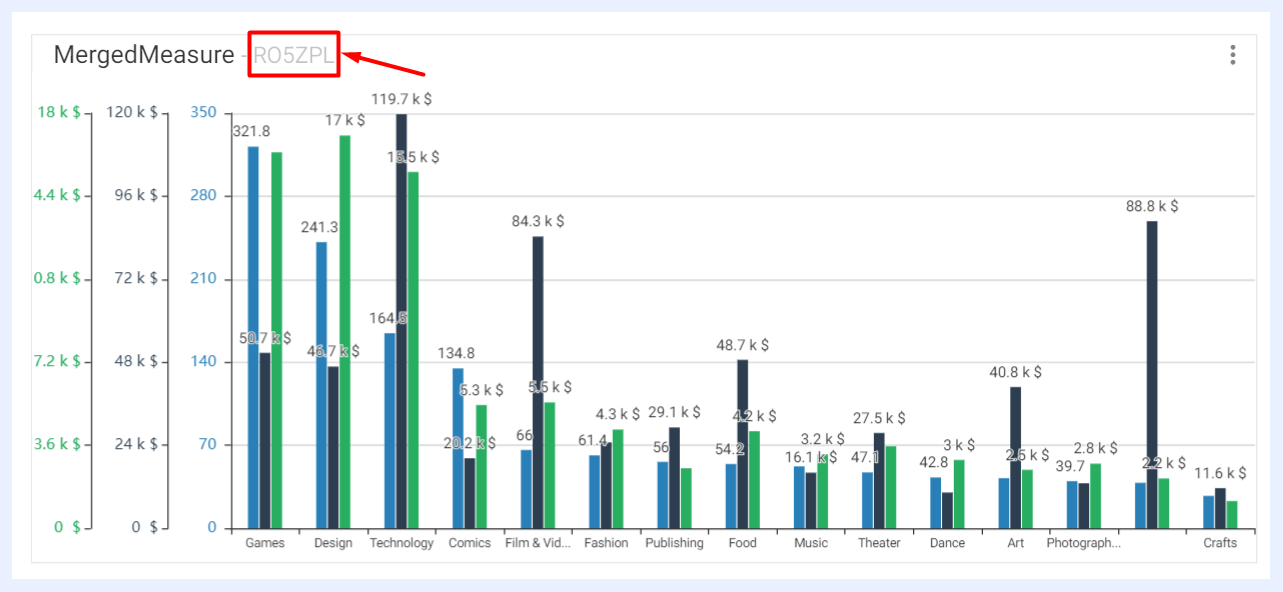
A unique identifier code is automatically assigned for each TURBOARD user in “View” mode of dashboards and showcases. This code is for the user who is viewing the dashboard and/or showcase and can optionally appear at the end of the dashlet title if set by the admin user from this section.
1 Go to Administration > Other Settings > User Identifier Code.
2 “Show user identifier code” check box: when checked, the user identifier code will appear on all dashboards and showcases for all users.
3 Click SAVE CHANGES button.
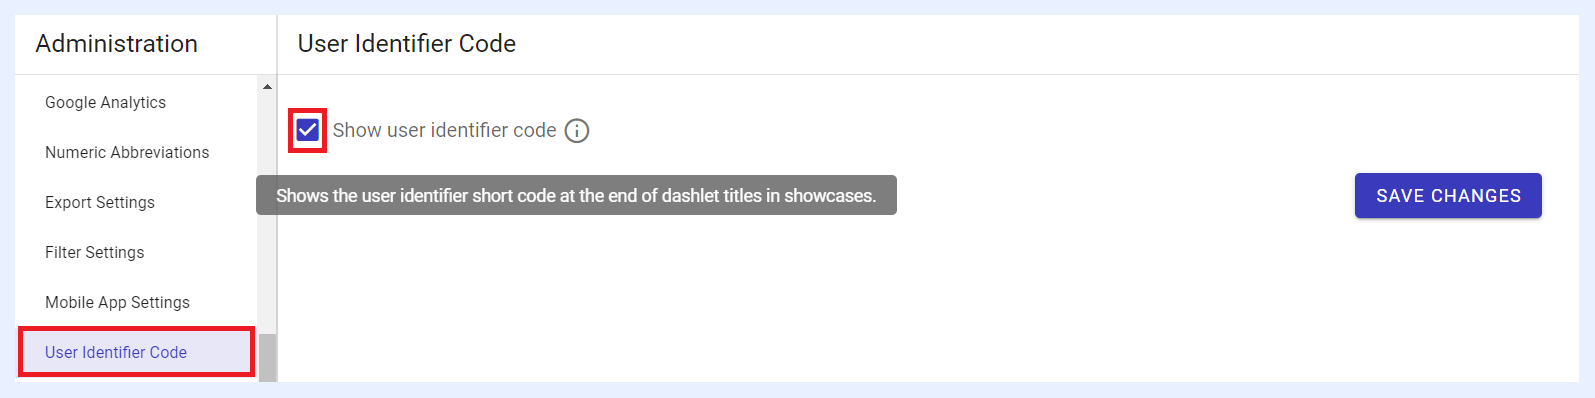
Displaying the user identifier code in viewed dashboards and showcases helps tracking user activities. For example, if a user takes a screenshot of the relevant dashlet and sends it to another place, it can be possible to know which user sent it from the code on the dashlet. If such cases occur and tracking such activities might be required, you may contact TURBOARD’s support team at support@turboard.com for help in this regard.
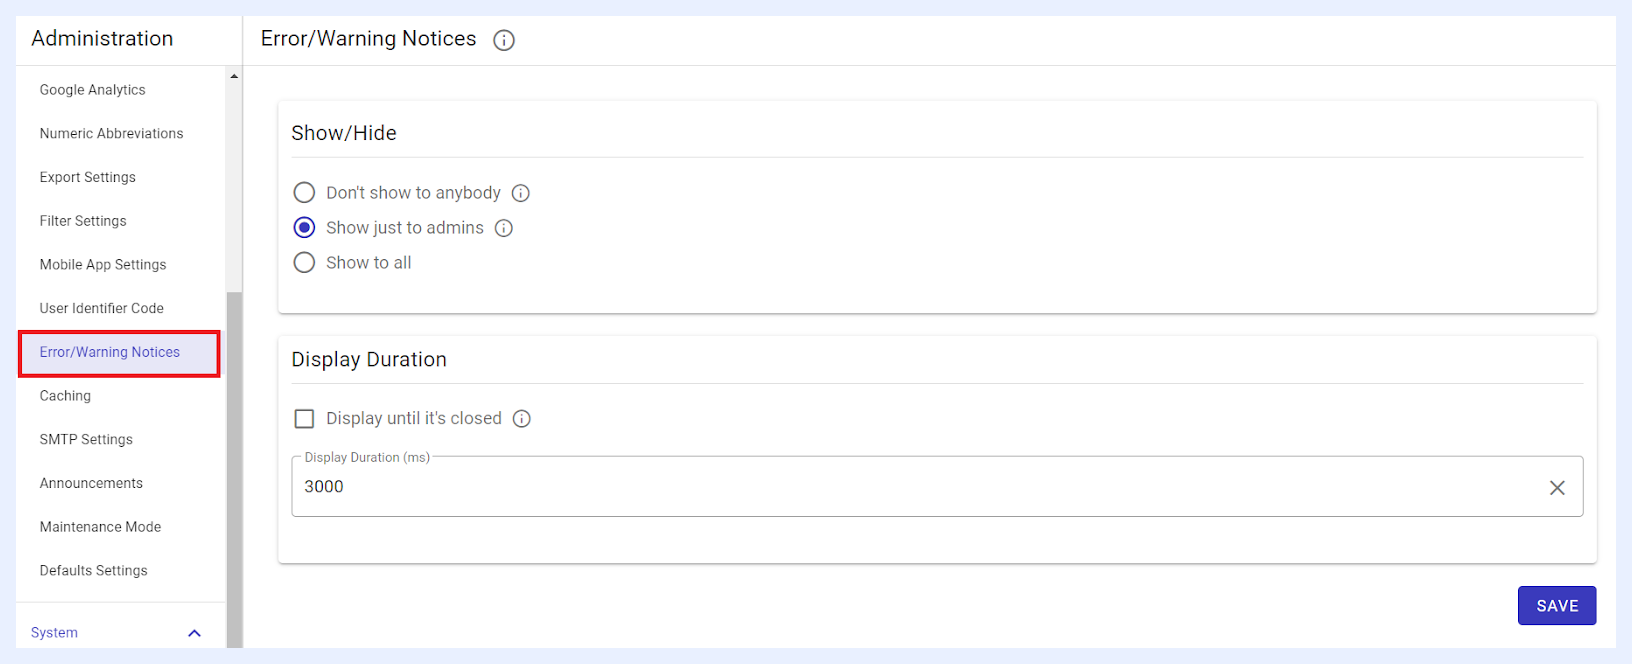
Error/Warning Notices
From this section, the Admin User can control showing/hiding from users the warning and/or error notices/ notification messages that will appear on their TURBOARD screens and how they will be displayed as below:
1 Who can see Error/Warning Notices:
-
“Don’t show to anybody” radio button: if selected, all Error/Warning Notices will not be displayed to any user.
-
“Show just to admin” radio button: if selected, Error/Warning Notifications will be displayed to all Admin and Designer users and only Viewer users will not see those notice messages on their TURBOARD screens.
-
“Show to all” radio button: if selected, Error/Warning Notices will be displayed to all user types.
2 Display Duration of Error/Warning Notices:
-
“Display until it’s close” check box: if checked, Error/Warning Notices that will appear to users will not be closed automatically but only when the user closes them by clicking
xwindow icon. -
Display Duration (ms) field: if the "Display until it's close" check box is unchecked, this field will be enabled. You can specify in milliseconds how long the notices should be displayed before the system closes their pop-up windows.
Note
The settings above will affect the errors and warnings related to developer-handled errors such as syntax, logic, run-time and semantic errors. Errors that are not handled by developers (such as server errors and security warnings) will be displayed regardless of the settings in the "Error/Warning Notices" section.
SMTP Settings
SMTP (Simple Mail Transfer Protocol) settings refer to the protocol and server details that are used by email clients or servers to send emails. These settings are usually set up in email clients (a computer program or application that is used to access and manage a user's email) like Outlook, Gmail, Yahoo Mail, etc., or email servers. They contain the essential information required to send and receive emails, such as the SMTP server name, port number, authentication method, and password.
In TURBOARD, the ability to send notifications and alerts to its users via email is a key feature. Therefore, it is important to ensure that the settings for this feature are configured correctly to guarantee that emails are successfully sent and received. In other words, the emails sent from TURBOARD to its users will be sent through the email client of the TURBOARD environment owner that is configured in this window.
Configuring SMTP Settings in TURBOARD
How to configure SMTP settings?
1 Go to Administration > System > SMTP Settings.
2 Fill in the SMTP details and settings in the related fields:
-
“Server Host” field: provide the server host name of the SMTP server that will be used when sending emails.
-
“Port” field: provide the port number used to access the SMTP server.
-
“SMTP User and Password” fields: enter the user mail and password used to authenticate the SMTP server.
-
“Sender Mail Address” field: enter the email address that will appear in the “From/Sender” section of the email when any email is sent from TURBOARD. You may leave it empty if you want the default email address to appear.
-
“Mail Footer” field: this option allows you to customize the content that you want to appear as the email signature (HTML code tags can be used to manipulate the design – if needed). It will be automatically added to the end of the sent emails and will replace the default text. If left blank, the default pre-configured text will appear at the bottom of the sent emails. See the images below.
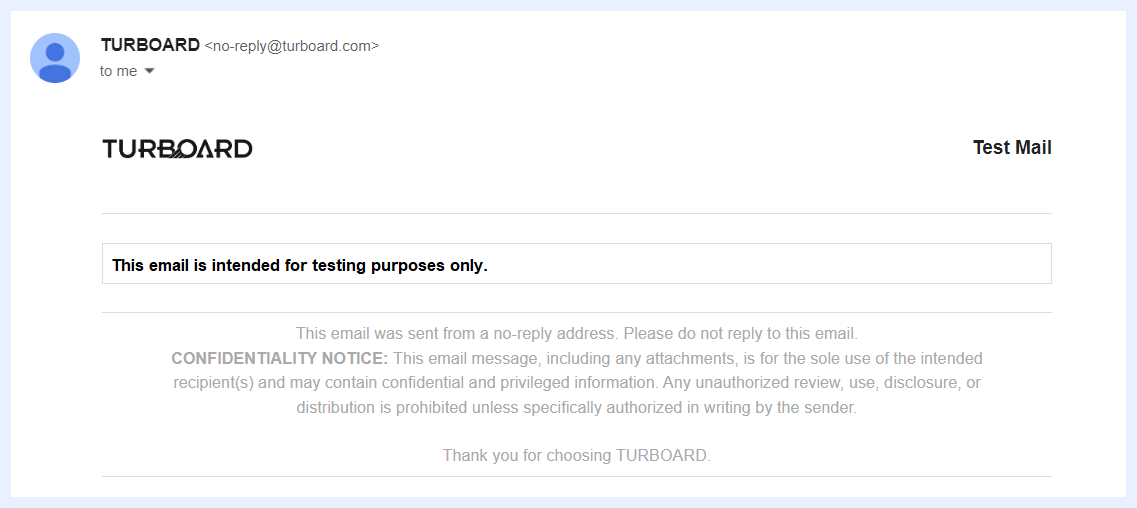
A test email sample with a customized footer
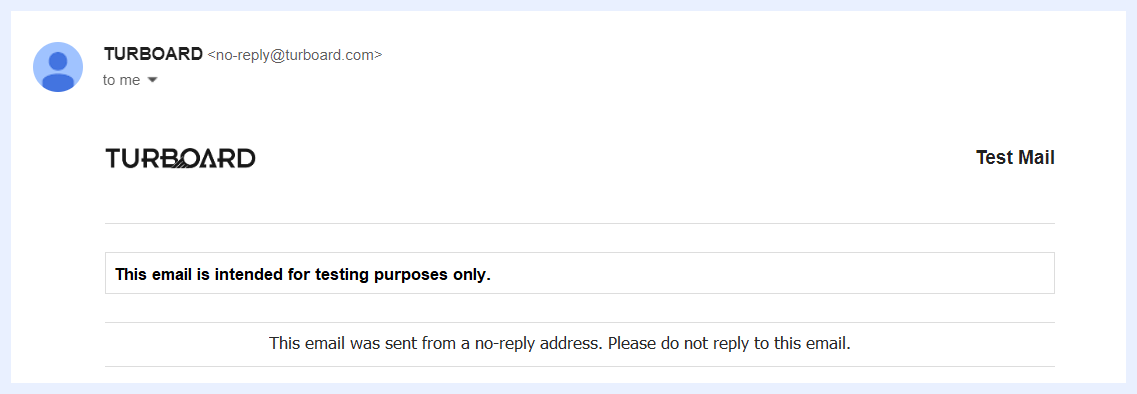
A test email sample with default footer
3 Select the connection security type from the radio buttons as below:
-
Secured connection using TLS: if selected, the sent email will be intercepted using TLS (Transport Layer Security) cryptographic protocol during transmission to protect the confidentiality and integrity of the email content.
-
Secured connection using SSL: if selected, the sent email will be intercepted using SSL (Secure Sockets Layer) cryptographic protocol during transmission to protect the confidentiality and integrity of the email content.
-
Unsecured connection: it is recommended that you send your email over a secure connection – either a TLS or an SSL as above. However, you may choose this option but the information in the sent emails will not be encrypted during transmission and its privacy therefore is not guaranteed.
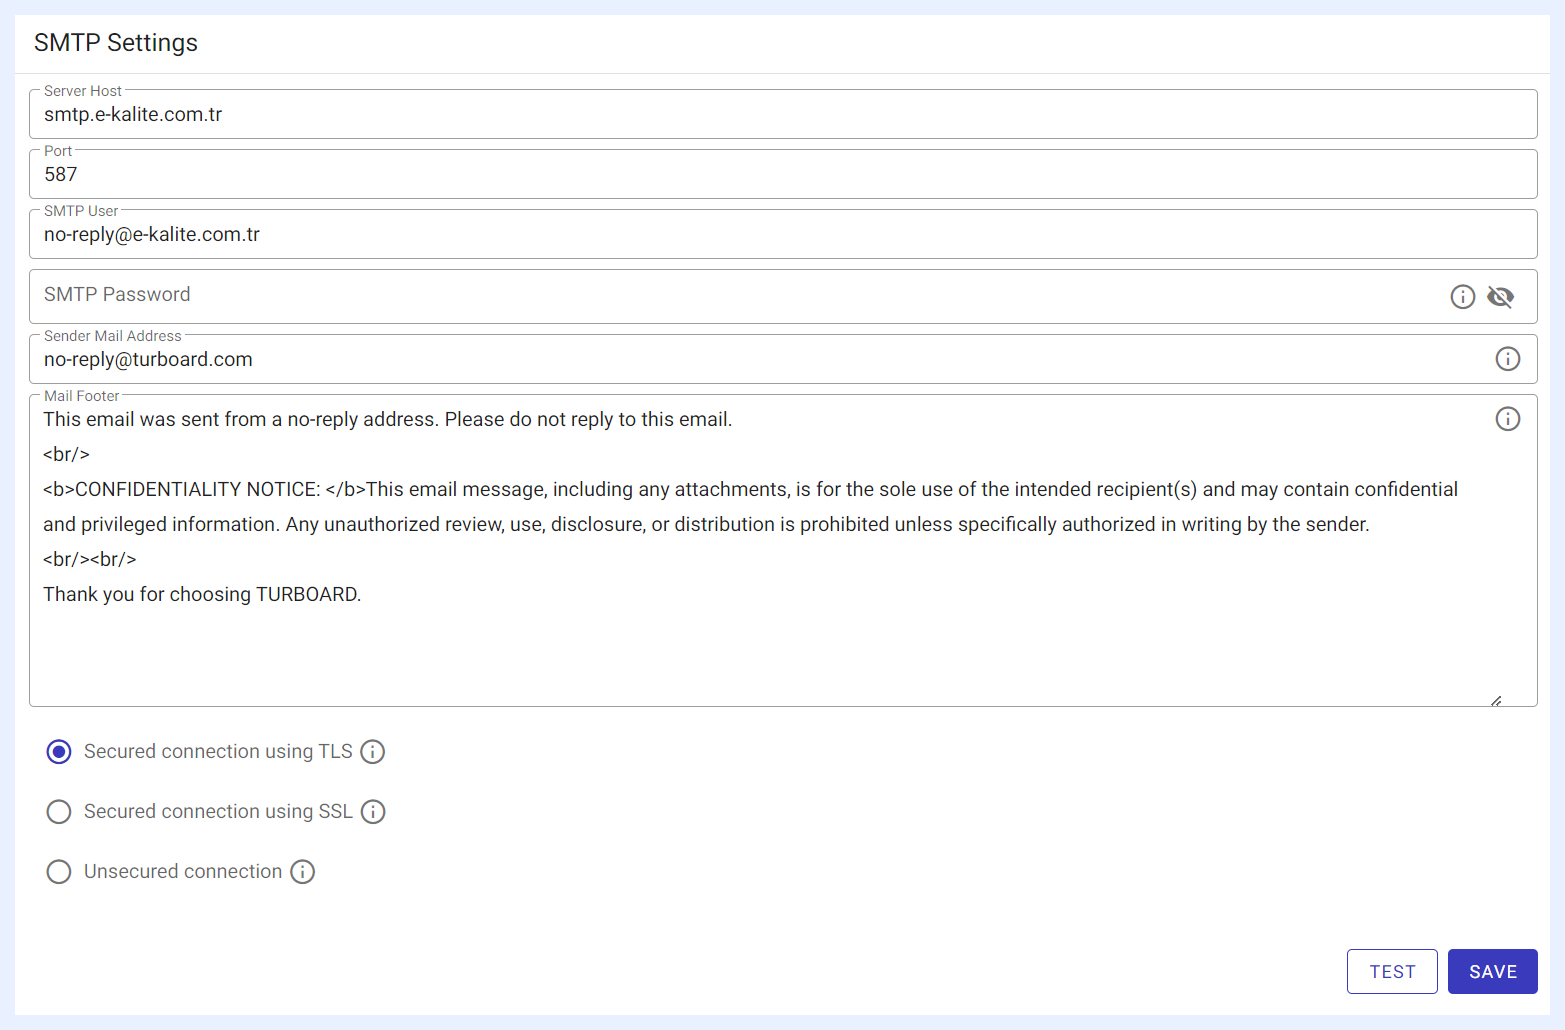
4 TEST button: when clicked, an overlay window will open in which you shall provide an email address in order to test the configurations above. Click SEND button once the receiver email address is entered.
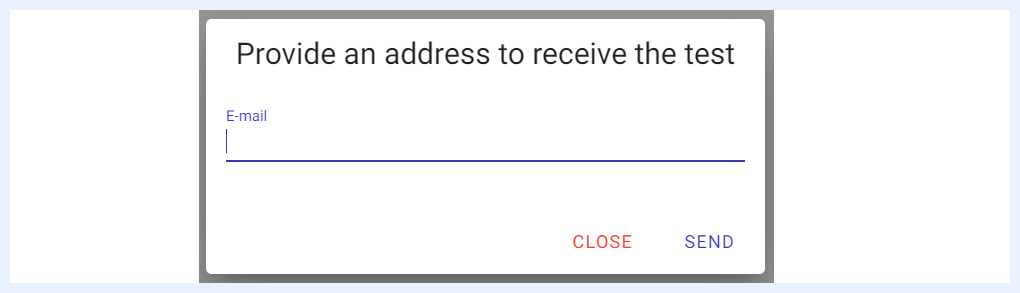
5 If the settings are all correct and the connection to the SMTP server is successful, a successful message will appear and the provided email address will receive a test email message automatically showing the sender email details as set above. Once done, click SAVE button.
Announcements
Under this section, Admin users can optionally set an announcement to appear to all TURBOARD users upon login. The announcement will appear as an overlay window in the login page, in which users can view/read it before logging in.
How to set an announcement for TURBOARD users?
1 Go to Administration > System > Announcements.
2 Click + Add a new announcementicon, and fill the fields in the “Add” window that opens:
-
“Title” field: the text you fill in this field will appear as the main title at the top of the announcement’s overlay window.
-
Announcement body text: use the HTML editor to write the content of your announcement.
-
“Kick out if not confirmed” check box: if checked, users cannot login to TURBOARD without clicking
ACCEPTbutton to go back to the login page. If unchecked, the user can either clickOKbutton orCANCELbutton and proceed to login.
3 Click SAVE button.
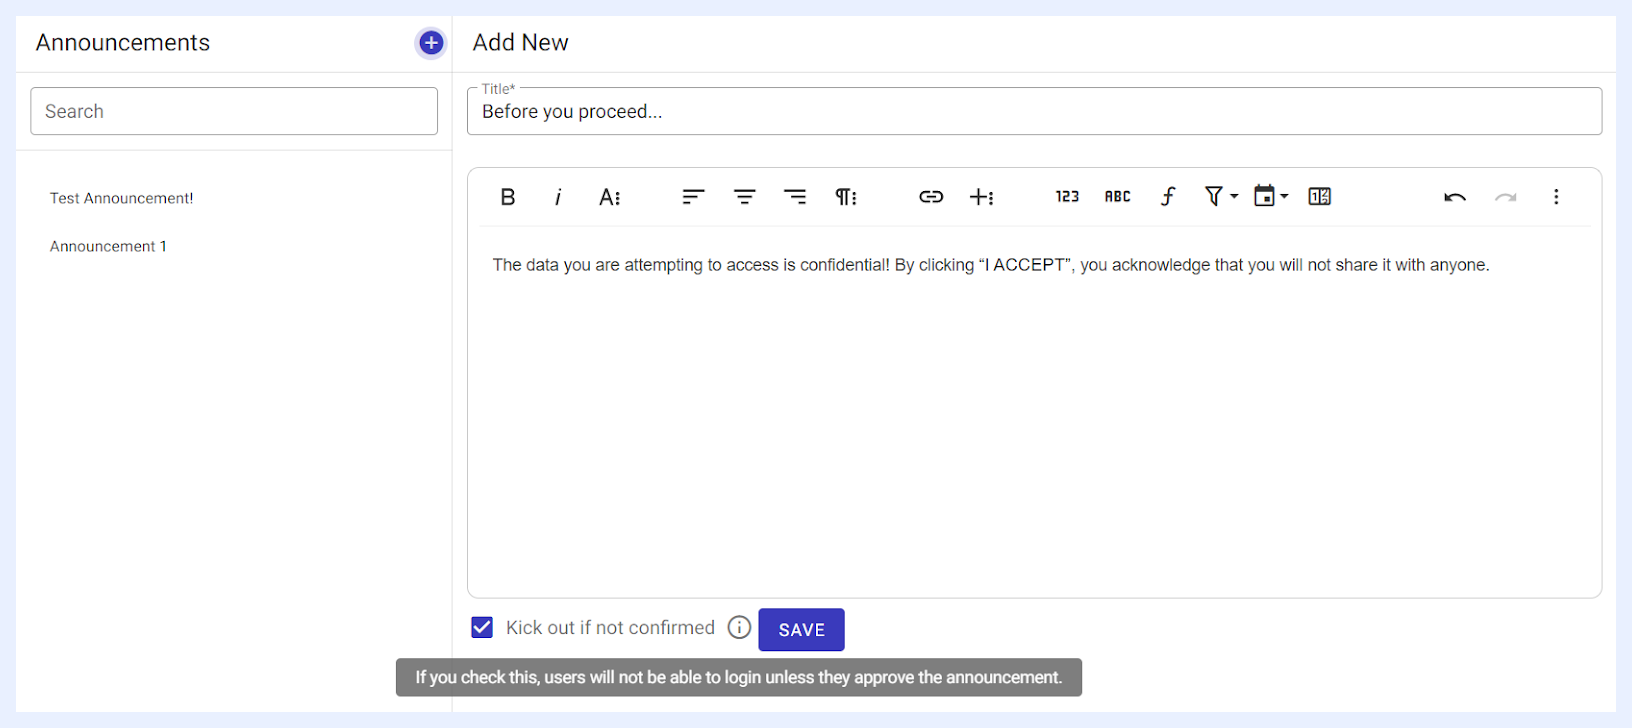
4 Once your announcement is prepared and successfully saved, select it from “Announcements” left-menu and click ACTIVATE button in the “Edit” window that opens.
5 The announcement set above will appear automatically to TURBOARD users when they attempt to login to the platform as an overlay window.
6 From the selected announcement “Edit” window, you can:
-
DEACTIVATEthe active announcement so it no longer appears on the login page, or -
REMOVEany added/saved announcement, or -
ACTIVATEanother announcement to replace the current active one.
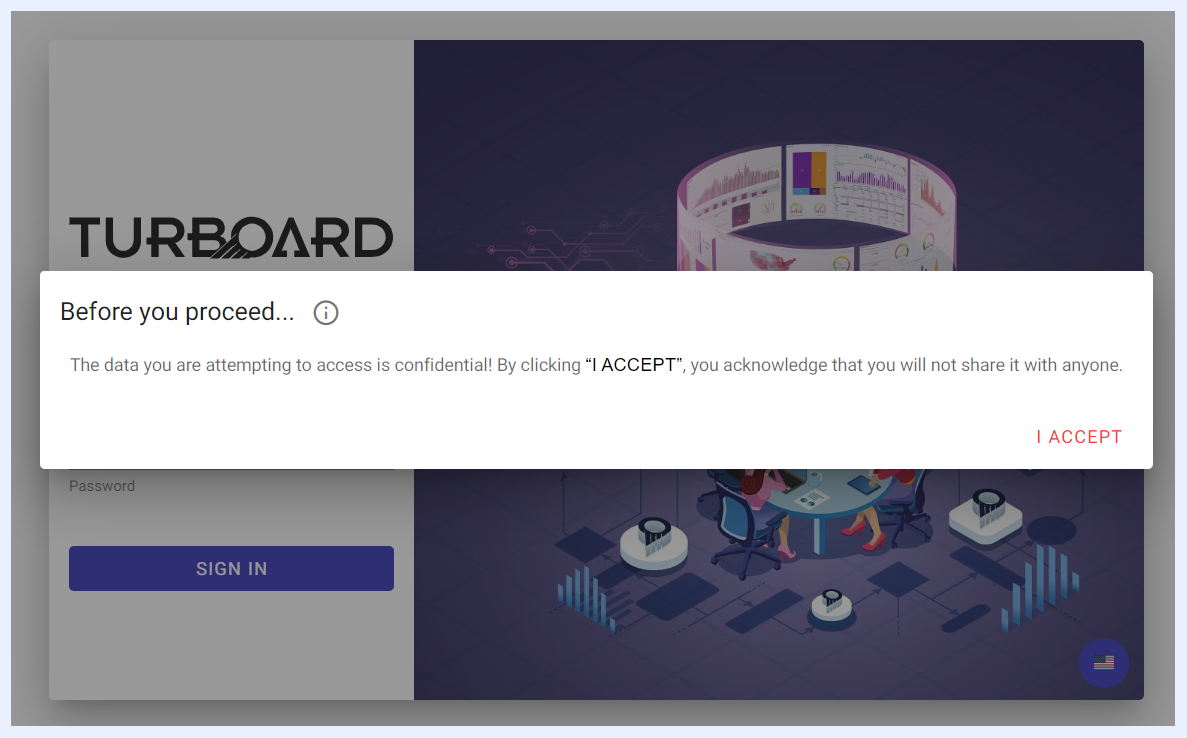
A sample of an announcement activated on TURBOARD Login page
Note
You may prepare and save as many announcements as desired, however, you can only activate one at the time to appear at the login page. The active announcement will be assigned a dark circle icon to indicate that it is active.

Maintenance Mode
In certain cases, a TURBOARD admin may need to prevent all users from temporarily logging into TURBOARD for reasons such as having critical or confidential data on the connected databases that shall be hidden from all users until decided otherwise.
From this section, the Admin user can deactivate all users’ access to TURBOARD and replace the login main screen with a special message indicating for example that the system is under maintenance or being not available for the time being.
Customizing & Activating Maintenance Mode
How to customize and activate maintenance mode feature?
1 Go to Administration > System > Maintenance Mode.
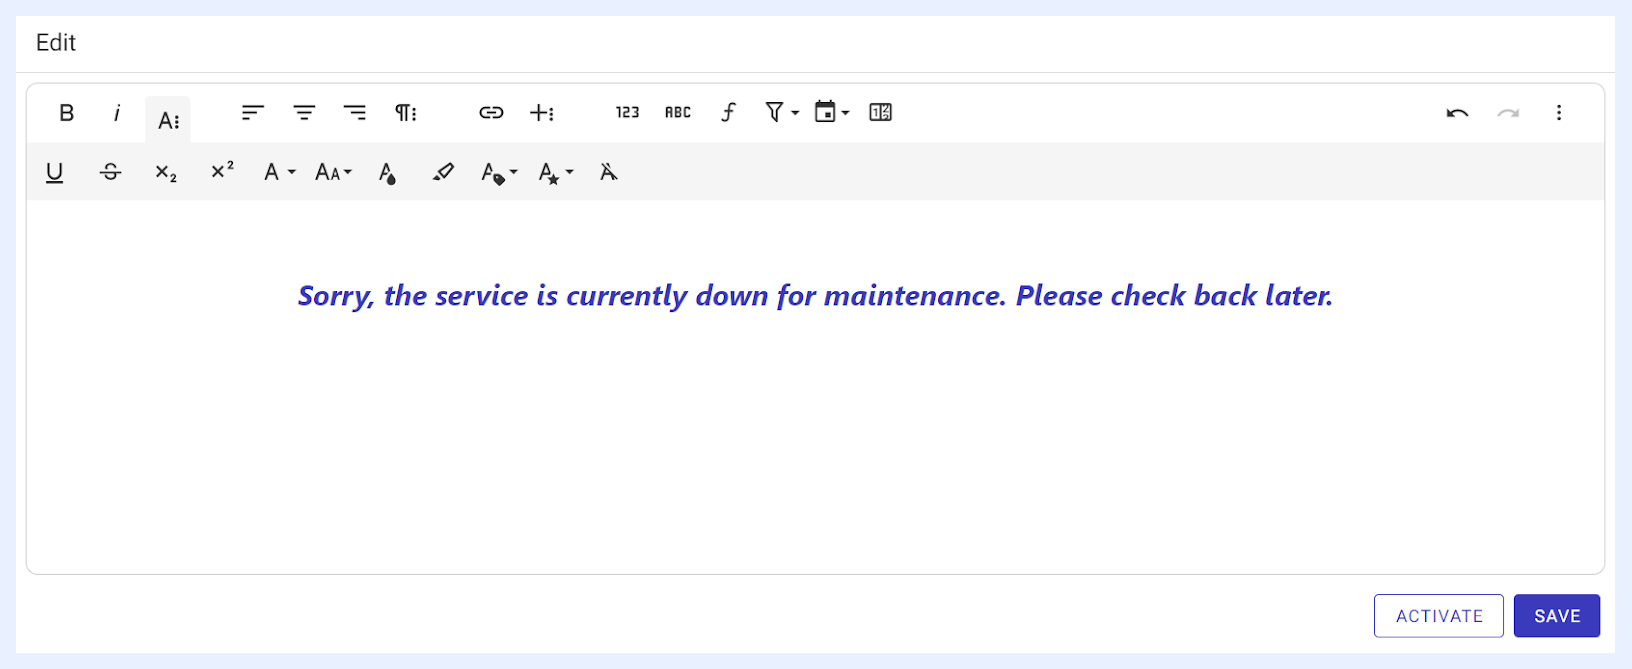
2 Type the content of the message that you want to appear to all users in the “HTML Editor” section in the edit window that opens. You may customize the content and its design as requested using the HTML editors’ available formatting and styling icons.
3 Click SAVE button to save the content that you have prepared. Note that this will not activate the maintenance mode but only saves your message.
4 Click ACTIVATE button to activate the maintenance mode and prevent all users from logging into TURBOARD. Upon clicking the button, the content will appear to any user attempting to login.
Important
If you choose to activate the maintenance mode, this means that all users, including you as a Super Admin user, won’t be able to access TURBOARD again. Therefore, you shall work with this option with caution.
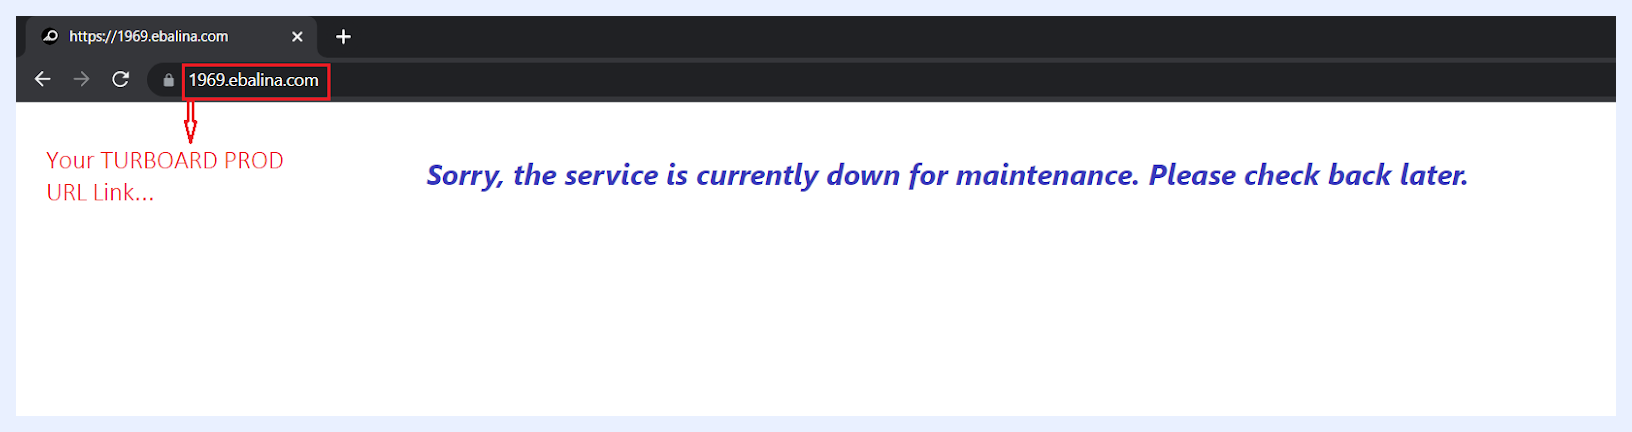
Sample of a Maintenance Mode page as will appear to End-users
Deactivating Maintenance Mode
How to deactivate maintenance mode and make TURBOARD available to access again?
1 When the maintenance mode is activated, this means that all users, including Super Admin users, won’t be able to login to TURBOARD again. Therefore, a Super Admin user can deactivate it and make TURBOARD available to access through a Django site admin page of your TURBOARD environment.
2 TURBOARD Support department will send to the Super Admin a URL link of TURBOARD’s Django site admin page in which he/she can login to it using the same credentials for his/her TURBOARD user account.
3 Once successfully logged in, the Admin user can select “Hide” radio button for “Maintenance Mode” section in “Settings” page.
Important
If you choose to activate the maintenance mode, make sure to contact support@turboard.com in order to obtain access link to Django Site Administration page.
Defaults Settings
This section empowers the Admin user to customize the default settings for TURBOARD’s visualizations, including dashlets, dashboards, and showcases. These settings determine the initial appearance and behavior of new visualizations created by authorized users.
When a new visualization is created in TURBOARD, it inherits pre-set default settings. However, these can be tailored by the Admin user to better align with organizational preferences through this window. For instance, when a new pivot table dashlet is created, it defaults to Auto-preview with standard TURBOARD styling and design. Through the Defaults Settings, the Admin user can modify these aspects, such as changing the default styling or enabling auto-refresh, which is not active in the original default settings.
Benefits of Customizing Defaults
This feature streamlines the visualization creation process, ensuring that new items automatically conform to an organization’s preferred style and functionality. For example, every new pivot table created in TURBOARD will adopt the Admin-defined settings, enhancing consistency across the platform. While these presets offer a standardized starting point, Designer users retain the flexibility to adjust settings on individual visualizations as needed.
How to Change Defaults Settings?
1 Navigate to Administration > Other Settings > Defaults Settings.
2 From the drop-down list(s), select the visualization type you wish to customize.
3 Click on the VIEW DEFAULT button. This action will open the edit window, displaying the default Settings and Configurations Panel for the selected visualization.
4 Within this panel, you can modify the settings as desired. These changes will automatically be saved and set as the new defaults for the respective visualization type.
5 Should there be a need to revert to the original default settings, the Admin user can easily do so. Simply return to the Defaults Settings page and click the RESET SELECTED button. This will restore the original default settings for the selected visualization type.

Changing the Defaults for a Dashlet / Pivot Table
Which Default Settings Can Be Changed?
The Defaults Settings screen allows the Admin user to customize various aspects of TURBOARD’s visualizations. The range of customizable default settings varies based on the type of visualization. Upon selecting a visualization type and clicking the VIEW DEFAULT button, the following options are available for customization:
-
Chart Dashlets: Settings and Styling configurations.
-
Pivot Table Dashlets: Settings and Styling configurations.
-
Info Cell Dashlets: Settings and Styling configurations.
-
Regional Dashlets: Settings and Styling configurations.
-
Geographical Dashlets: Settings configurations.
-
Dashboards: Settings, Styling and Filters configurations.
-
Showcases: Settings configurations.
Note
Modifications in the Defaults Settings only affect visualizations created post-change. Existing visualizations will maintain their original settings or as manually adjusted by their designers. This ensures that ongoing work remains unaffected while new creations benefit from the updated standards.
System
System Status
This section is a performance monitor (also called a system monitor) for TURBOARD platform. It provides updated information on TURBOARD’s performance and resource utilization metrics for the system’s hardware and software.
The upper section of the window is a display-only where the information and the parameters it displays can be refreshed by clicking Reload Parameters icon at the right-top corner.
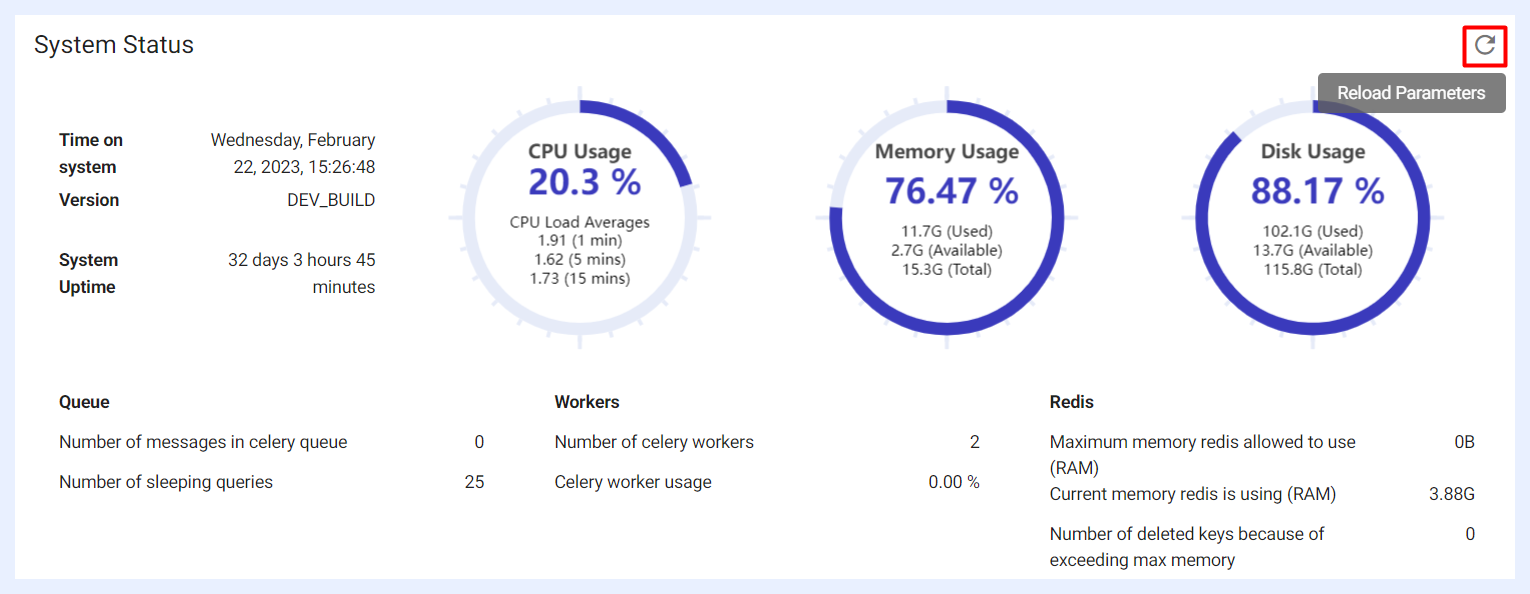
Time on system: shows the last time that the displayed information was refreshed and fetched from TURBOARD’s DB.
Version: TURBOARD’s release name/number.
System Uptime: displays the length of time that TURBOARD has been available and operational (continuously running without any interruptions) since it was last started or rebooted.
CPU Usage: indicates the amount of processing power being used by TURBOARD at the given “Time on System”.
Memory Usage: indicates the amount of system memory being used by TURBOARD and its processes at the given “Time on System”.
Disk Usage: indicates the amount of storage space being used on TURBOARD’s hard drive at the given “Time on System”.
Queue details: displays the total number of tasks that are waiting to be processed by the Celery workers, and the total number of database queries that are in a "sleeping" state at the given “Time on System”.
Celery Workers details: displays the number of the background processes that run and execute tasks and return the results back to TURBOARD at the given “Time on System”.
Redis details: displays the maximum amount of memory that Redis is allowed to use for caching data in RAM, the actual amount of memory that Redis is currently using for caching data in RAM, and the number of cache keys that have been deleted from the Redis cache due to exceeding the maximum memory limit.
Monitoring such metrics and parameters by the system administrator(s) is crucial for optimizing TURBOARD system performance, troubleshooting issues, planning for storage capacity and resources, and minimizing downtime and disruptions to its operations.
Terminal Commands Section
“System Screen” and “Run Command” sections at the lower part of the window provide access to the application's command line interface (CLI). It allows a direct connection to TURBAORD’s “Terminal Command Prompt” to enable performing/running useful commands as below.
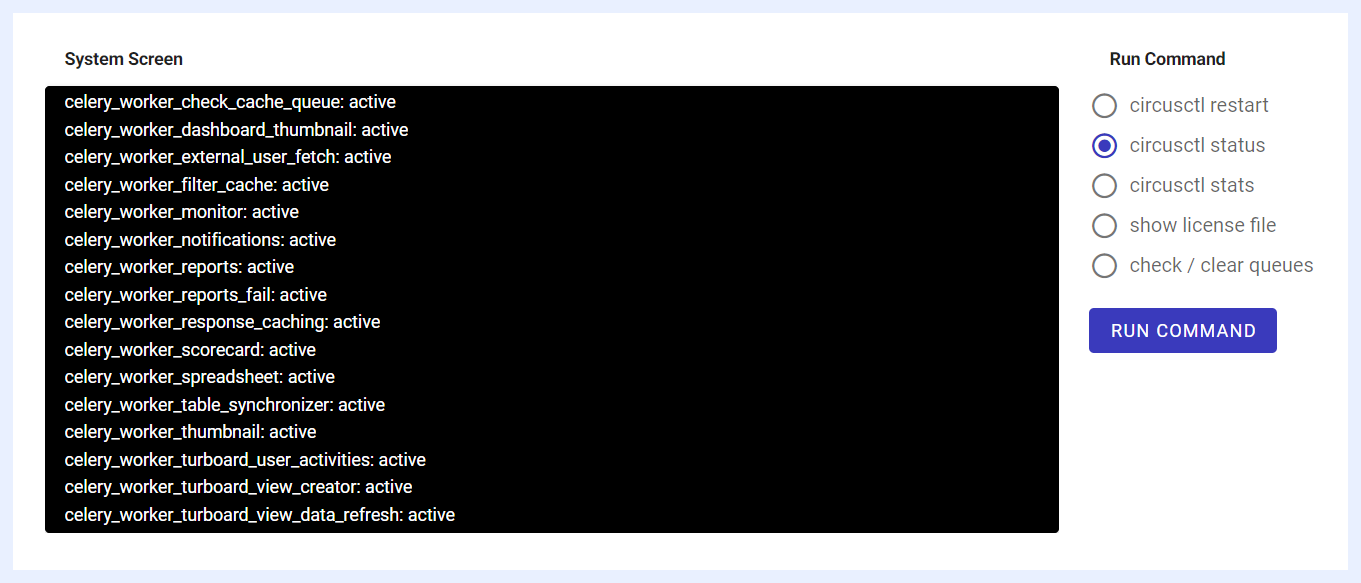
1 Select the command that you want to run in the Circus process manager through the CLI (Command Line Interface) from the available options (radio buttons):
circusctl restart: if run, it will stop all the managed processes, and then start them again. This can be useful when you need to make changes to the configuration of the managed processes or if they are experiencing issues that require a restart. However, this command shall be used with caution as restarting the processes may cause a few seconds’ temporary disruptions or downtime for TURBOARD users.
circusctl status: if run, it will return information about the current state of TURBOARD managed processes, the status of the Circus process manager itself, resource usage, and any log output that is being generated. This command can be useful for troubleshooting issues and to monitor the system performance.
circusctl stats: if run, it will display real-time statistics about the managed processes in Circus process manager that can be useful for monitoring the performance of TURBOARD processes and identifying potential issues.
show license file: if run, it will display the license file associated with your TURBOARD environment including the license agreement, contents, terms and conditions, validity period, users’ types and count, available features and configurations, etc. This command helps you review your license agreement and follow it up before its expiry for example.
check / clear queues: if selected and run, this command will first check for any tasks that are pending in the queue and not being processed. If there are tasks that have been stuck or pending for an extended period, this command will attempt to clear them from the queue to ensure smooth operation. This can help in resolving bottlenecks in task processing and preventing delays in system operations. Use this function to maintain optimal flow of tasks and to preemptively manage any queue-related issues that might affect TURBOARD's performance.
2 Click RUN COMMAND button.
3 The command will run automatically and will return results on the “System Screen” at the left side.
Licensing
This section is used to install your TURBOARD license. As a Super Admin user, you can upload the TURBOARD license file with “.lic” extension from your computer and perform the license installation process in a few steps.
The license file will be sent to you by our support team once the license is purchased so its features and functionalities will be unlocked and applied to your TURBOARD environment.
1 Go to Administration > System > Licensing.
2 Click the Upload option and upload the license file. Note that the file upload dialog box will allow uploading the correct file type, i.e. license files with “.lic” extension only.
3 Once the correct license file is selected (a turboard.lic file) and Open is clicked, TURBOARD will automatically detect the license file and APPLY button will be activated accordingly.

4 Click APPLY button. The content of the uploaded file and the details of your license will be displayed under “License Info”.
5 TURBOARD will restart automatically in the background so that the license functionalities and features will be applied shortly after.
Logs
A log is a record of events and activities that occur while working on TURBOARD. Log files are generated automatically by TURBOARD system, and they contain information and diagnostic data that are valuable to the system administrators, TURBOARD developers, and the support team.
A dropdown list at the top of the window allows for the selection of different log types. By default, “app_error” is pre-selected and displayed upon opening the window.
Alongside each log type in the dropdown, the last updated date and time are shown, giving a quick reference to the freshness of the data.
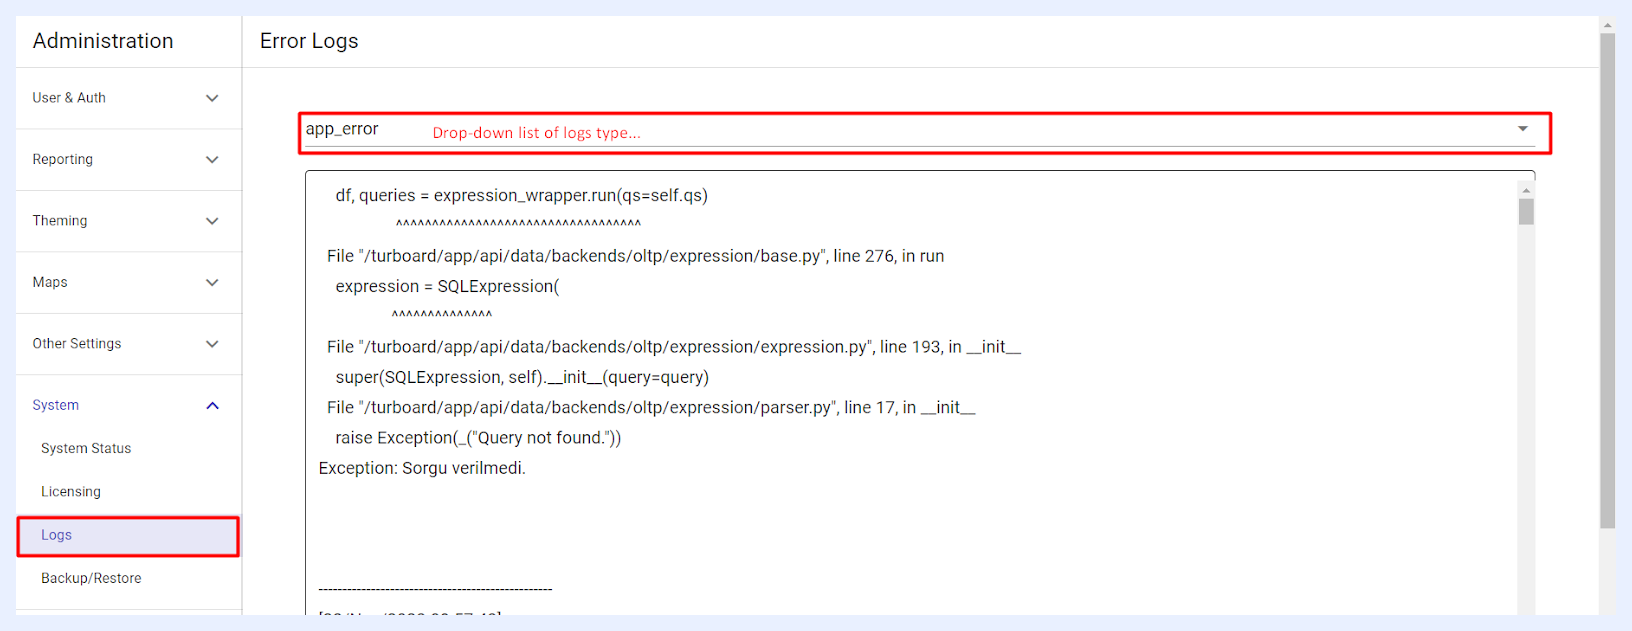
Each log type can be downloaded as a text file (.txt) using the corresponding download button labeled with the log type located at the bottom of the window. This facilitates offline analysis or sharing with TURBOARD support team when needed.
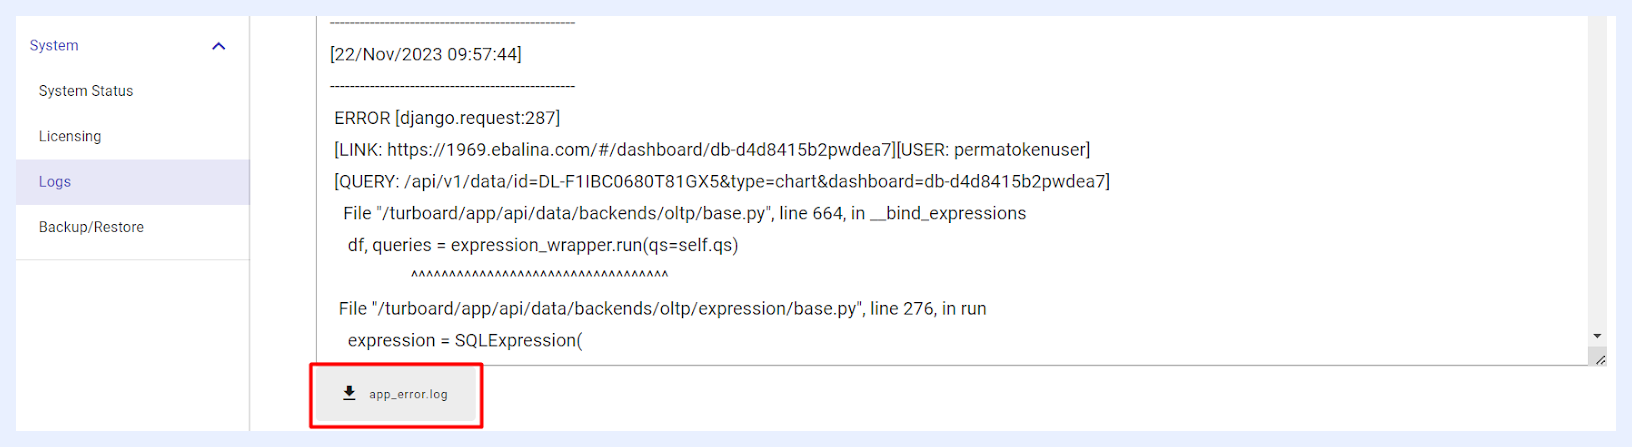
Log Types Explained
In the Logs section of TURBOARD, a variety of log types are meticulously recorded, serving as key instruments for system monitoring and troubleshooting. These logs capture a wide range of operations from backend automated query executions and administrative tasks such as data backups to user-centric activities including notifications, report generation, and the automated creation of spreadsheets from visualizations.
Below, some of these log types are further explained, detailing their specific functions and importance.
Error Logs
-
app_error: This log type records application errors, providing stack traces and code references to help identify and diagnose issues swiftly. It includes timestamps, user information, and specific error messages like “Redis is loading the dataset in memory”, which are crucial for quick and effective problem resolution within TURBOARD.
-
slow_query: This log captures queries that exceed a predefined execution time threshold, highlighting potential inefficiencies. By reviewing these logs, administrators and developers can identify slow-running queries and optimize them for better performance, ultimately enhancing TURBOARD's overall speed and efficiency.
-
interface_server_error: The log reflects a series of warnings and errors related to database operations, file handling, and authorization issues in the web application.
-
turboard_user_activities_error: This log type chronicles the scheduled indexing tasks of user activities on TURBOARD, marking the beginning and conclusion of bulk data processing. With precise timestamps, it provides a regular, hourly record of indexing, crucial for maintaining an organized and searchable system of user interactions. These logs serve as a confirmation of the system's diligent refresh of user activity data.
-
celery_beat_error: This log type captures errors encountered within the task scheduling component of TURBOARD, specifically within its use of Celery Beat. The logs include issues such as database integrity errors where certain expected values are null, and connectivity problems with Redis, a key-value store used for task queuing. The entries indicate attempts to reconnect to Redis, with retry counts and intervals specified, highlighting the resilience mechanisms in place to handle such disruptions. These logs are vital for identifying and resolving backend scheduling and data consistency issues.
-
response_cache_renew_error: This log captures various warnings and errors related to the response caching mechanism within TURBOARD, indicating issues such as significant time drifts between services suggesting possible clock synchronization problems, and multiple connectivity issues with Redis—a key-value database that supports caching operations. There are also warnings against using DEBUG settings in production due to memory leaks and notices of failed attempts to load invalid JSON from the database. These logs are critical for maintaining operational integrity and performance of backend services and for ensuring data consistency.
-
external_user_fetch_error: This log type details the process and potential issues encountered during the retrieval and management of user data from external sources into TURBOARD. It includes timestamped warnings about the completion of data fetching, user processing, insertion of restrictions, and the clearing and adding of users to groups. It also records the time taken for each step, highlighting any errors such as old restrictions removal and total time for the fetch process, which is critical for diagnosing issues in data synchronization and integration workflows.
-
view_data_refresh_error: This log type captures errors associated with attempts to refresh view data within TURBOARD. The entries contain error notifications at various timestamps, indicating that specific “View” or “ViewDataRefreshTask” objects are not found in the database. These errors point to issues with the existence of certain records expected during the data refresh tasks. The logs detail the traceback of the errors, showing the function calls leading to the exceptions, which can be instrumental in tracing and resolving the underlying issues related to data retrieval or integrity in the system's operational flow.
Informative & Monitoring Logs
-
response_cache_renew_info: This log tracks the performance of the caching system within TURBOARD, documenting each attempt to cache data and whether any changes occurred. It shows the precise times when caching processes start and complete, and if there were any updates or no changes to the cached data. Regular entries with “No changes” indicate stable data, while entries with “Caching started” and “Caching finished” reflect active updates. This log is useful for monitoring the efficiency of the caching system and ensuring data freshness.
-
turboard_user_activities_info: This log type chronicles bulk operations involving user activities on TURBOARD servers. It logs successful HTTP POST requests to a server endpoint, indicated by a 200 status code, and notes the response time for each operation. These logs are essential for tracking the efficiency and speed of bulk data transactions related to user activities within TURBOARD.
-
celery_worker_filter_cache_info: These logs detail the caching activities performed by TURBOARD's background workers, specifically related to filter restrictions. Each log entry marks the commencement and completion of the caching process for different filter identifiers. The logs ensure that filters are being cached correctly for efficient retrieval, which is crucial for performance optimization when applying these filters to data queries or user access controls. These entries are a testament to the system's ongoing operations to maintain up-to-date and accessible data filtering mechanisms.
Backup/Restore
System Update
Current Filter Queue
The “Current Filter Queue” page gives administrators visibility into exactly what is queued for cache processing. From this page, queued items can be reviewed by Filter, View, and Priority, specific items can be deleted from the queue, and items can be moved to the top of the queue for priority processing. Manual cache refresh requests are automatically assigned the highest priority.
Background Processes
The “Background Processes” page under the System menu provides a real-time overview of all running background tasks. For each process, it displays the process name and description, the message count and last run date, and per-process Start / Stop controls along with a Clear Queue action. A quick shortcut to the Logs page is also available for troubleshooting individual processes.